
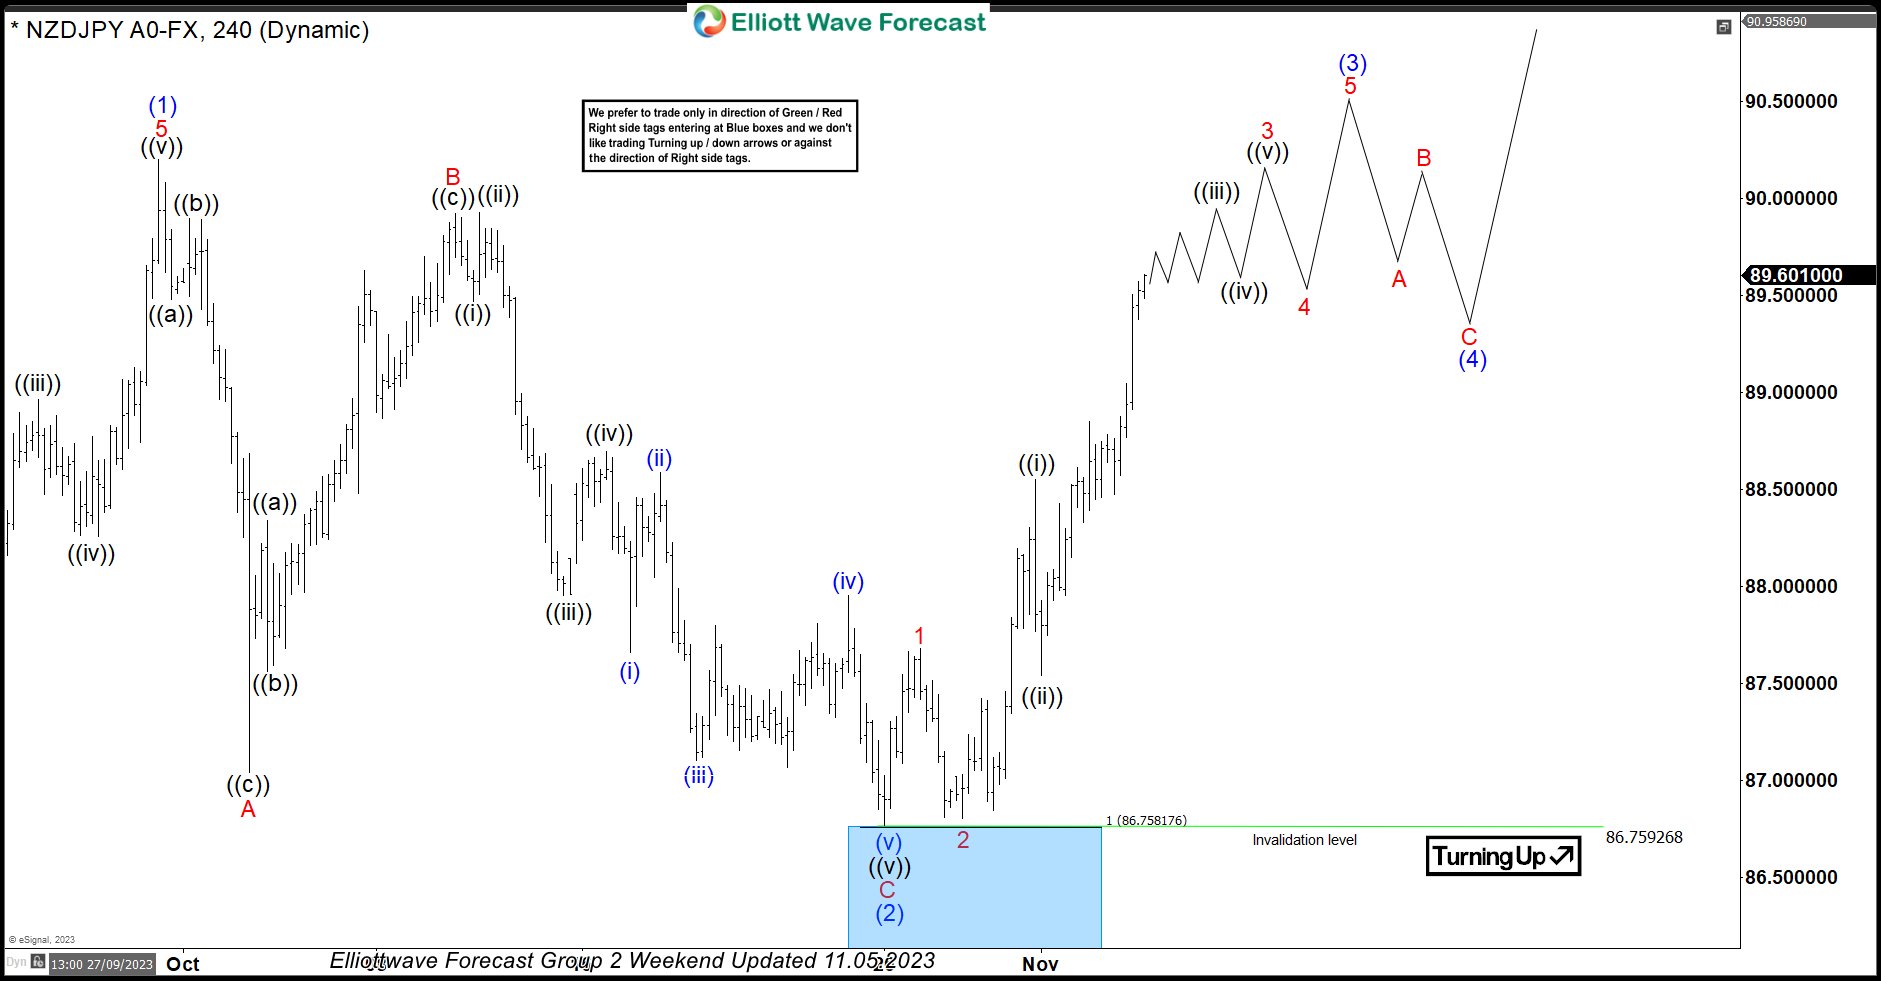
In this technical blog, we will look at the past performance of the 4-hour Elliott Wave Charts of NZDJPY. In which, the rally from 24 March 2023 low unfolded as an impulse sequence and showed a higher high sequence. Therefore, we knew that the structure in NZDJPY is incomplete to the upside & should extend higher. So, […]
-
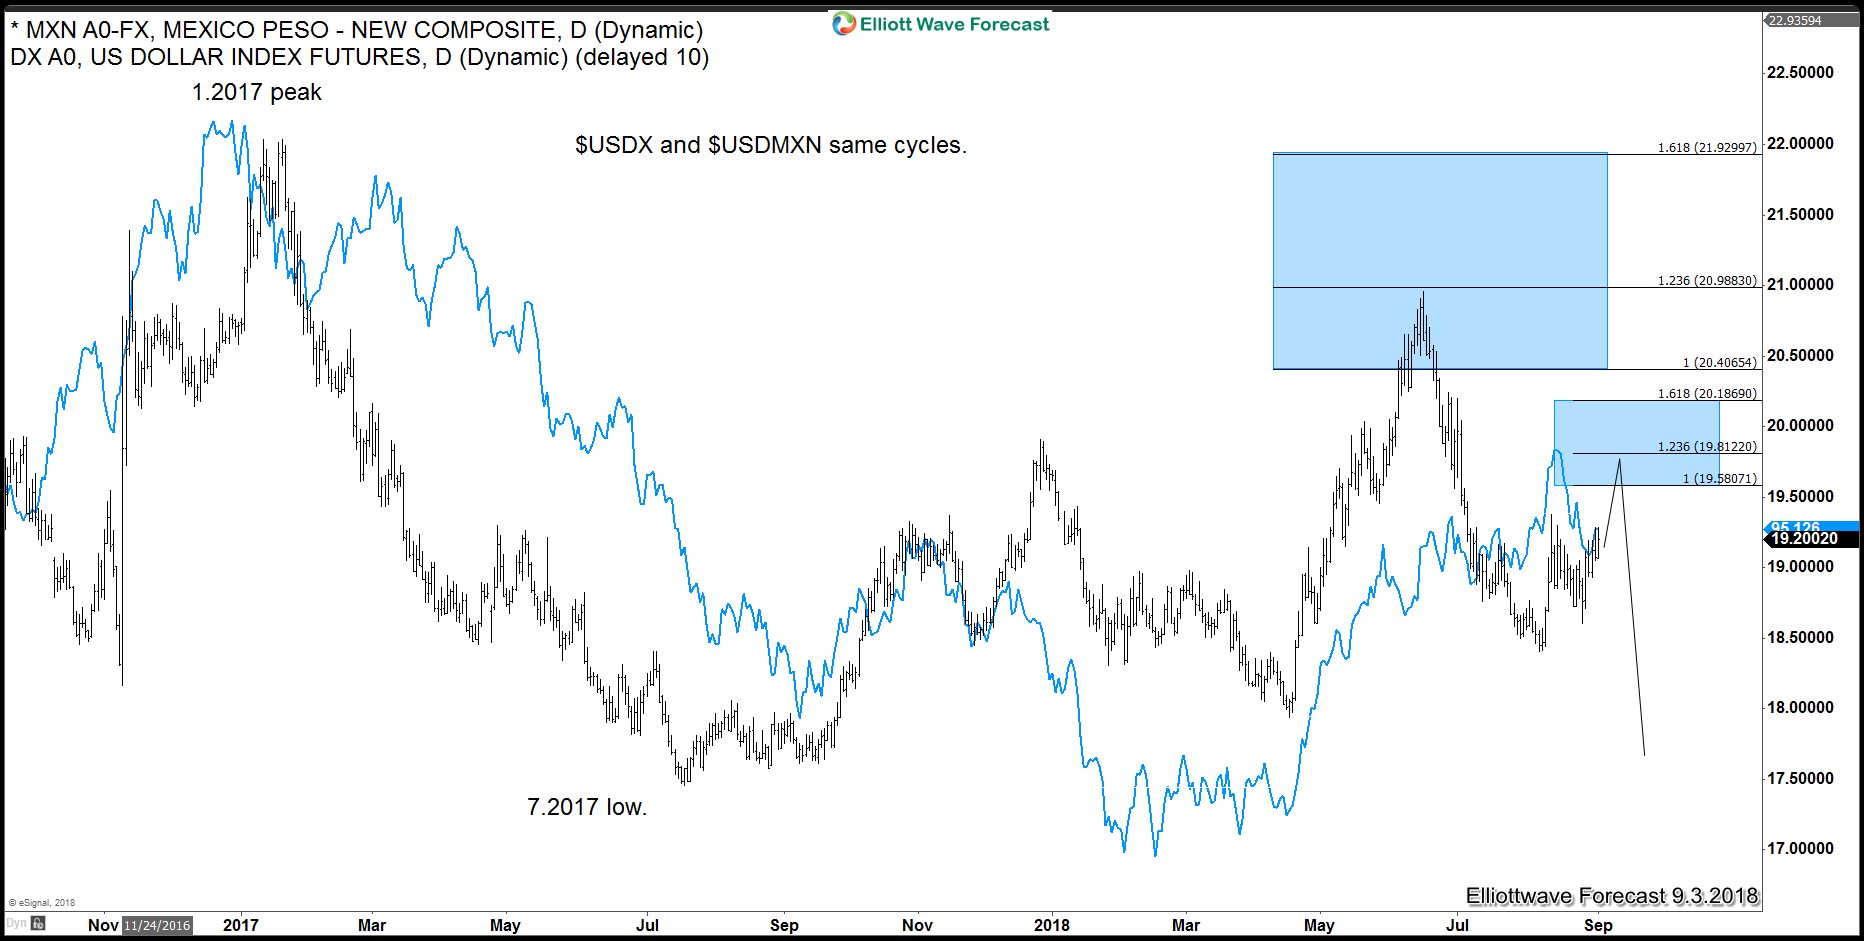
USDMXN Elliott Wave Analysis: Showing The Classic 5 Waves Pattern
Read MoreThe Elliott Wave Theory, as many traders know, was developed in the 1930′ and the main pattern is the 5 waves structure followed by 3 waves pullback. The Theory was developed based on The Dow Jones Index. Nowadays the Theory is used by traders to forecast any type of instruments like Stocks, Indices, Commodities, and Forex. In […]
-
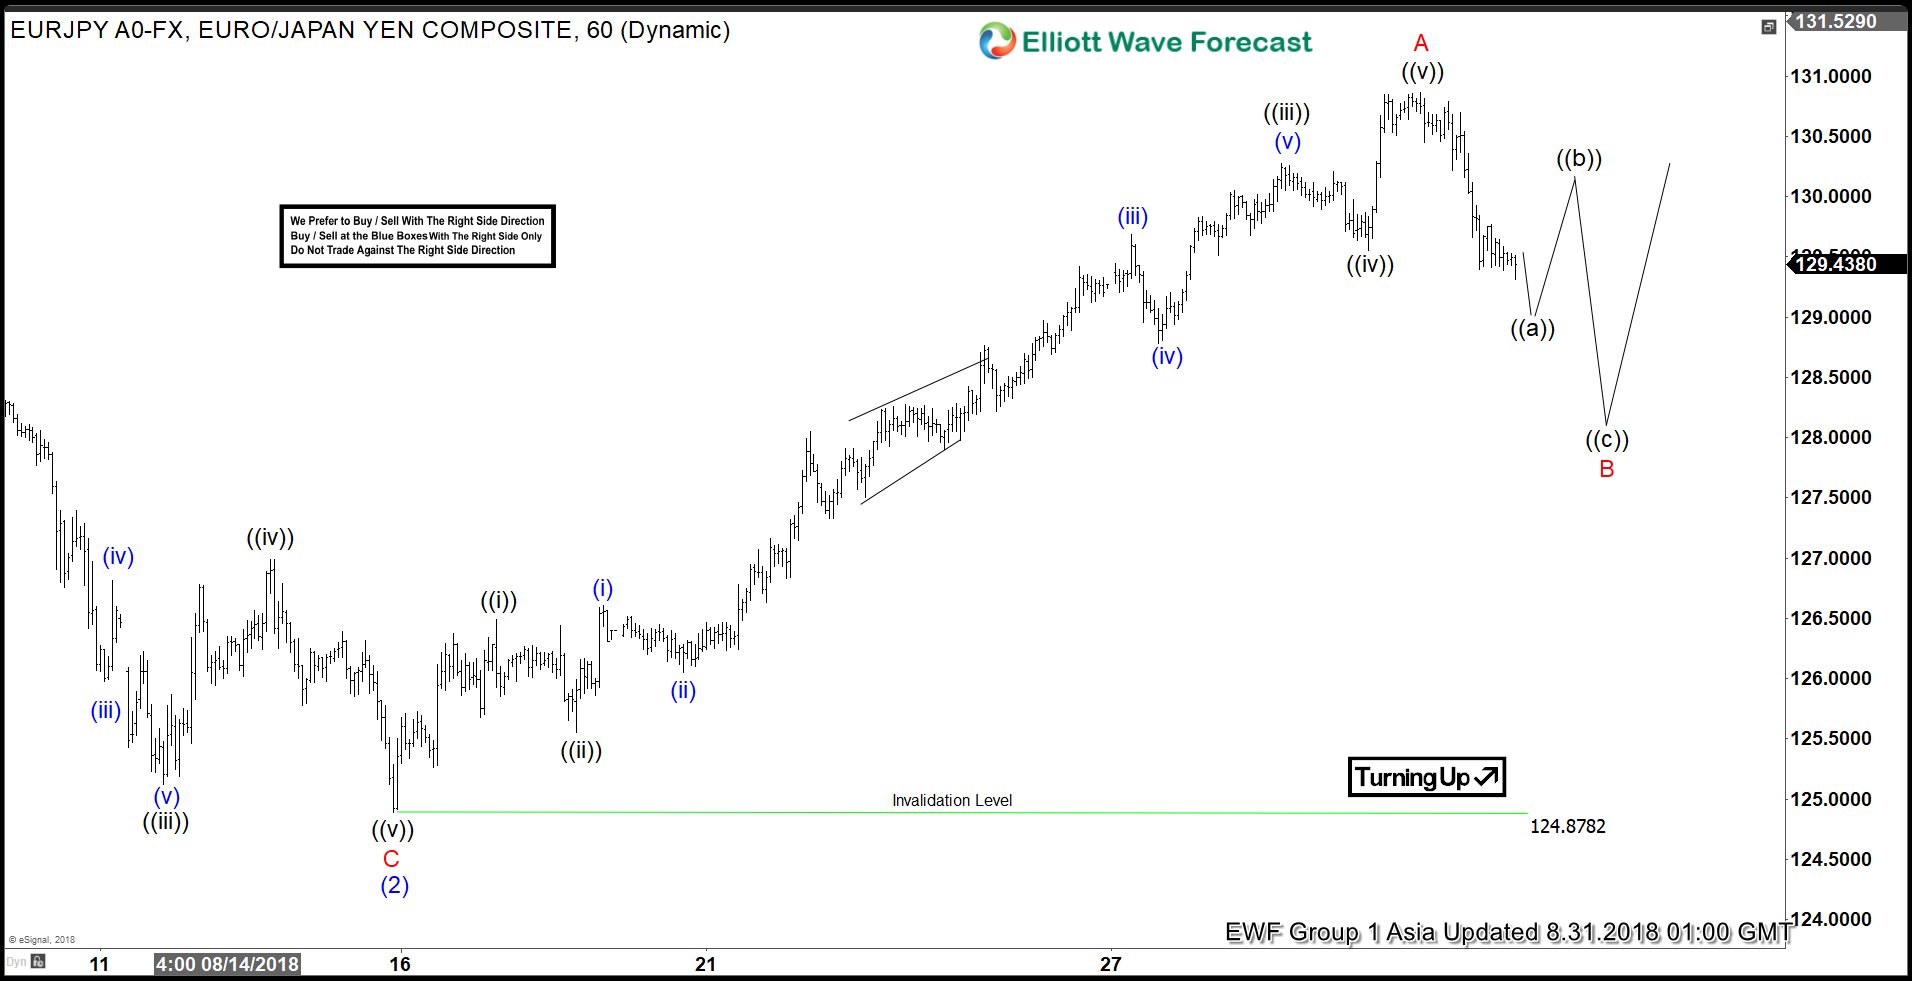
EURJPY Elliott Wave View: Ended 5 Waves Advance
Read MoreEURJPY short-term Elliott wave view suggests that the decline to 124.87 low ended intermediate wave (2) pullback of a leading diagonal structure from 5/29/2018 cycle. Above from there, the rally higher is taking place as Elliott wave zigzag structure within intermediate wave (3) of a diagonal. In a zigzag ABC structure, lesser degree cycles should […]
-
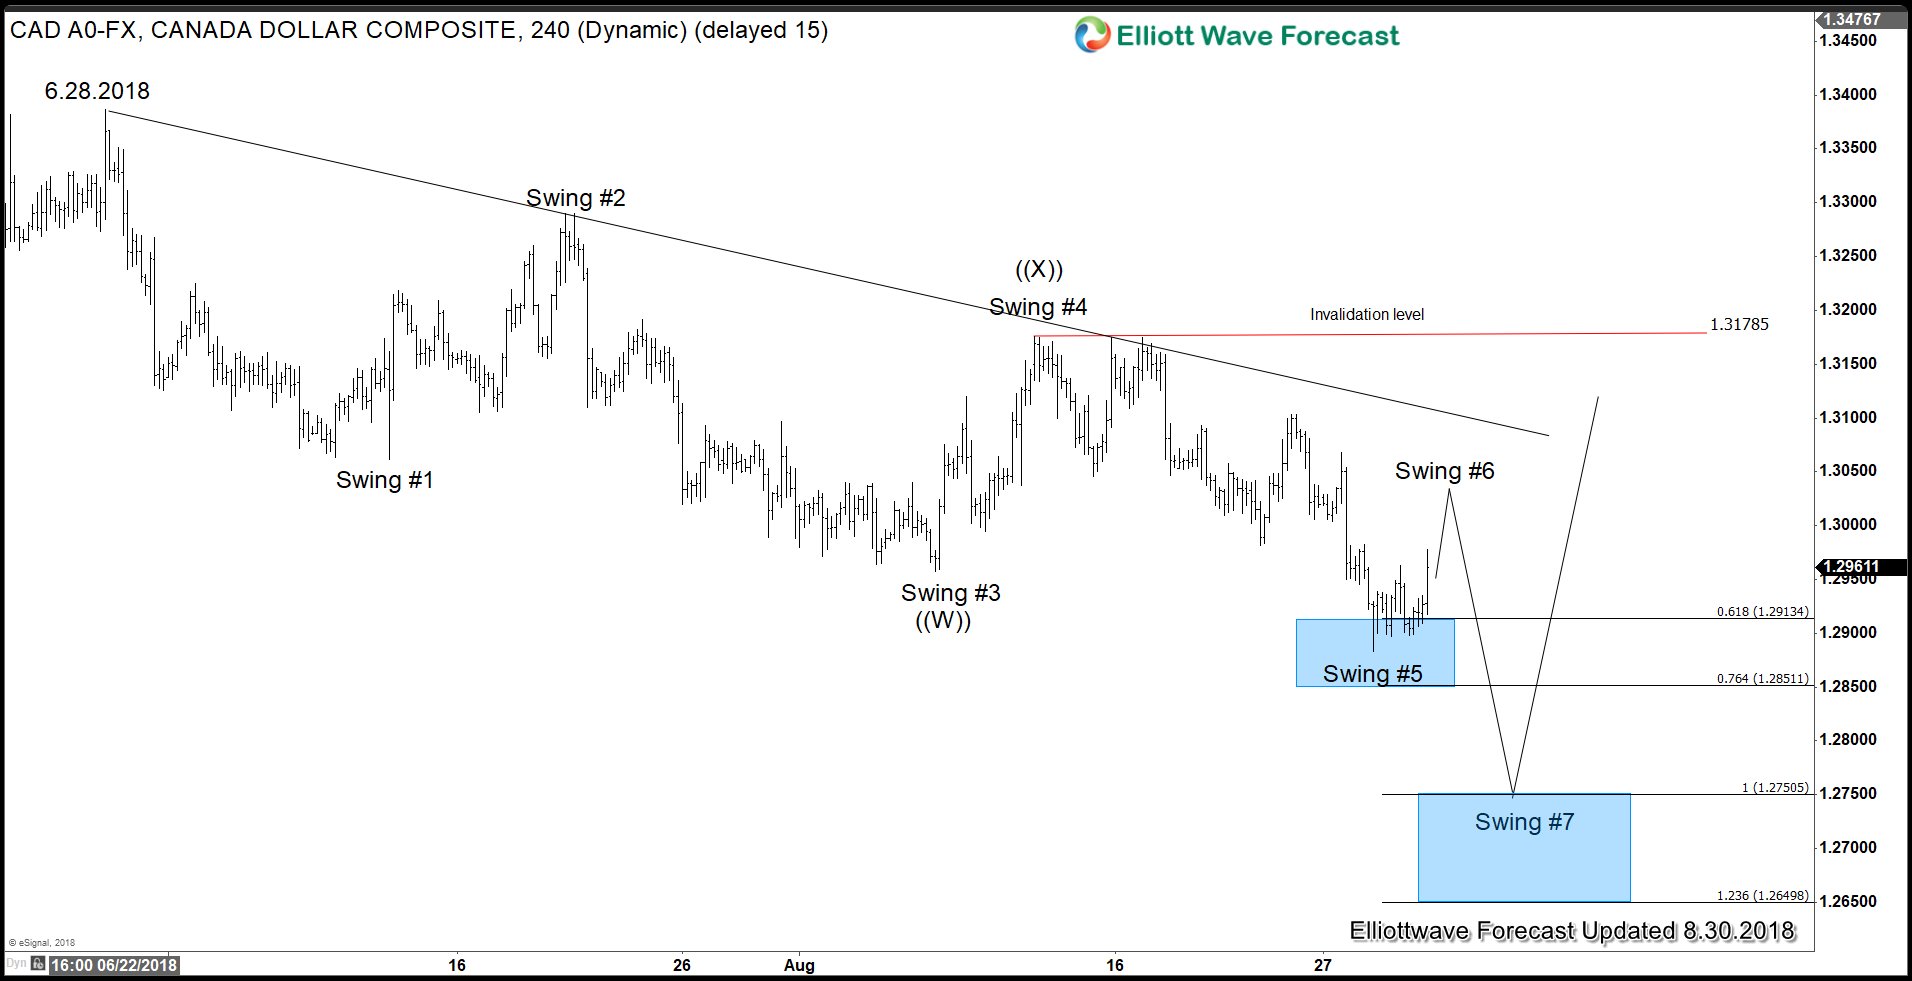
Market Participants Betting on Nafta Deal between US and Canada
Read MoreThe Canadian Dollar strengthened to a two month high against US Dollar earlier this week. Market participants seem to bet on possible inclusion of Canada in a new Nafta pact. The U.S. has just concluded a successful bilateral talk with Mexico on Monday. Under the new agreement, cars need to have 75% of their content […]
-
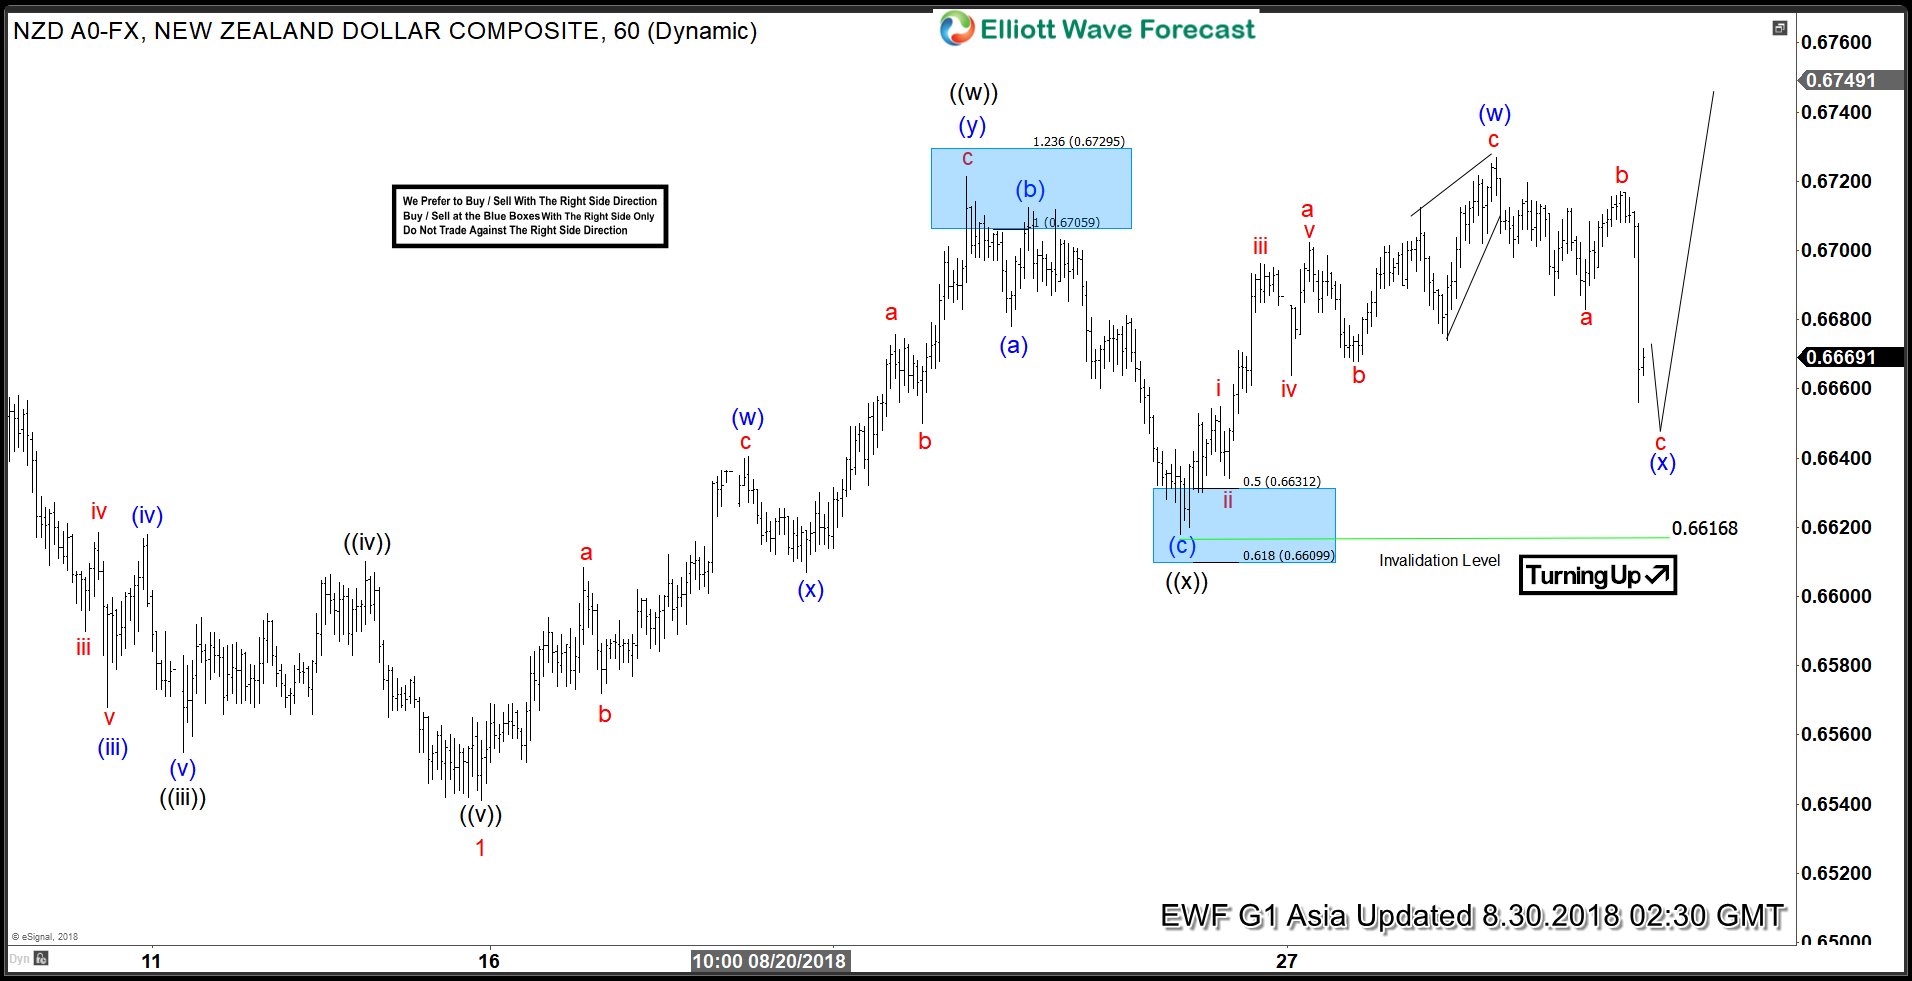
NZDUSD Elliott Wave Analysis: Double Correction Taking Place
Read MoreNZDUSD short-term elliott wave analysis suggests that the decline to 0.6543 low ended Minor wave 1. The internals of that decline unfolded as impulse structure with lesser degree Minute wave ((i)), ((iii)) & ((v)) unfolded in 5 waves structure. Above from there, Minor wave 2 bounce is taking place as double correction higher with lesser […]
-
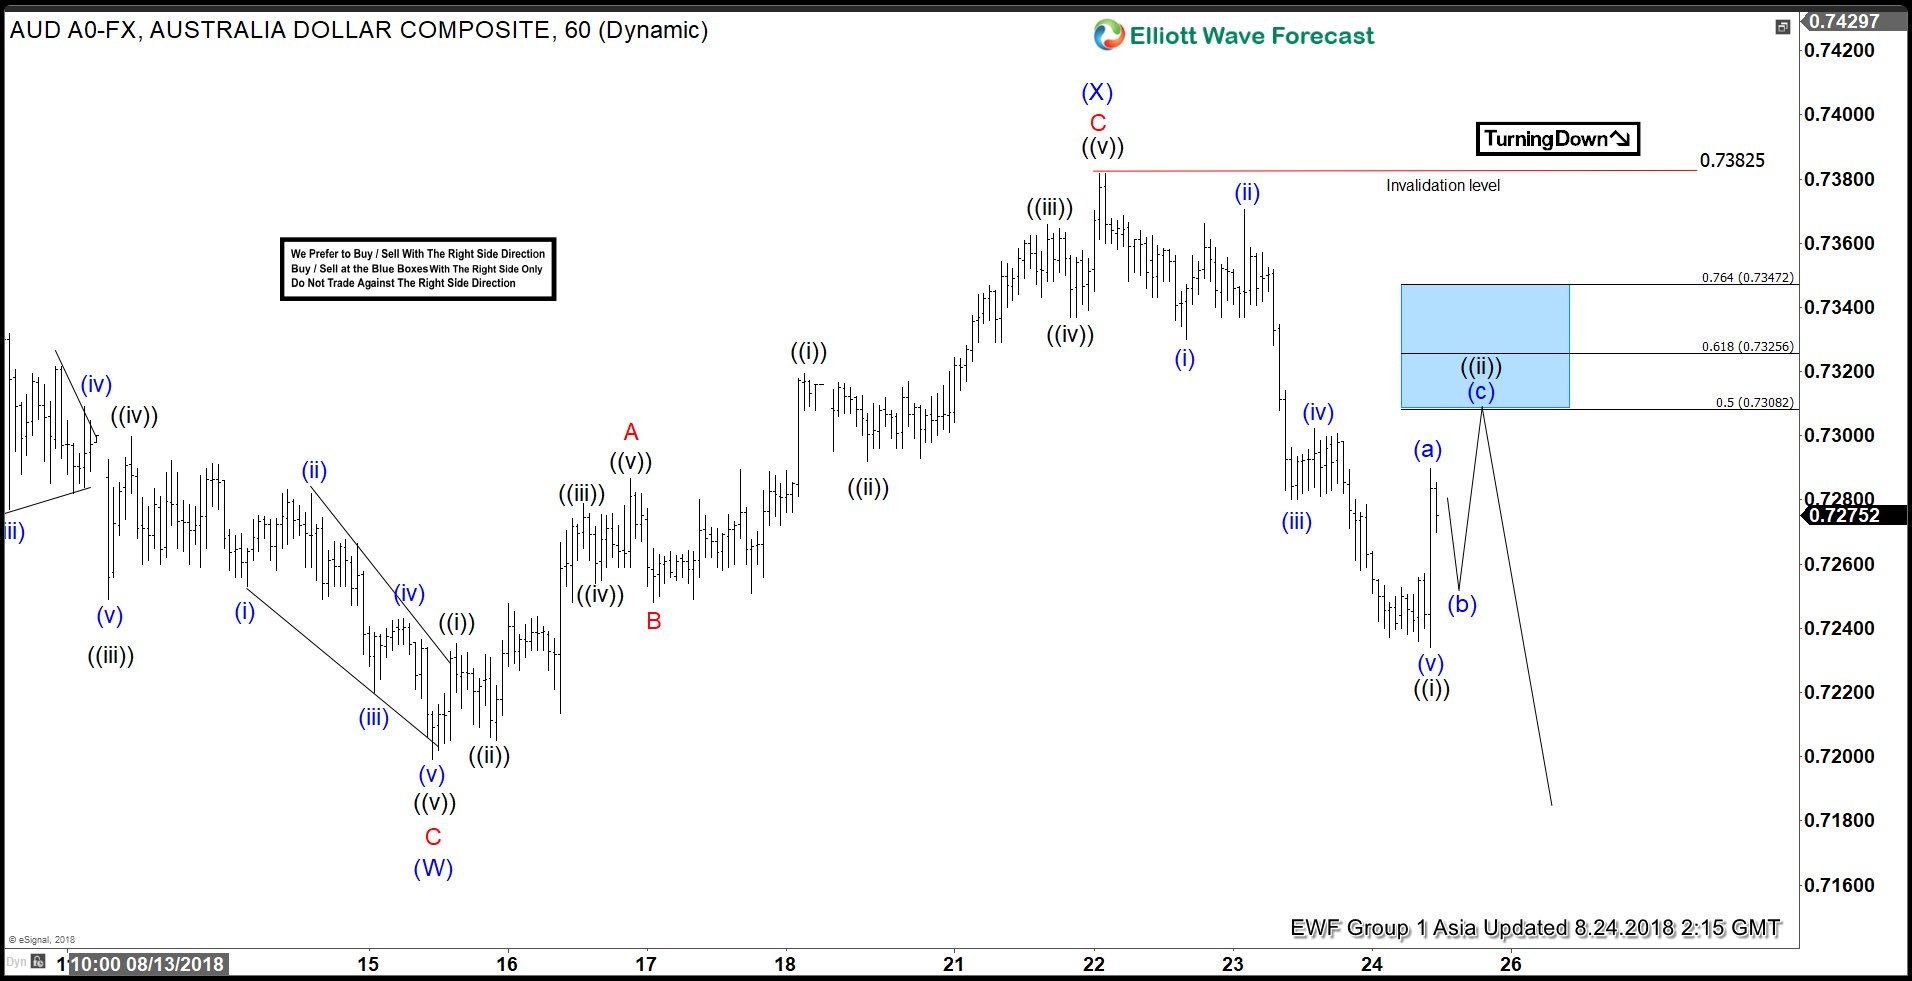
AUDUSD Elliott Wave View: Downside Pressure Remains
Read MoreElliott Wave view on AUDUSD suggests that the decline to 0.7199 ended Intermediate wave (W). Intermediate wave (X) rally appears complete at 0.7382. The internal of Intermediate wave (X) unfolded as a zigzag Elliott Wave structure. Minor wave A of (X) ended at 0.7287, Minor wave B of (X) ended at 0.7248. and Minor wave […]
-
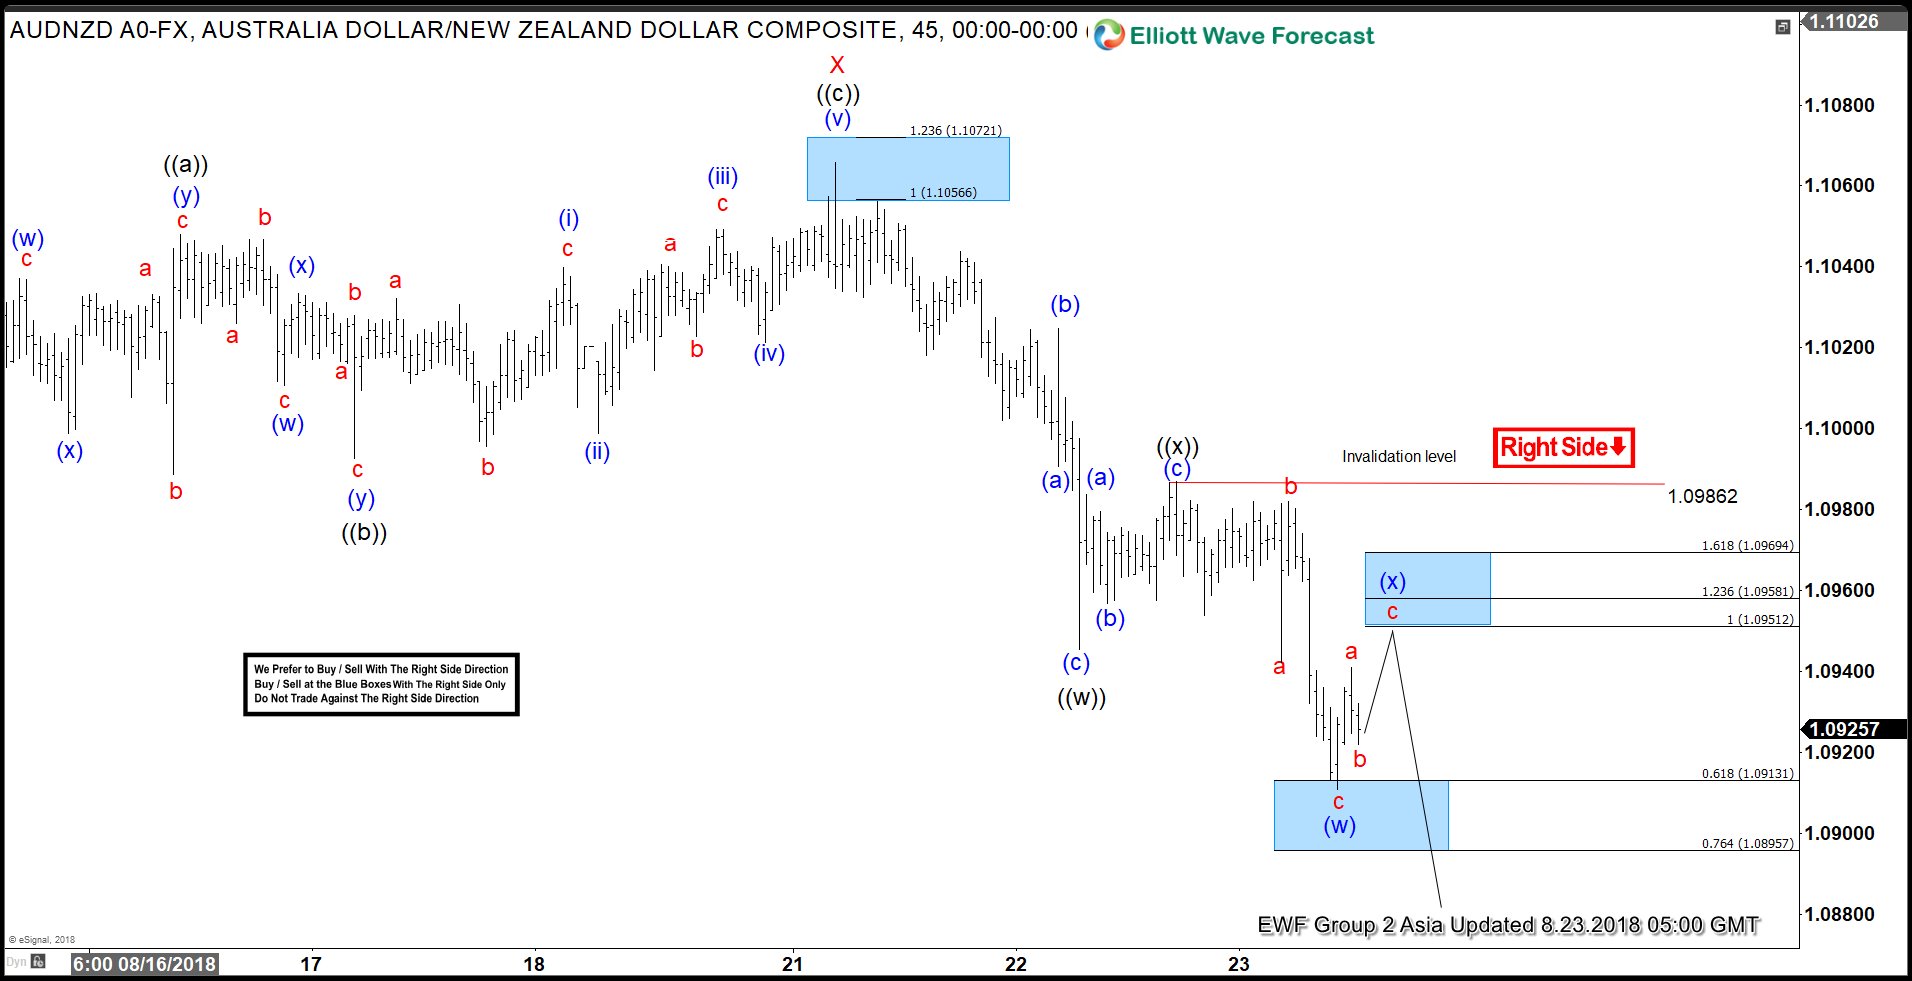
AUDNZD Elliott Wave View: Further Downside Expected
Read MoreAUDNZD Short-term Elliott Wave view suggests that the rally to 1.1066 ended Minor wave X. The internal subdivision of Minor wave X is unfolding as a zigzag Elliott Wave structure where Minute wave ((a)) ended at 1.1048, Minute wave ((b)) ended at 1.0992, and Minute wave ((c)) of X ended at 1.1066. A zigzag is […]