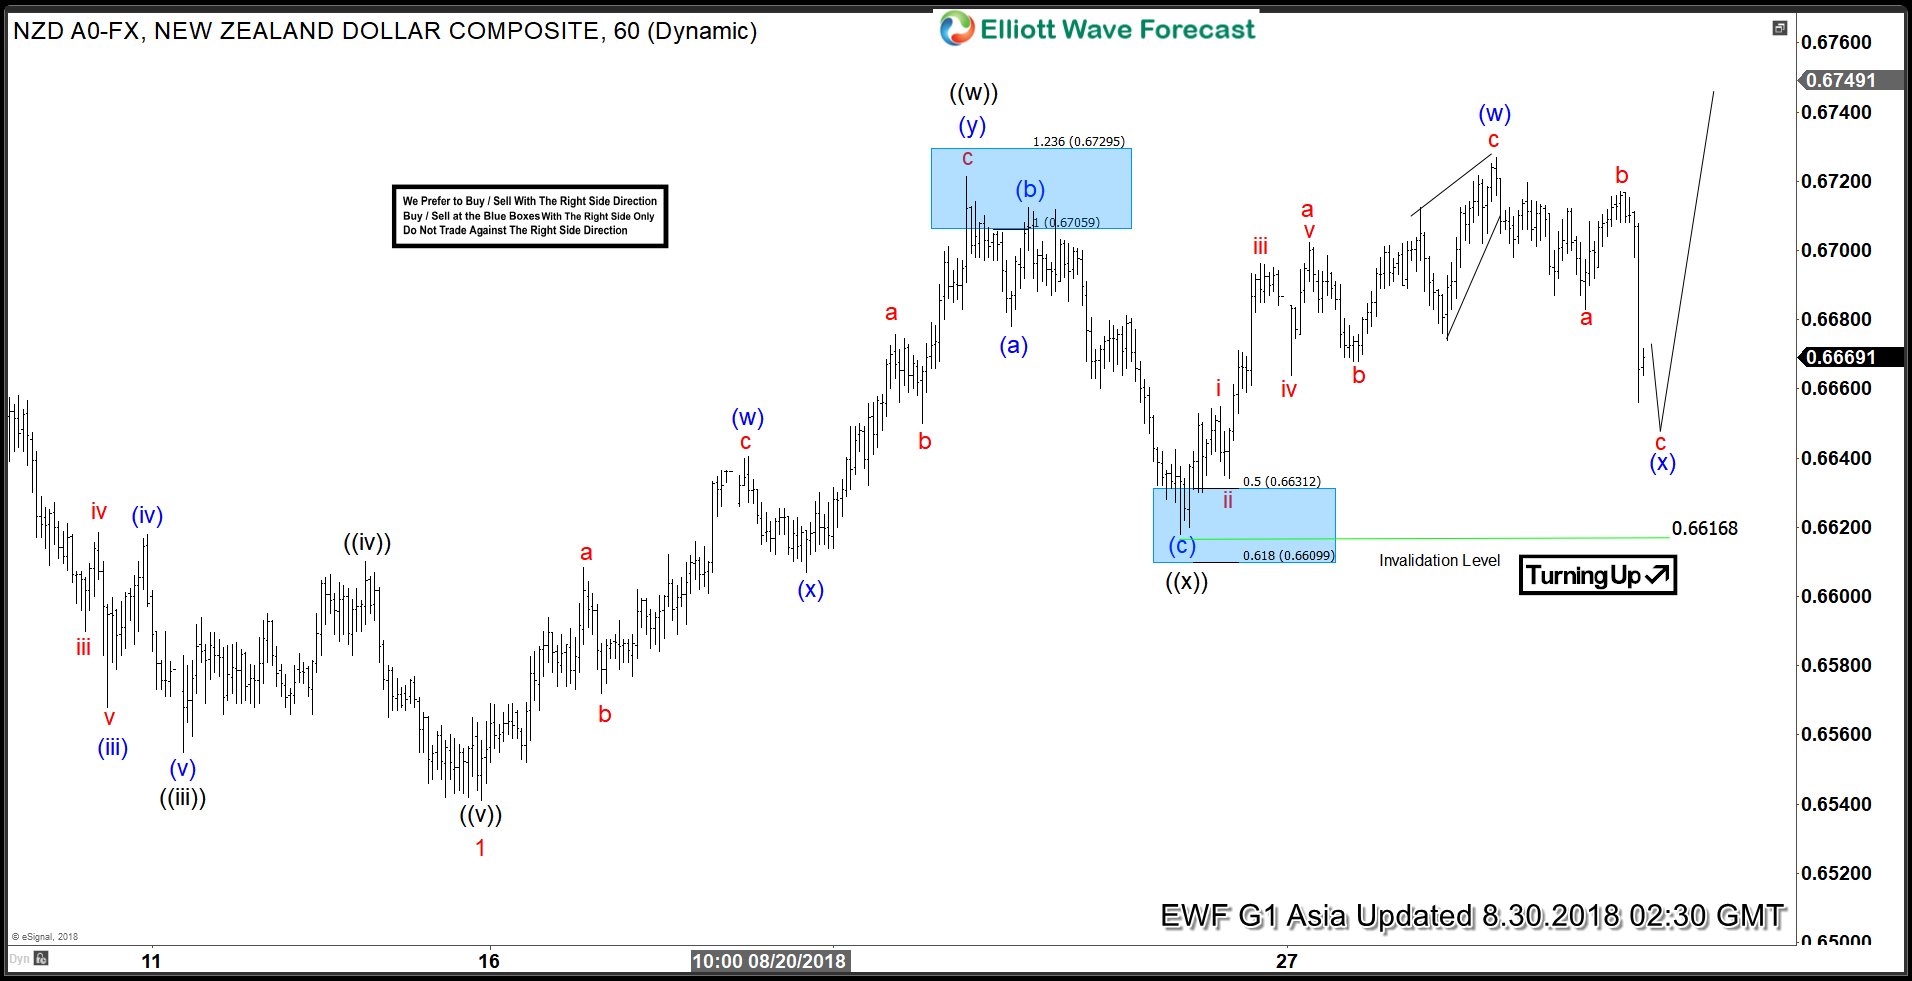
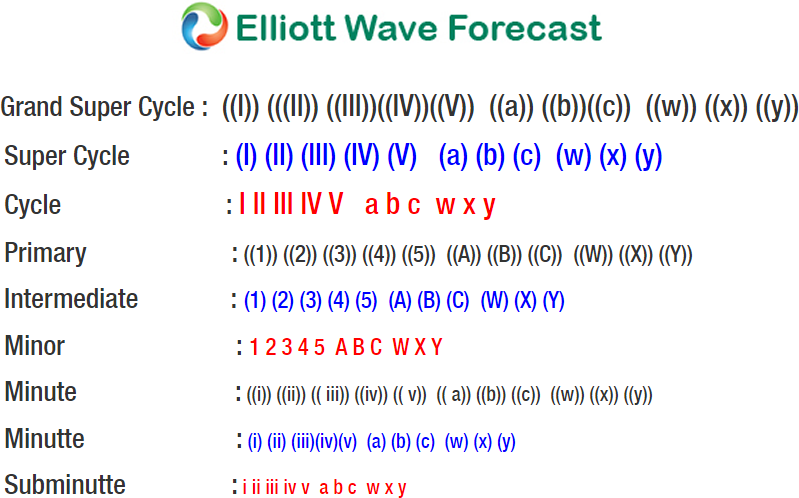
NZDUSD short-term elliott wave analysis suggests that the decline to 0.6543 low ended Minor wave 1. The internals of that decline unfolded as impulse structure with lesser degree Minute wave ((i)), ((iii)) & ((v)) unfolded in 5 waves structure. Above from there, Minor wave 2 bounce is taking place as double correction higher with lesser degree cycles showing sub-division of 3 wave structure its each leg higher.
Up from 0.6543 low, the rally to 0.6719 high ended Minute wave ((w)) of 2. The internals of that rally also unfolded as double three structure where Minutte degree wave (w) ended at 0.6639. Minutte wave (x) pullback ended at 0.6609 & Minutte (y) of ((w)) ended at 0.6719 high. From there, the pullback to 0.6616 low ended Minute wave ((x)) of 2 as a Flat structure. Near-term, as far as dips remain above there, expect pair to resume the next leg higher in Minute wave ((y)) of 2 looking for 0.6795-0.6835, which is the 100%-123.6% Fibonacci extension area of Minute wave ((w))-((x)) to end Minor wave 2 bounce. We don’t like buying the pair.
NZDUSD 1 Hour Elliott Wave Chart
We provide precise forecasts with up-to-date analysis for 78 instruments. These include Forex, Commodities, World Indices, Stocks, ETFs and Bitcoin. Our clients also have immediate access to Market Overview, Sequences Report, 1 Hour, 4 Hour, Daily & Weekly Wave Counts. In addition, we also provide Daily & Weekend Technical Videos, Live Screen Sharing Sessions, Live Trading Rooms and Chat room where clients get live updates and answers to their questions. The guidance of ElliottWave-Forecast gives subscribers the wherewithal to position themselves for proper entry and exit in the markets. We believe our disciplined methodology and Right side system is pivotal for long-term success in trading.
Back


