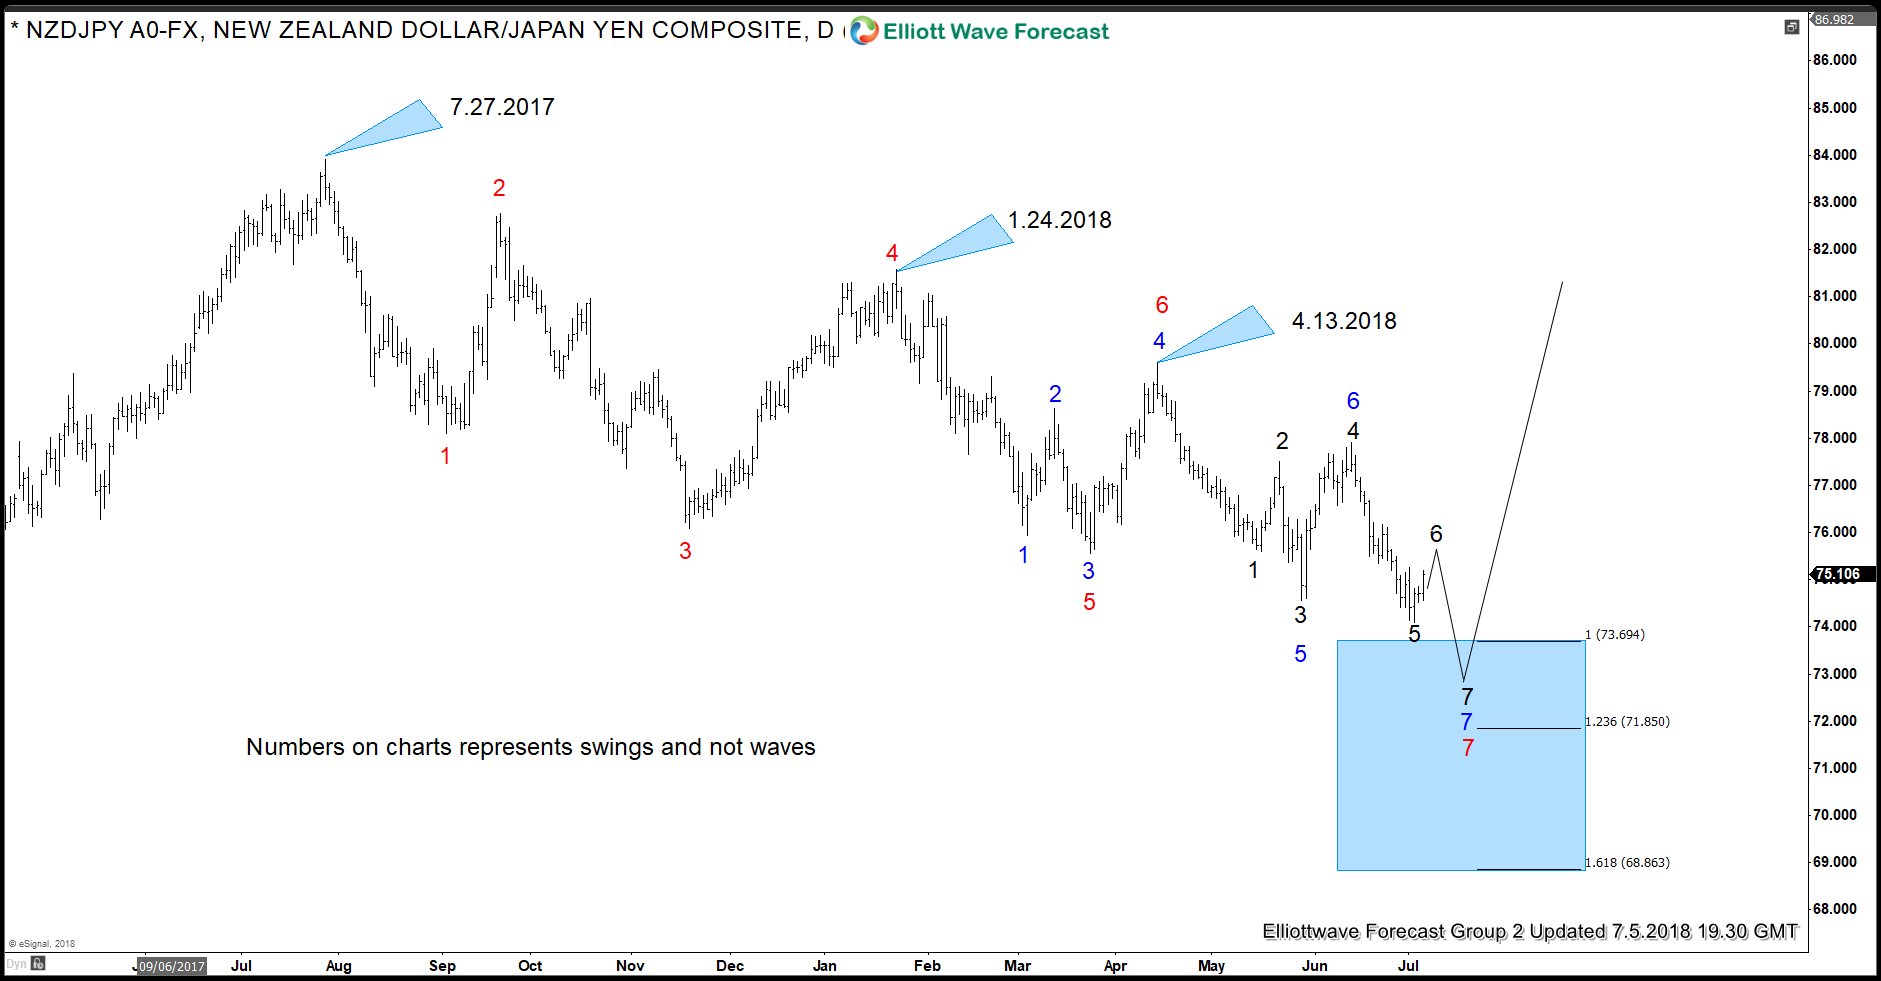
NZDJPY recently broke below 5/29/2018 (74.54) low due to which there are a lot of bearish forecasts around, some extremely bearish and some less bearish. In this blog, we will look at whether new lows have made NZDJPY turn extremely bearish or this decline is an NZDJPY buying opportunity. Back in May this year we mentioned that NZDJPY decline was not over and that pair should see more downside. Pair has now made new lows as expected and is about to complete what we call a 7-7-7 swings sequences. Let’s take a look at the chart below
NZDJPY 7-7-7 Swings Sequence
Chart below shows the swings sequences from 7.27.2017 peak, 1.24.2018 peak and 4.13.2018 peaks. Down from 7.27.2017, pair is already showing complete 7 swings down (marked in red) and it is already showing 7 swings down from 1.24.2018 peak also (marked in blue) but down from 4.13.2018 peak, pair is only showing 5 swings down (marked in black) which means while below the high of black 4, expect the pair to make another swing lower to complete 7 swings in black and that should complete a 7-7-7 swings sequence down from 7.27.2017 peak to end the cycle and then we should see a reaction higher in the pair.
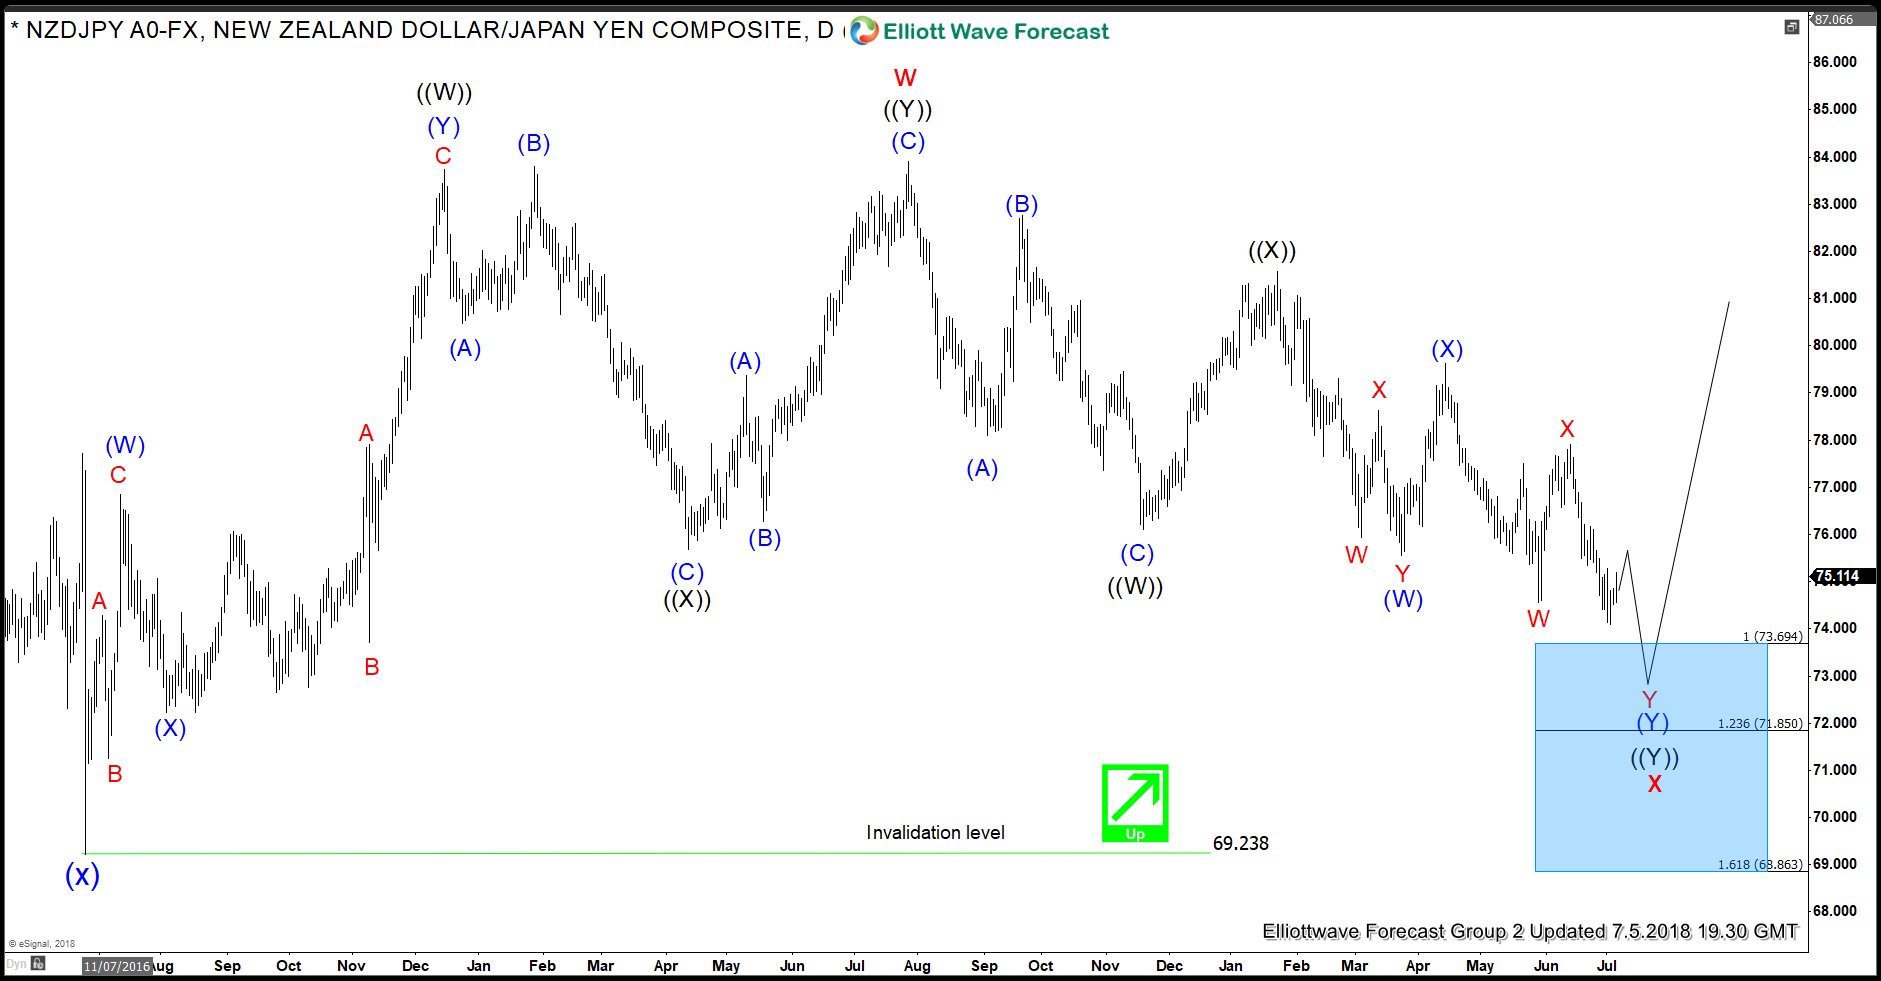
NZDJPY Buying Opportunity in Daily Time Frame
Chart below shows pair is still in a pull back to correct the cycle from 6.24.2016 (69.23) low and while below red X peak (77.90), we still expect the pair to make another push lower towards 73.694 – 71.85 and find buyers there because the next push lower would complete a 7-7-7 Elliott wave swings sequence as we mentioned above. Pair is very close to the target at 73.69 so it’s risky chasing the short side and we expect buyers to appear in 73.694 – 71.85 area if reached and then the rally should resume for new highs above 83.91 (7/27/2017) peak or a larger 3 waves bounce at least.
Back


