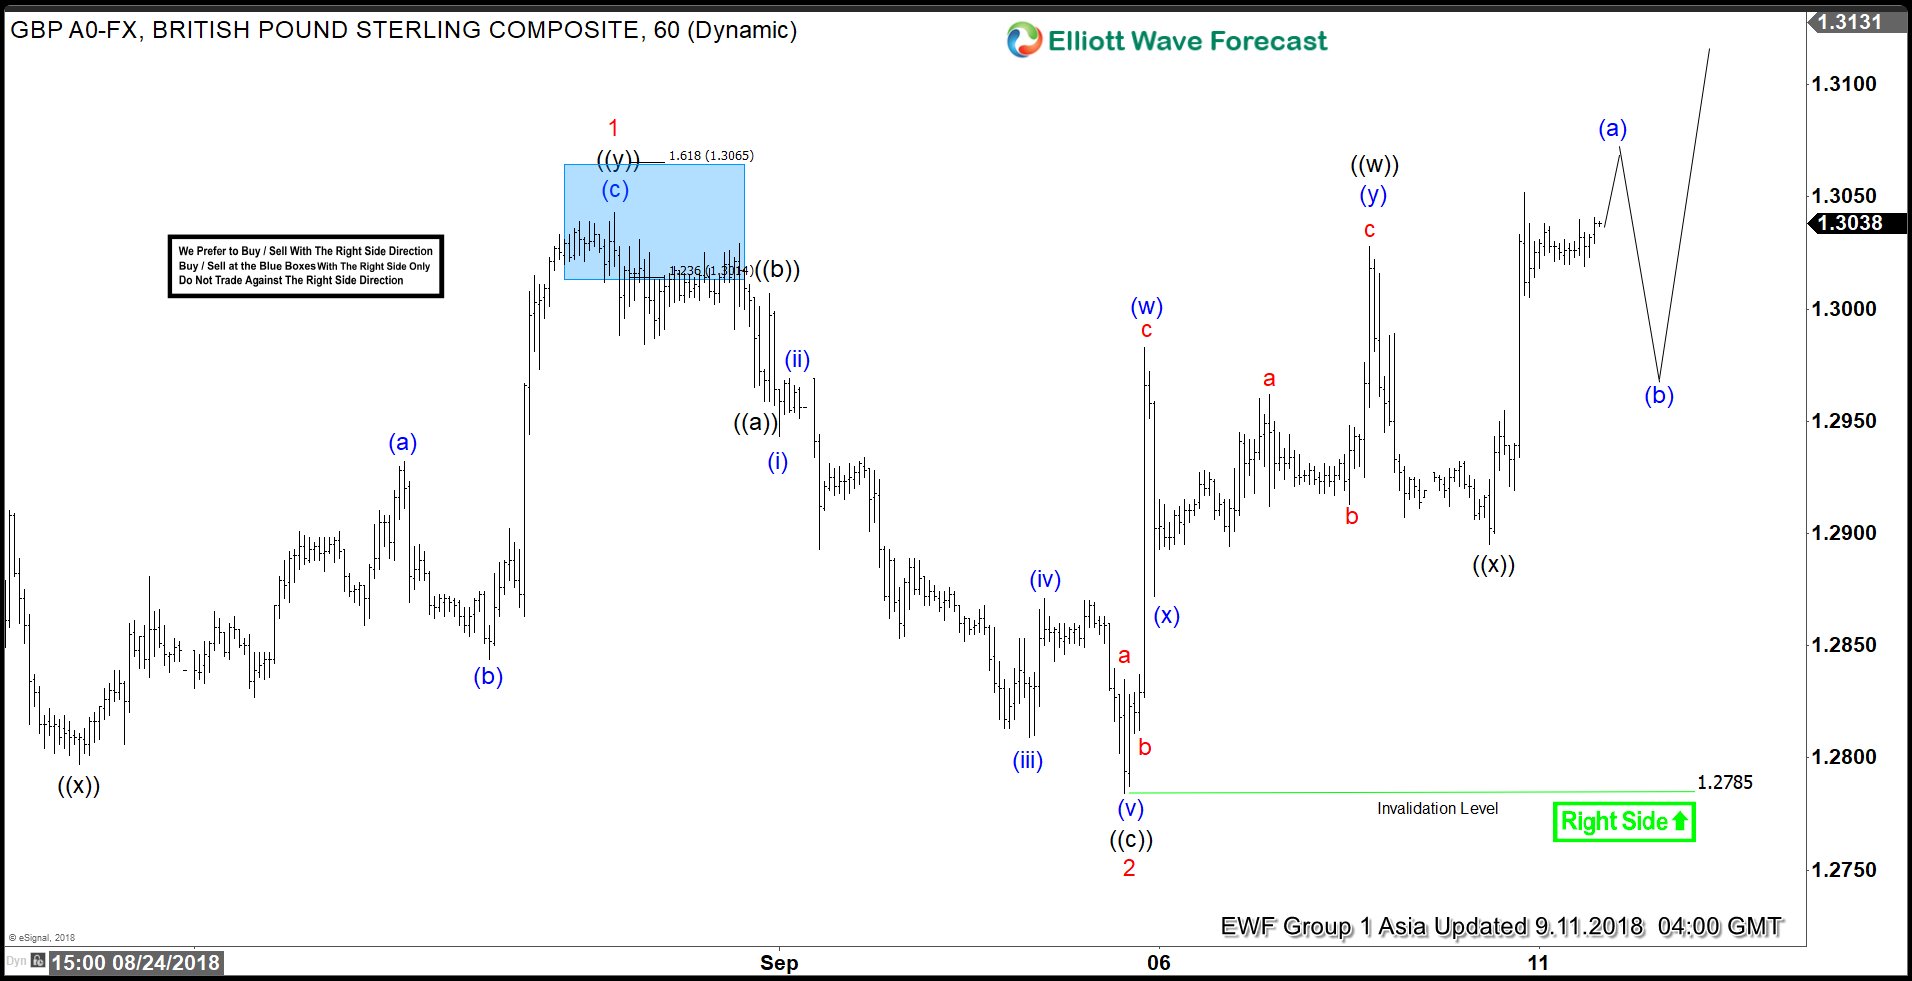
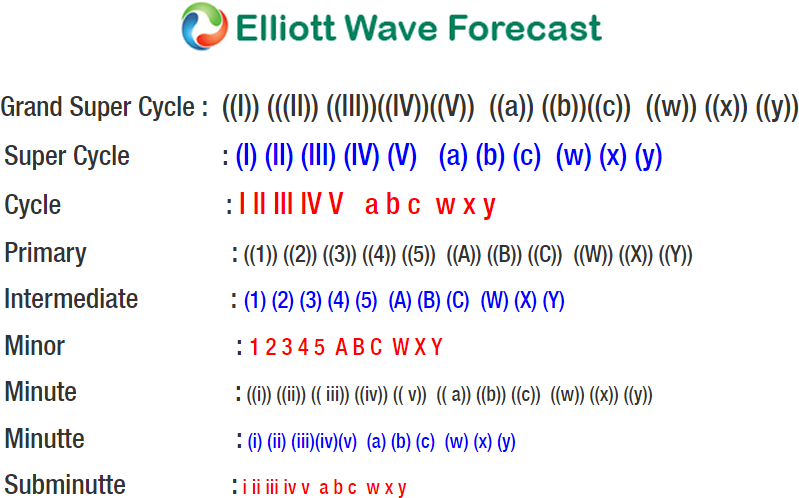
GBPUSD short-term Elliott Wave analysis suggests that the rally from 8/15/2018 low at 1.2660 to 1.3042 high ended Minor wave 1. The internals of that rally higher took place in 3 wave corrective sequence i.e double three thus suggesting that the pair can be doing a Leading diagonal structure. Up from 1.2660 low, the initial rally to 1.2935 high ended Minute wave ((w)) of 1. Minute wave ((x)) of 1 pullback ended at 1.2798 low. Minute wave ((y)) of 1 ended as a zigzag structure at 1.3042 high.
Down from there, the pullback to 1.2785 low ended Minor wave 2 pullback as a Flat structure where Minute wave ((a)) ended at 1.2959 low. Minute wave ((b)) bounce ended at 1.3006 high and Minute wave ((c)) of 2 ended at 1.2785 low. Above from there, the pair has managed to make a new high above 1.3042 peak confirming the next extension higher in Minor wave 3. Near-term, while dips remain above 1.2785 low, any dip is expected to remain supported in 3, 7 or 11 swings for further upside towards 1.3162-1.3252, which is the 100%-123.6% Fibonacci extension area of Minor wave 1-2 to complete Minor wave 3. Afterwards, the pair is expected to do a pullback in Minor wave 4 before further upside is seen. We don’t like selling the pair and prefer more upside against 1.2785 low in the first degree.


