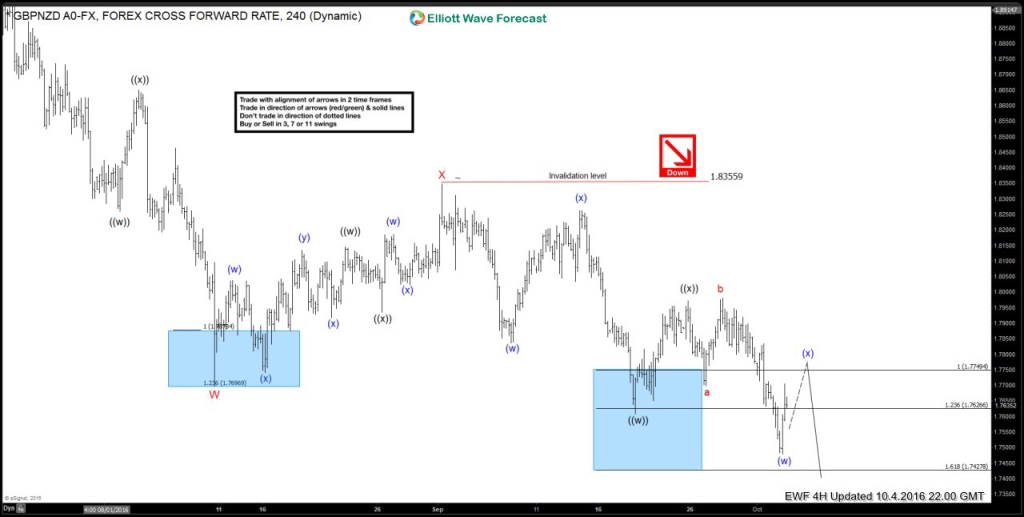
In this technical blog we are going to take a quick look at $GBPNZD 4 hour chart from October 4th 2016. Pair from July 21 2016 peak was following a lager Elliott wave bearish cycle for ideal downside target area at 1.70, Also from September 1st 2016 peak (1.83559) pair was forming a lower lows and lower highs and was showing 5 swings down from 1.83559 peak. 5 is part of an impulsive sequence where as corrective sequence runs in 3, 7 or 11 swings. As the decline from 1.83559 was overlapping and hence not impulsive, it suggested the sequence was incomplete and called for bounces to fail below black ((x)) peak for another swing lower to complete seven swing sequence.
GBPNZD October 4, 2016 4 Hour chart
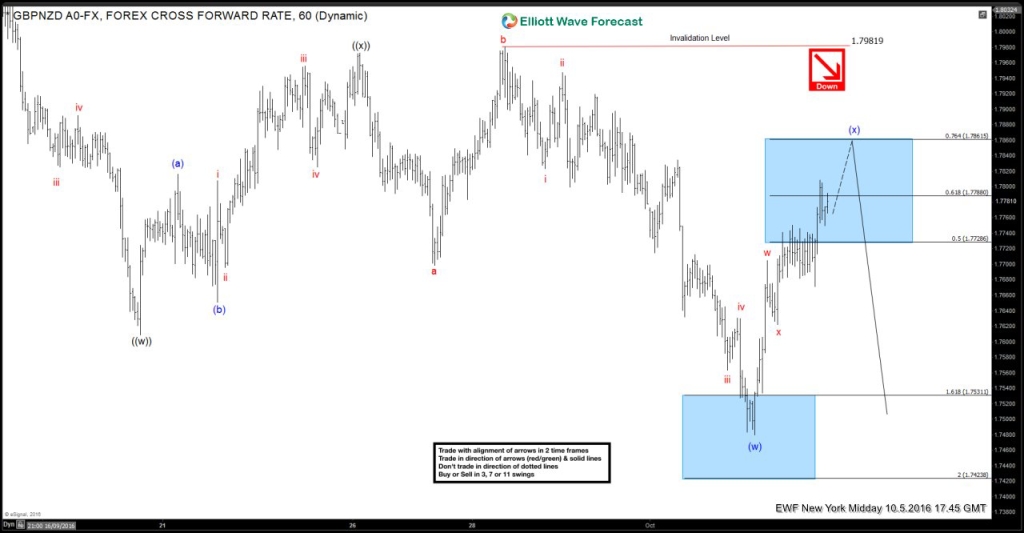
$GBPNZD October 5, 1 Hour Midday Chart: Preferred Elliott wave count was expecting wave (x) bounce to fail between 50-76.4% Fibonacci retracement area (1.7728-1.7861) (potential sell zone) for continuation lower. Pair had to hold below 1.7981 (invalidation level) for the view to remain valid.
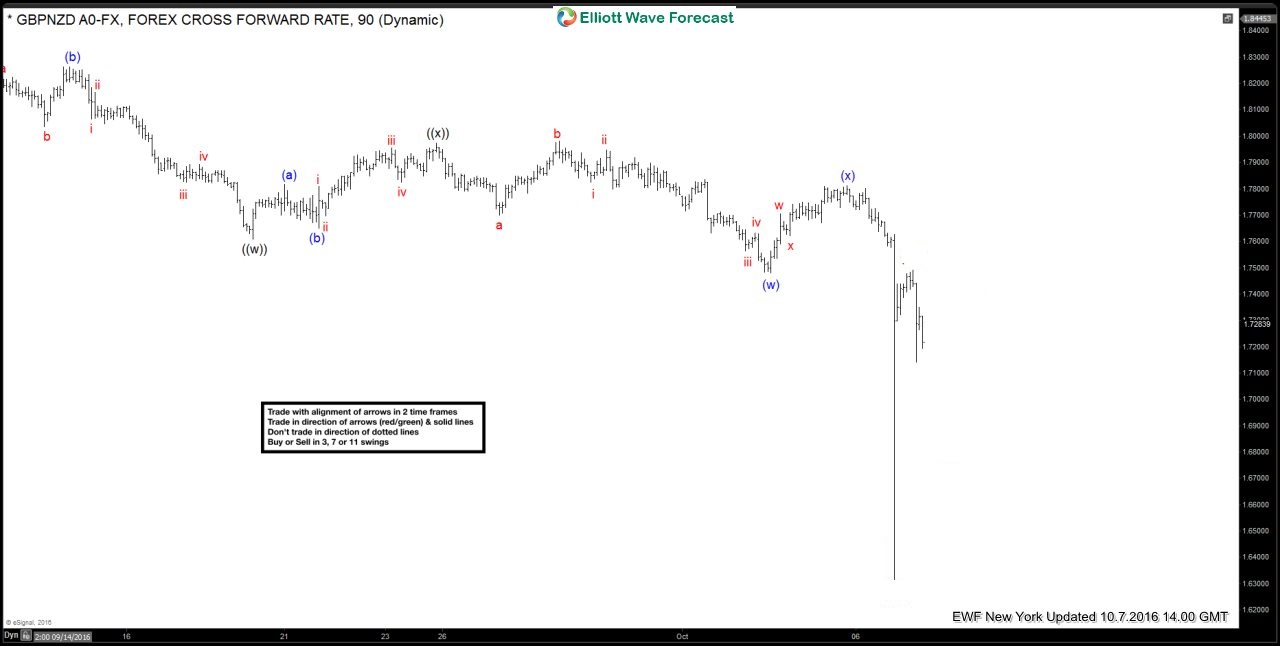
$GBPNZD October 7th 2016 1 hour New York Chart: shows the aftermath of the move, the market formed the peak in (x) bounce at (1.7810) peak & gave us the reaction lower as expected to allow our member’s to create a risk free position with initial downside target between 1.7003 – 1.6682 which was the 100 – 123.6 Fibonacci extension area of black ((w))-((x)) cycles.
Proper Elliott Wave counting is crucial in order to be a successful trader. If you want to learn more on how to implement Elliott Wave Theory in your trading and to learn more about next trading opportunities in the Market, Try free 14 day trial. You will get access to Professional Elliott Wave analysis in 4 different time frames, Daily Elliott Wave Setup Videos ,Live Trading Room and 2 live Analysis Session done by our Expert Analysts every day, 24 hour chat room support, market overview, weekly technical videos and much more. If you are not member yet, use this opportunity and Sign up for free Trial !
Back


