AUDJPY is an important currency pair at a global level because this reacts in favor of risk appetite; that is, removing the movements of the Australian dollar and the Japanese yen, the uptrend of the AUDJPY favors the upward movement in the most important indices of the capital market.
Finding the Blue Box in AUDJPY
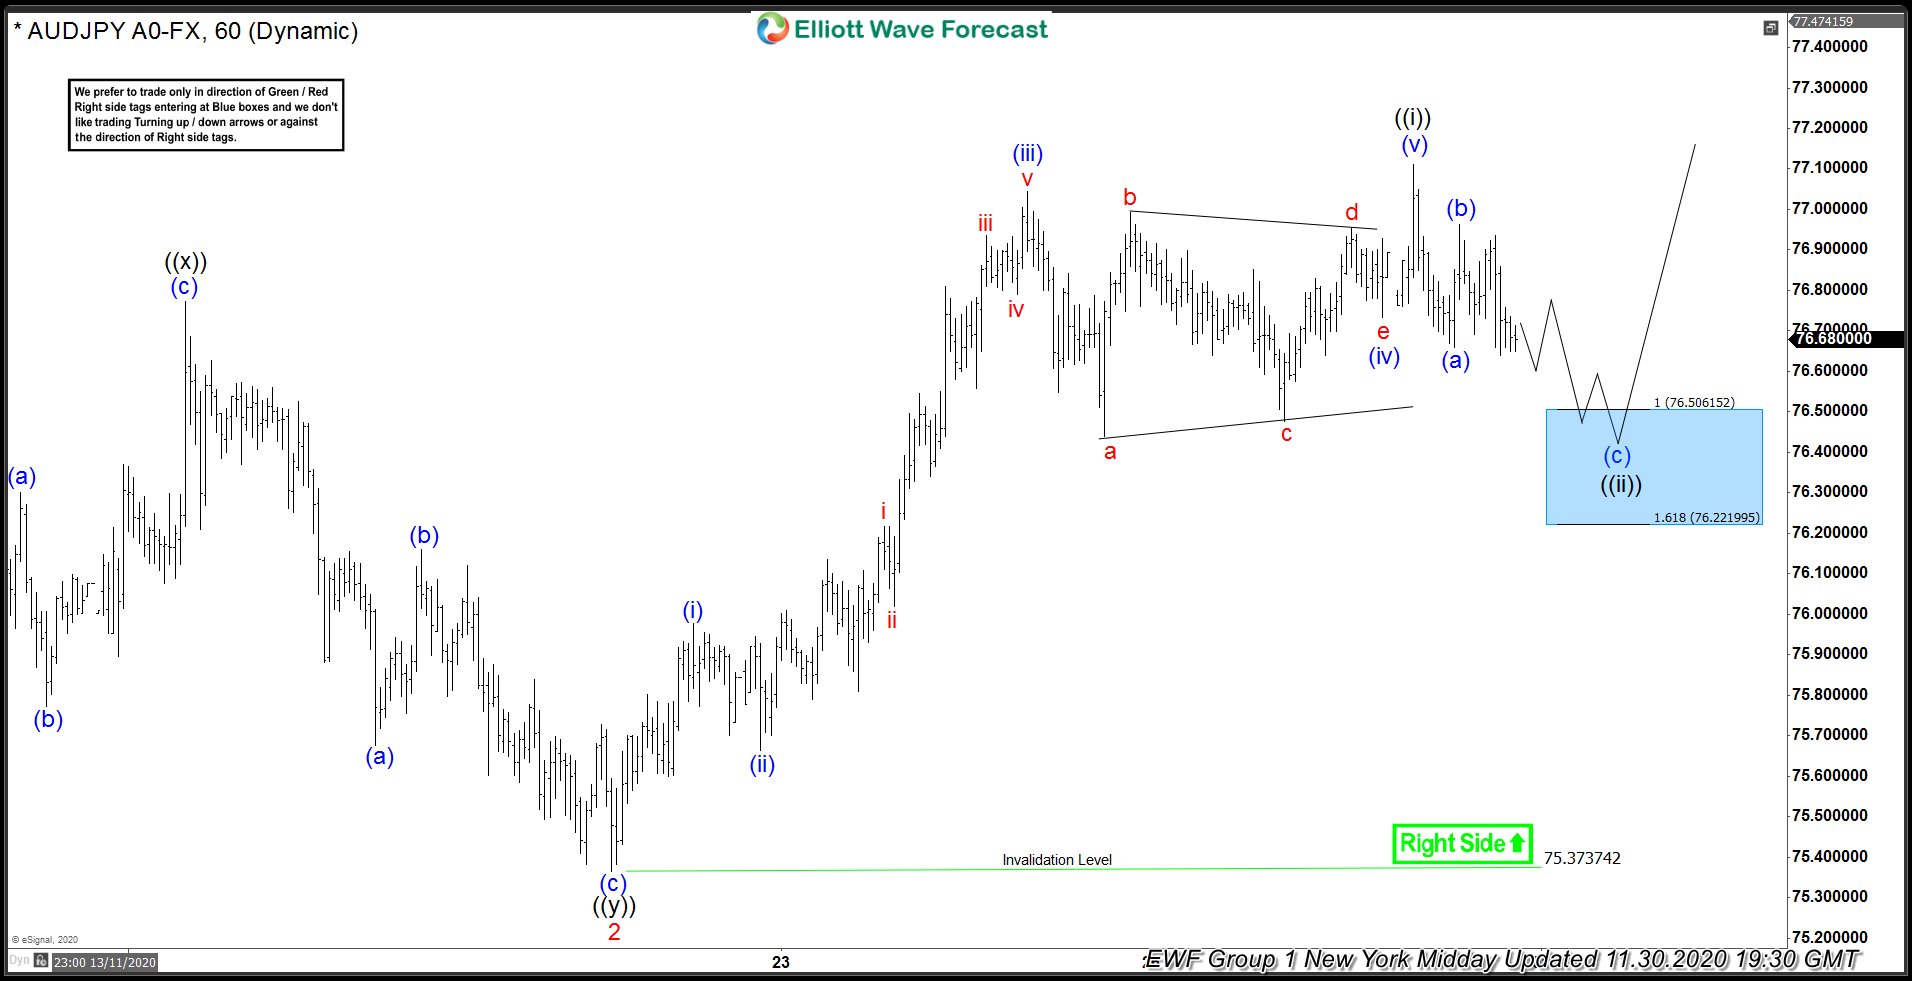
In the following chart, we can see that we completed a corrective structure (a) (b) (c) at the price of 75.37. Then we have 5 bullish waves where wave (iv) is drawn as a triangle and the impulse ends around the 77.10 level. As the Elliott Wave Theory says, after an impulse we could expect a correction of 3, 7, 11 swings before continuing in the same direction. (If you want to learn a more about Elliott Wave Theory please click this link: Elliott Wave Theory). Therefore, we look for another 3 waves correction (a) (b) (c) before continuing with the rally. With waves (a) (b) labeled on the chart we use the Fibonacci extension to identify the area of the blue box in AUDJPY which came between the prices of 76.22 and 76.50.
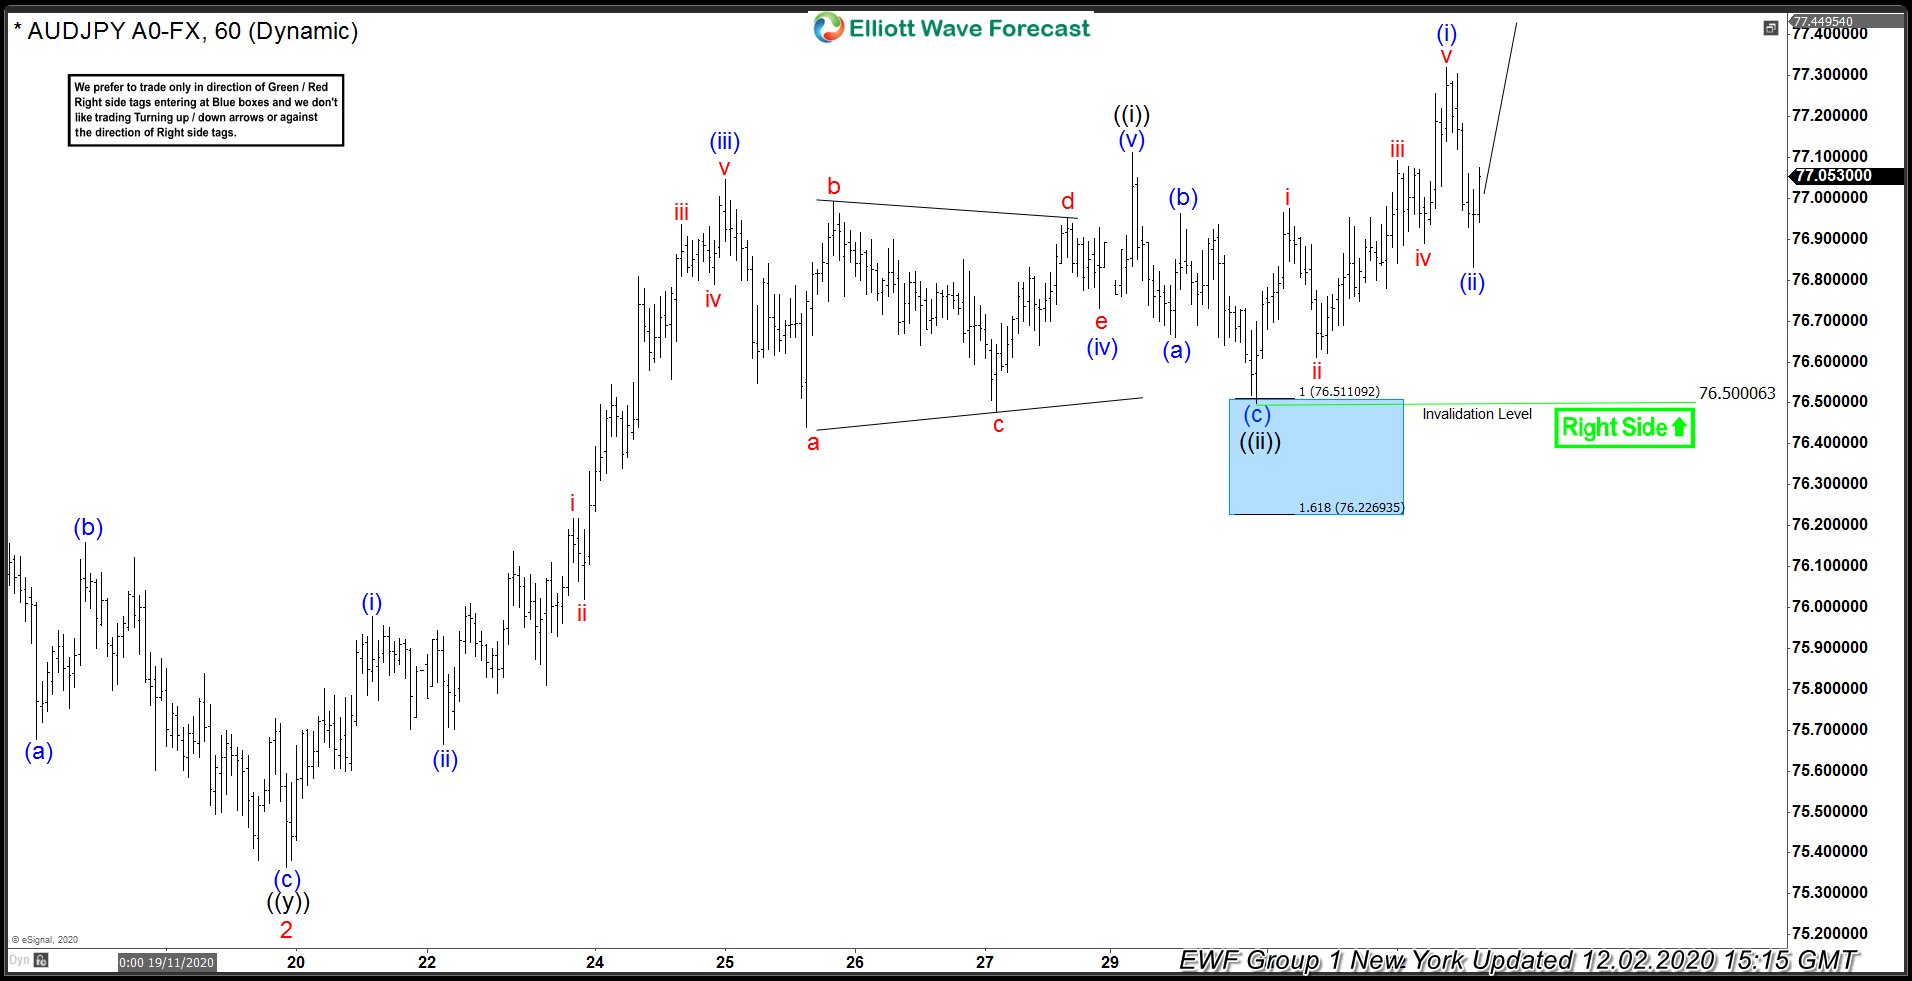
After a couple of hours we appreciate that the pair slightly reached 76.50, bounced from the blue box and broke the 77.10 level continuing with the rally. Currently the pair is at the price 78.61 at the time of writing this article.
In Elliottwave Forecast we update the one-hour charts 4 times a day and the 4-hour charts once a day for all our 78 instruments and the blue boxes and right-side mark. We do a daily live session where we guide our clients on the right side of the market. In addition, we have a chat room where our moderators will help you with any questions you have about what is happening in the market now. Let’s trial for 14 days totally free here: I want a free trial.
Back


