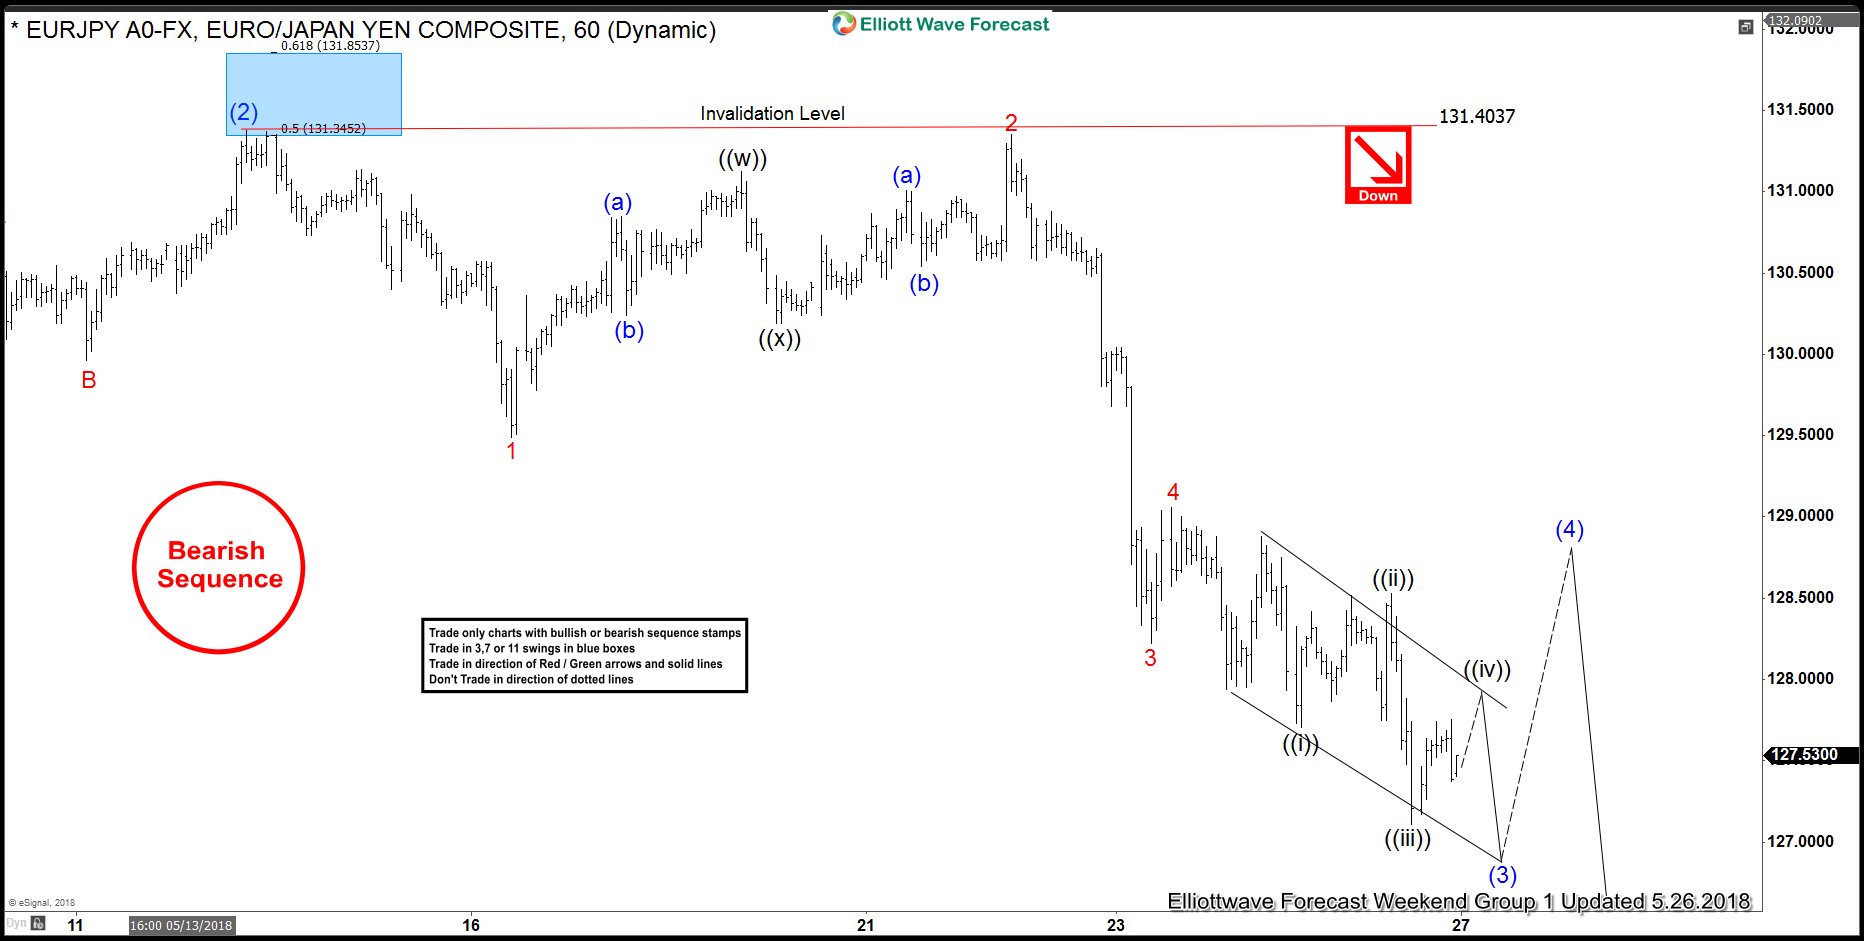
EURJPY short-term Elliott Wave view suggests that the bounce to 5/14 high at 131.38 ended wave (2). Down from there, the decline is unfolding as Elliott wave impulsive structure as expected and should complete wave (3). The internal sub-division of each leg lower is showing 5 waves structure in lesser degree cycles, which is characteristic of an an impulse. Also, it’s important to note here that the below chart is showing a bearish sequence tag, which refers to the incomplete downward structure in the pair.
Wave 1 of (3) completed at 129.49, wave 2 of (3) completed at 131.35, dip to 128.22 was wave 3 of (3) and small bounce to 129.06 was wave 4 of (3). Pair has already made new lows in wave 5 of (3) and should ideally completed wave (3) between 127.10 – 126.08. Then, we should expect a bounce in wave (4) to correct the decline from 131.38 high before turns lower again in wave (5) towards 125.19 – 123.21 area. We don’t like buying the pair and as pair has a bearish sequence tag in attached 1 hour chart, we expect to see sellers appearing in wave (4) bounce in the sequence of 3, 7 or 11 swings.
EURJPY Elliott Wave 1 Hour Chart
Back

