In this Technical blog we are going to take a quick look at the past 1 hour Elliott Wave performance of EURGBP cycle from July 14 low, which we presented to our clients at elliottwave-forecast.com. We are going to explain the structure from that cycle.
EURGBP 1 Hour Elliott Wave Chart
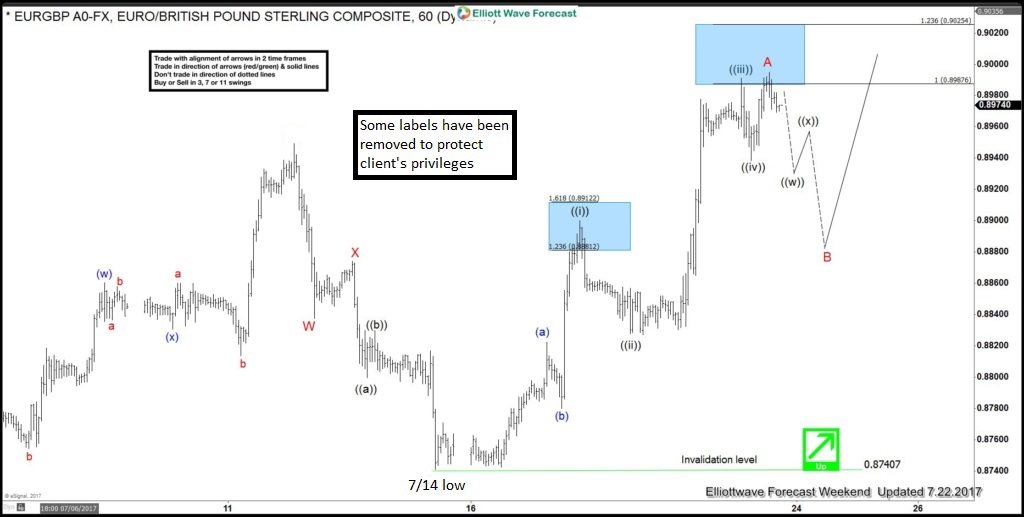
In this Technical blog, we are going to take a quick look at the EURGBP 1 hour chart from July 25, 2017. In which the bounce from 7/14 low (0.8740) appeared to be in 5 waves sequence & the structure of the bounce looked impulsive rather then corrective sequence. Thus suggesting the cycle from 7/14 low (0.8740) could be following the Elliott wave Zig-zag pattern. Where Minute wave ((i)) ended at 0.8897 peak and Minute wave ((ii)) pullback at 0.8827 low. Minute wave ((iii)) ended at 0.8989 peak, Minute wave ((iv)) pullback at 0.8938 low and Minute wave ((v)) of A ended at 0.8993 peak.
So after ending 5 waves up from 7/14 low (0.8740) in Minor wave A pair was expected to see a 3 wave pullback in Minor wave B for the correction of 7/14 cycle before further upside was seen. So our strategy was to buy that dip in the pair in sequence of 3, 7 or 11 swings for Minor C leg higher provided the pivot at 7/14 low remained intact.
EURGBP 1 Hour Elliott Wave Chart
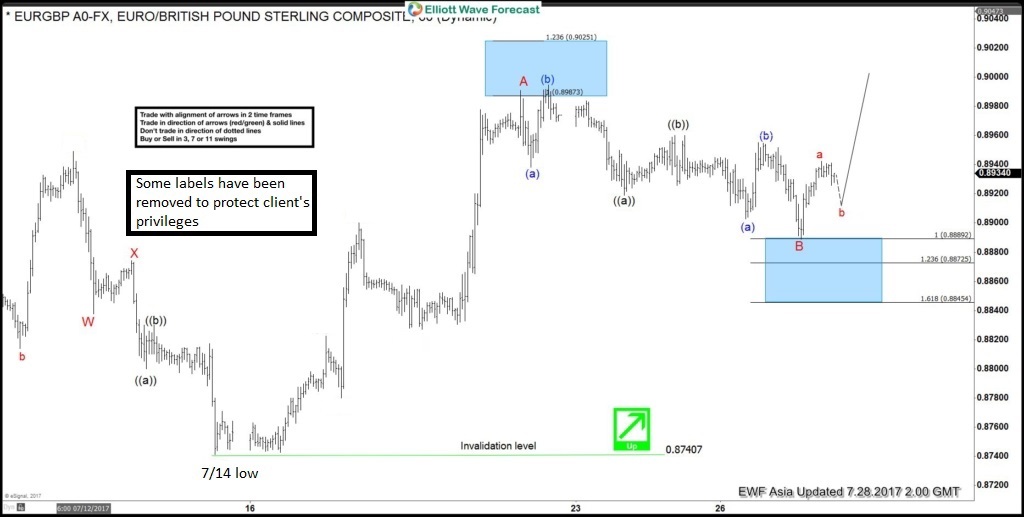
Afterwards pair did the 3 wave pullback in Minor wave B for the correction of cycle from 7/14 low (0.8740) and found buyer’s as expected from the blue box area (0.8889-0.8887) 100%-123.6% fibonacci extension area. Where the internal subdivision of Minor wave B was also unfolded as an Elliott wave zigzag structure. Minute wave ((a)) ended at 0.8919 low, Minute wave ((b)) bounce ended at 0.8958 peak and Minute wave ((c)) of B lower at 0.8888 low.
EURGBP Latest 1 hour Elliott Wave Chart
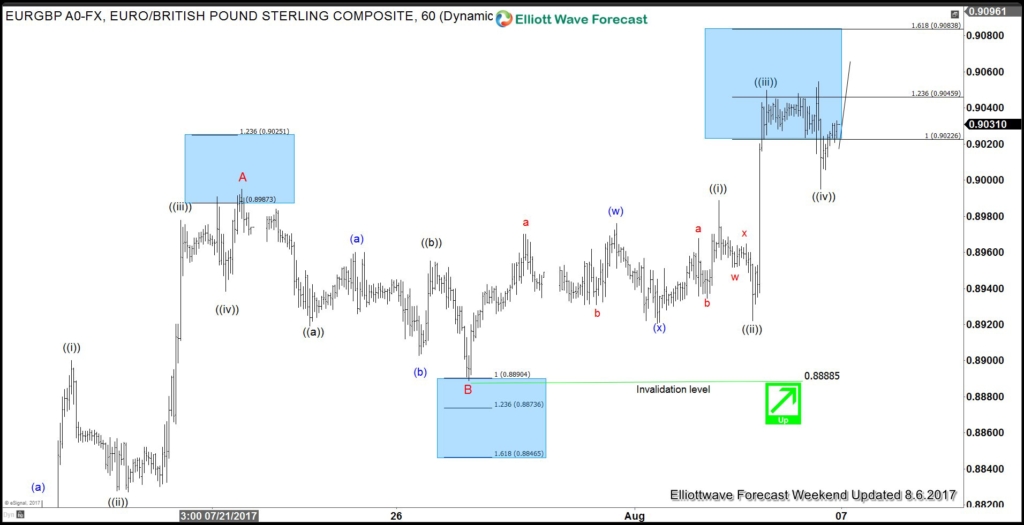
The pair then broke to new highs as expected after finding buyer’s at 0.8889-0.8887 100%-123.6% fibonacci extension area suggesting the Minor C leg higher has started in the pair. And could have ended Minute wave ((i)) of C at 0.8987. Minute wave ((ii)) pullback at 0.8921, Minute wave ((iii)) at 0.9053 peak and Minute wave ((iv)) could be done at 0.8994 low and now as far as pivot from 0.8885 low remains intact pair can extend 1 more leg higher in Minute wave ((v)) of C before ending the cycle from 7/14 low.
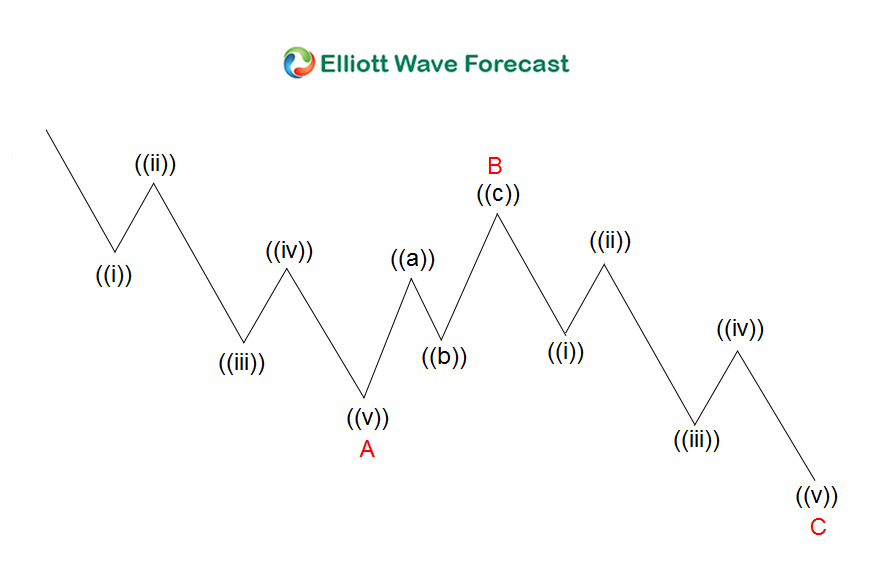
According to Elliott wave theory Zigzag is a 3 wave structure having internal subdivision of (5-3-5) swing sequence. The internal oscillations are labeled as A, B, C where A = 5 waves, B = 3 waves and C = 5 waves. This means that A and C can be impulsive or diagonal waves. The A and C waves must meet all the conditions of wave structure 5, such as: having an RSI divergence between wave subdivisions, ideal Fibonacci extensions, ideal retracements etc. At the graphic above, we can see what Elliott Wave Zig Zag structure looks like. 5 waves down in A, 3 wave bounce in B and another 5 waves down in C.
If you enjoyed this article feel free to try our Free 14 day Trial or email at hassansheikh@elliottwave-forecast.com to get a special discount offers on any Subscription plan you pick ( For new members only ). we provide Elliott Wave charts in 4 different time frames, up to 4 times a day update in 1 hour chart, two live sessions by our expert analysts, 24 hour chat room moderated by our expert analysts, market overview, and much more! Try us out Free for 14 Day Trial & starts making profits with us.
Back


