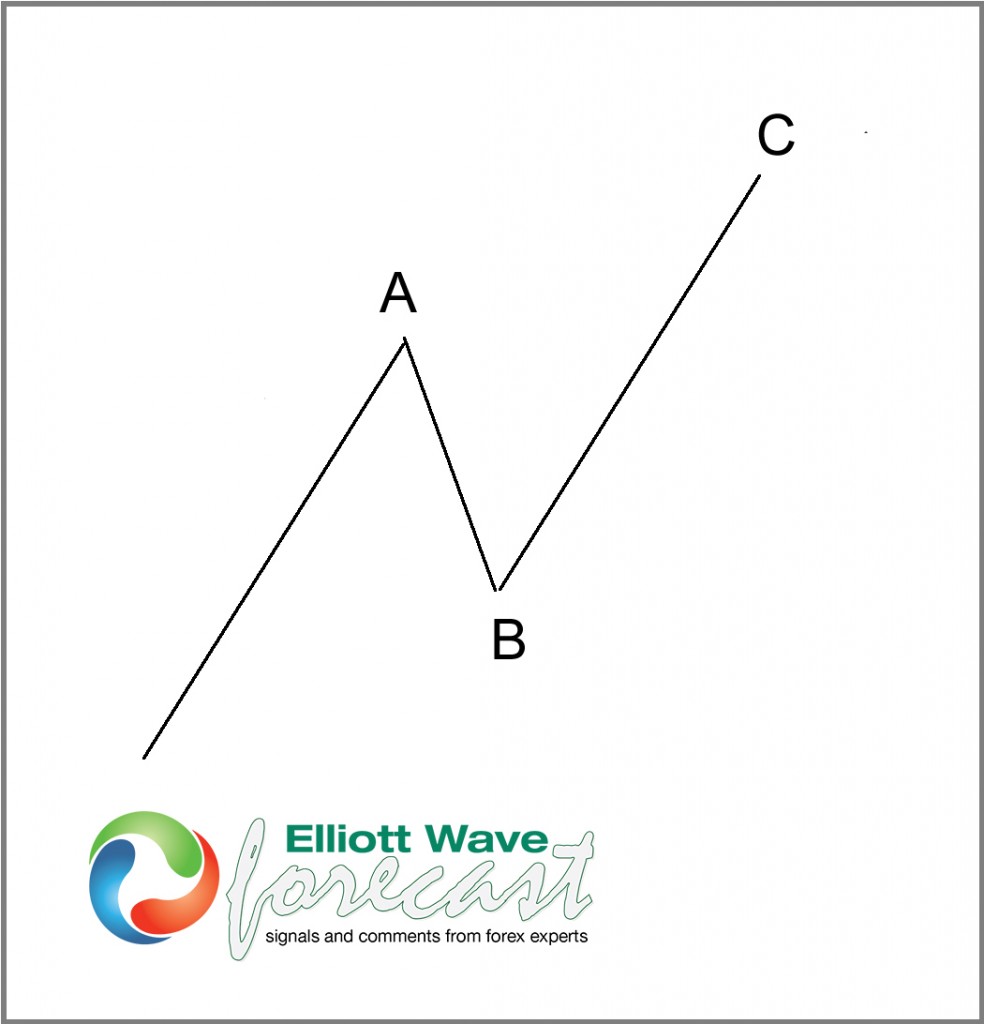
In today’s trading environment, market seldom moves in 5 impulsive waves and 3 waves corrections like in the past. Today’s market is driven by High Frequency Trading and algos, and it moves in corrective manner most of the time with equal leg ABC or WXY ruling the market. In this blog, we will take a look at equal leg and WXY pattern with AUD/JPY chart. First, let’s see the basic structure of equal leg and ABC. In this pattern, wave C = wave A in length or sometimes called equal leg. We define equal leg zone as a zone starting with wave C = wave A, and ending with wave C = 1.236 ext of wave A.
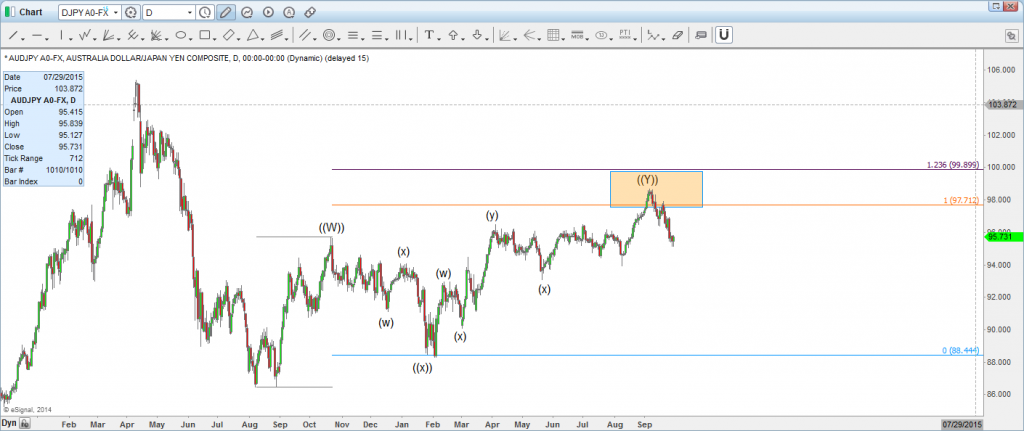
Next let’s take a look at the daily AUD/JPY chart below
From August 2013, AUD/JPY rallies in WXY pattern.
Wave ((W)) is complete at 95.67
Wave ((X)) is complete at 88.47
Using equal leg technique, we can measure the equal leg zone as:
Wave ((Y)) = Wave ((W)) at 97.88
And wave ((Y)) = 1.236 ext of wave ((W)) at 100.08
Thus, we can expect completion of wave ((Y)) between 97.88 – 100.08, and as we can see from the chart, AUD/JPY indeed reversed pretty strongly from the area.
Thank you for reading and if you would like to know the next path in AUD/JPY and 25 other instrument, I invite you to join us with our 14 day Trial. We have 24 hour coverage of 26 instruments from Monday – Friday. We provide Elliott Wave chart in 4 different time frames, four times update of 1 hour chart throughout the day, two live sessions by our expert analysts, 24 hour chat room moderated by our expert analysts, market overview, and much more! With our expert team at your side to provide you with all the timely and accurate analysis, you will never be left in the dark and you can concentrate more on the actual trading and making profits.
Kind regards,
Hendra Lau – Technical Analyst at Elliott Wave Forecast
Back


