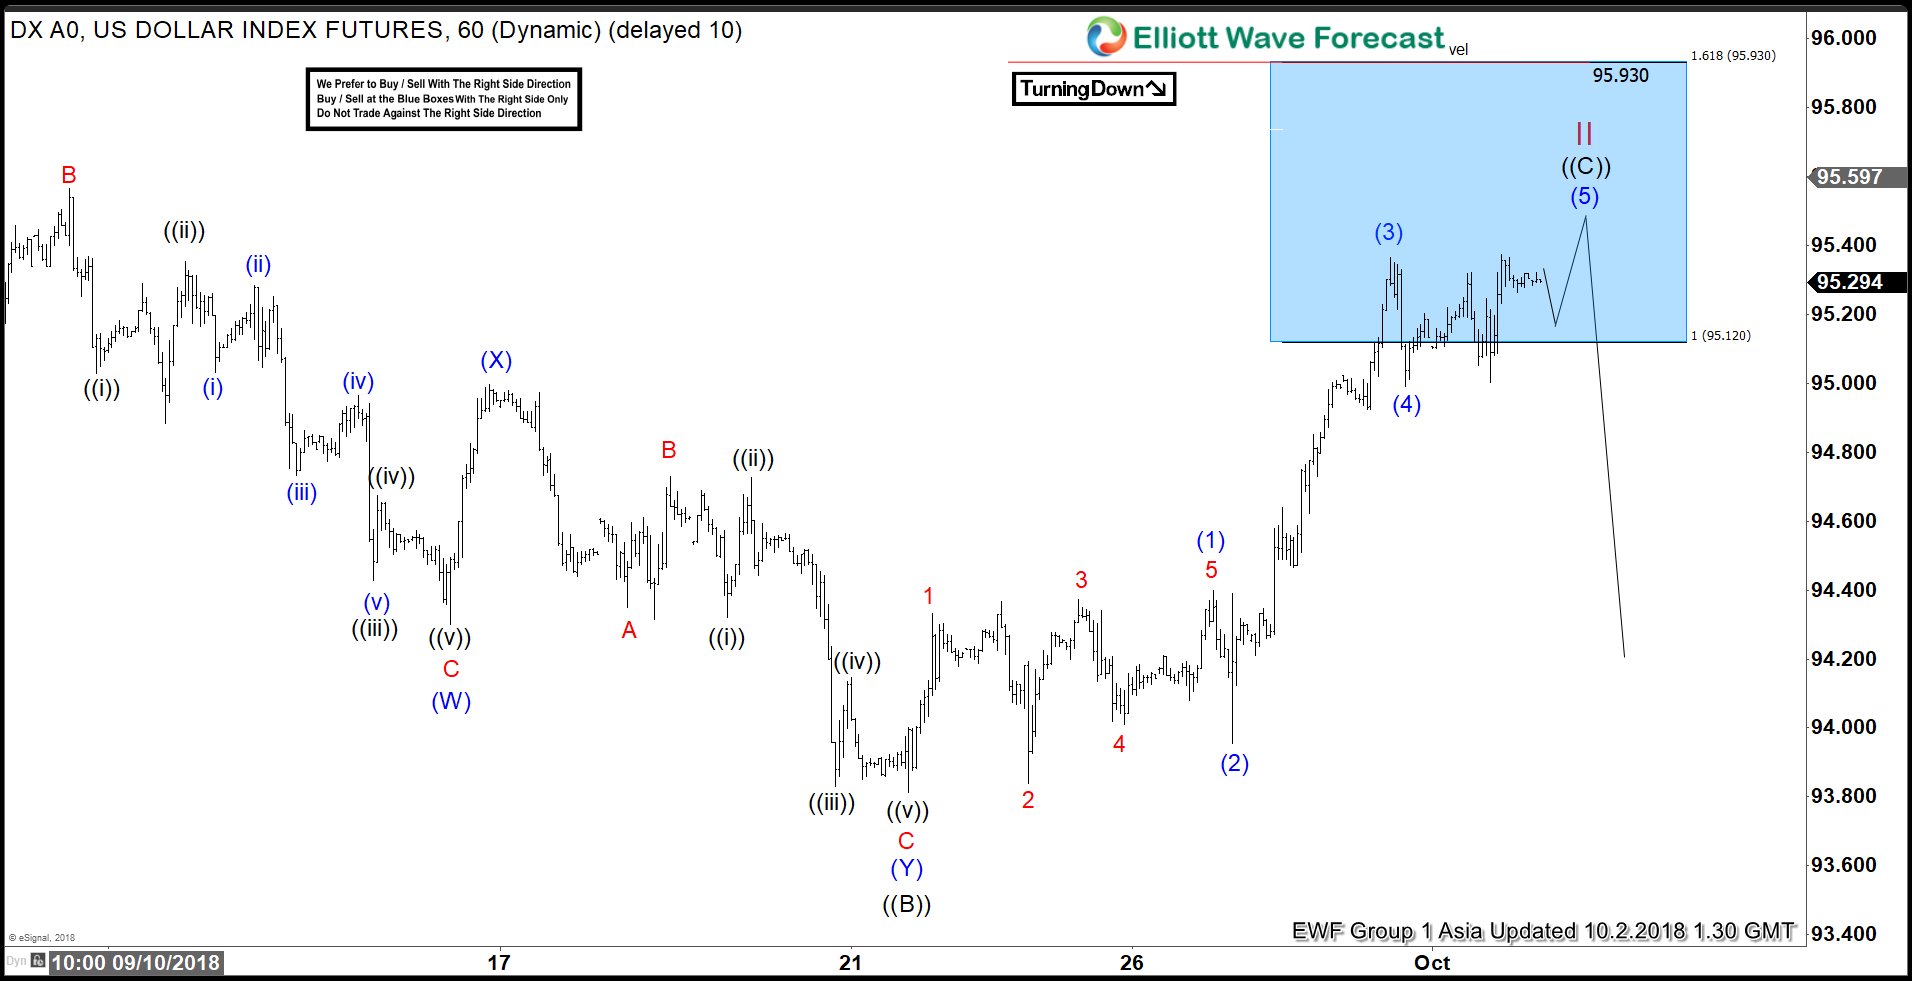
DXY short-term Elliott wave view suggests that the index is doing a Flat correction coming from 8/28/2018 low within cycle degree wave II. Meaning that the internal distribution of cycle from that low is showing the sub-division of 3-3-5 wave structure. Where primary wave ((A)) ended in 3 swings at 95.73 on 9/04 peak. Down from there the decline to 93.81 low ended primary wave ((B)) lower as double three structure with the sub-division of 3 wave corrective sequence in intermediate wave (W),(X) & (Y).
The initial decline to 94.43 low ended intermediate wave (W) as zigzag structure. Up from there, the bounce to 94.99 high ended intermediate wave (X). Down from there, the decline to 93.81 low ended intermediate wave (Y) as zigzag structure & also completed the primary wave ((B)) as well. Above from 93.81 low, the rally higher is taking place as an impulse in primary wave ((C)) of II with the sub-division of 5 waves structure in intermediate wave (1),(3) & (5).
Where the first leg higher to 94.40 high ended intermediate wave (1). And pullback to 93.95 low ended intermediate wave (2). A rally to 95.36 high ended intermediate wave (3). Then a pullback to 94.99 low ended intermediate wave (4). Near-term intermediate wave (5) remain in progress looking to extend higher 1 more time within the blue box area by holding below the 95.93 invalidation level before ending the Flat correction in cycle degree wave II. Afterwards, the index is expected to resume the downside or should react lower in 3 swings at least. We don’t like buying the index.


