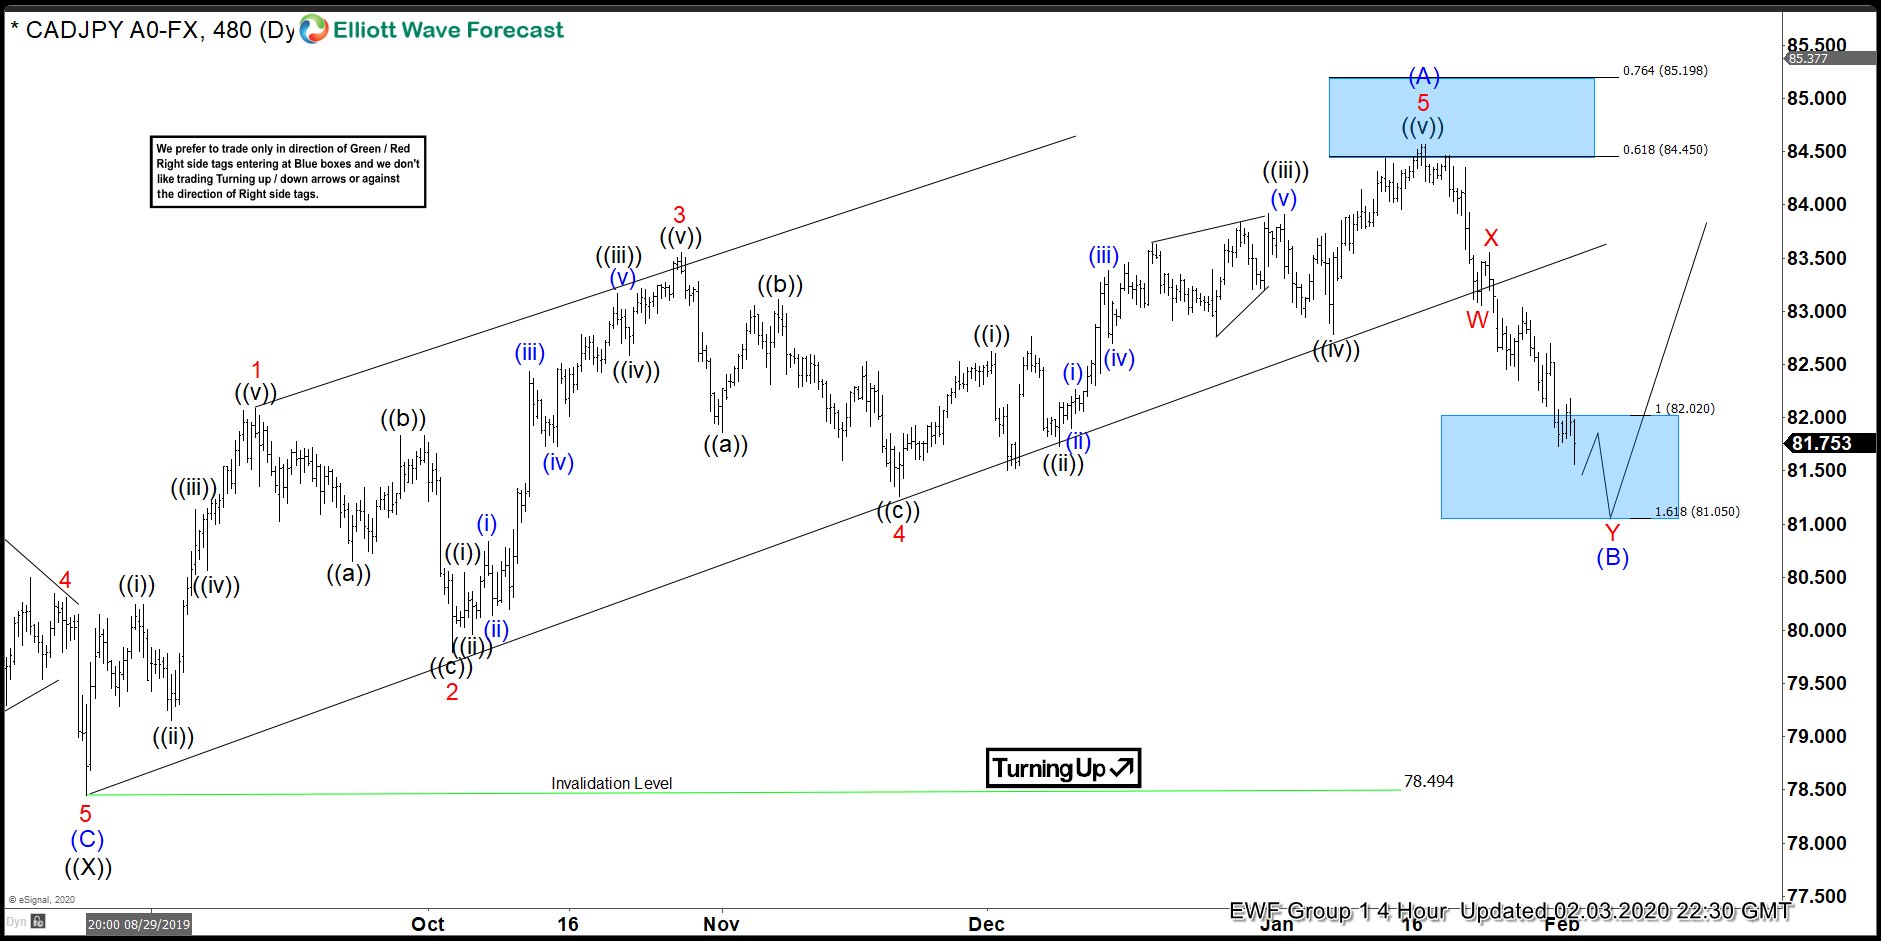
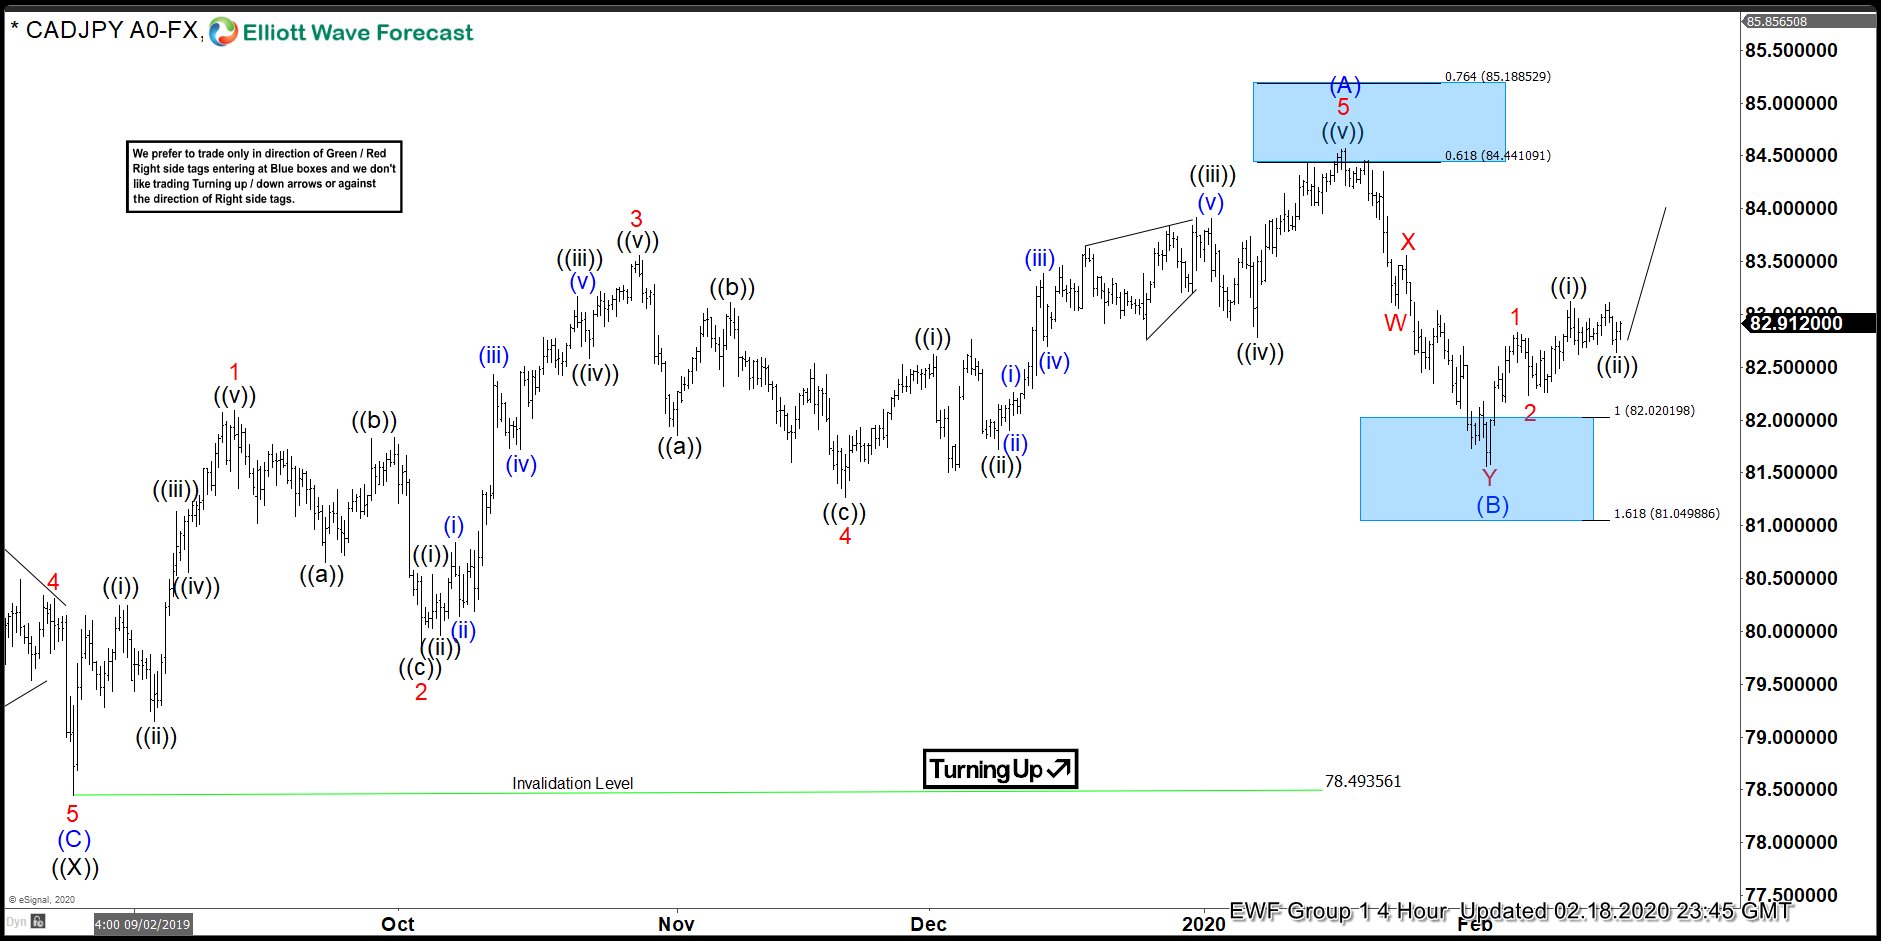
In this blog, we are going to take a look at the Elliottwave chart of CADJPY. The rally from August 26, 2019 low unfolded as 5 waves impulsive move up in wave (A) as a diagonal. Based on Elliottwave theory, the impulsive wave up will be followed by 3 waves correction before resuming to the upside. Therefore, we were expecting to buy at the extreme area, which is the 100% – 161.8% extension of wave W-X. We showed this area with a blue box. The blue box is the area where we expect buyers to appear for an extension higher or 3 waves bounce at least.
CADJPY 2.3.2020 4 Hour Elliott Wave Update
The chart from 2.3.2020 4 hour update showed that CADJPY ended wave (A) at 84.57 high. While below that high, we expect the pair to correct the cycle from 8.26.2020 low in wave (B), which unfolded as a a double three. Wave W of (B) ended at 83.07 low and wave X of (B) ended at 83.55 high. From there, we expect wave Y of (B) to end at the 100%-161.8% Fibonacci extension of W – X. That area should see buyers appear for a 3 waves bounce at least or an extension higher. The chart showed that the pair has already reached this area. However, it is possible for the pair to extend lower before ending wave (B).
CADJPY 2.18.2020 4 Hour Elliott Wave Update
The chart from 2.18.2020 4 hour update showed that CADJPY did not extend lower and ended wave (B) at 81.58 low. The pair then bounced higher from there. Wave 1 ended at 82.82 high and wave 2 ended at 82.25 low. Wave ((i)) ended at 83.12 high and wave ((ii)) ended at 82.63 low. As long as the pivot at 82.63 low stays intact, the pair can continue to extend higher in wave (C) and the dip in 3,7,11 swings should be supported. A break above wave (A) high at 84.57 high will confirm the extension higher.
We cover 78 instruments in 4 different time frames. Please check out our services Free for 14 days to see and learn how to trade blue boxes using the 3,7, or 11 swing sequence.
Back


