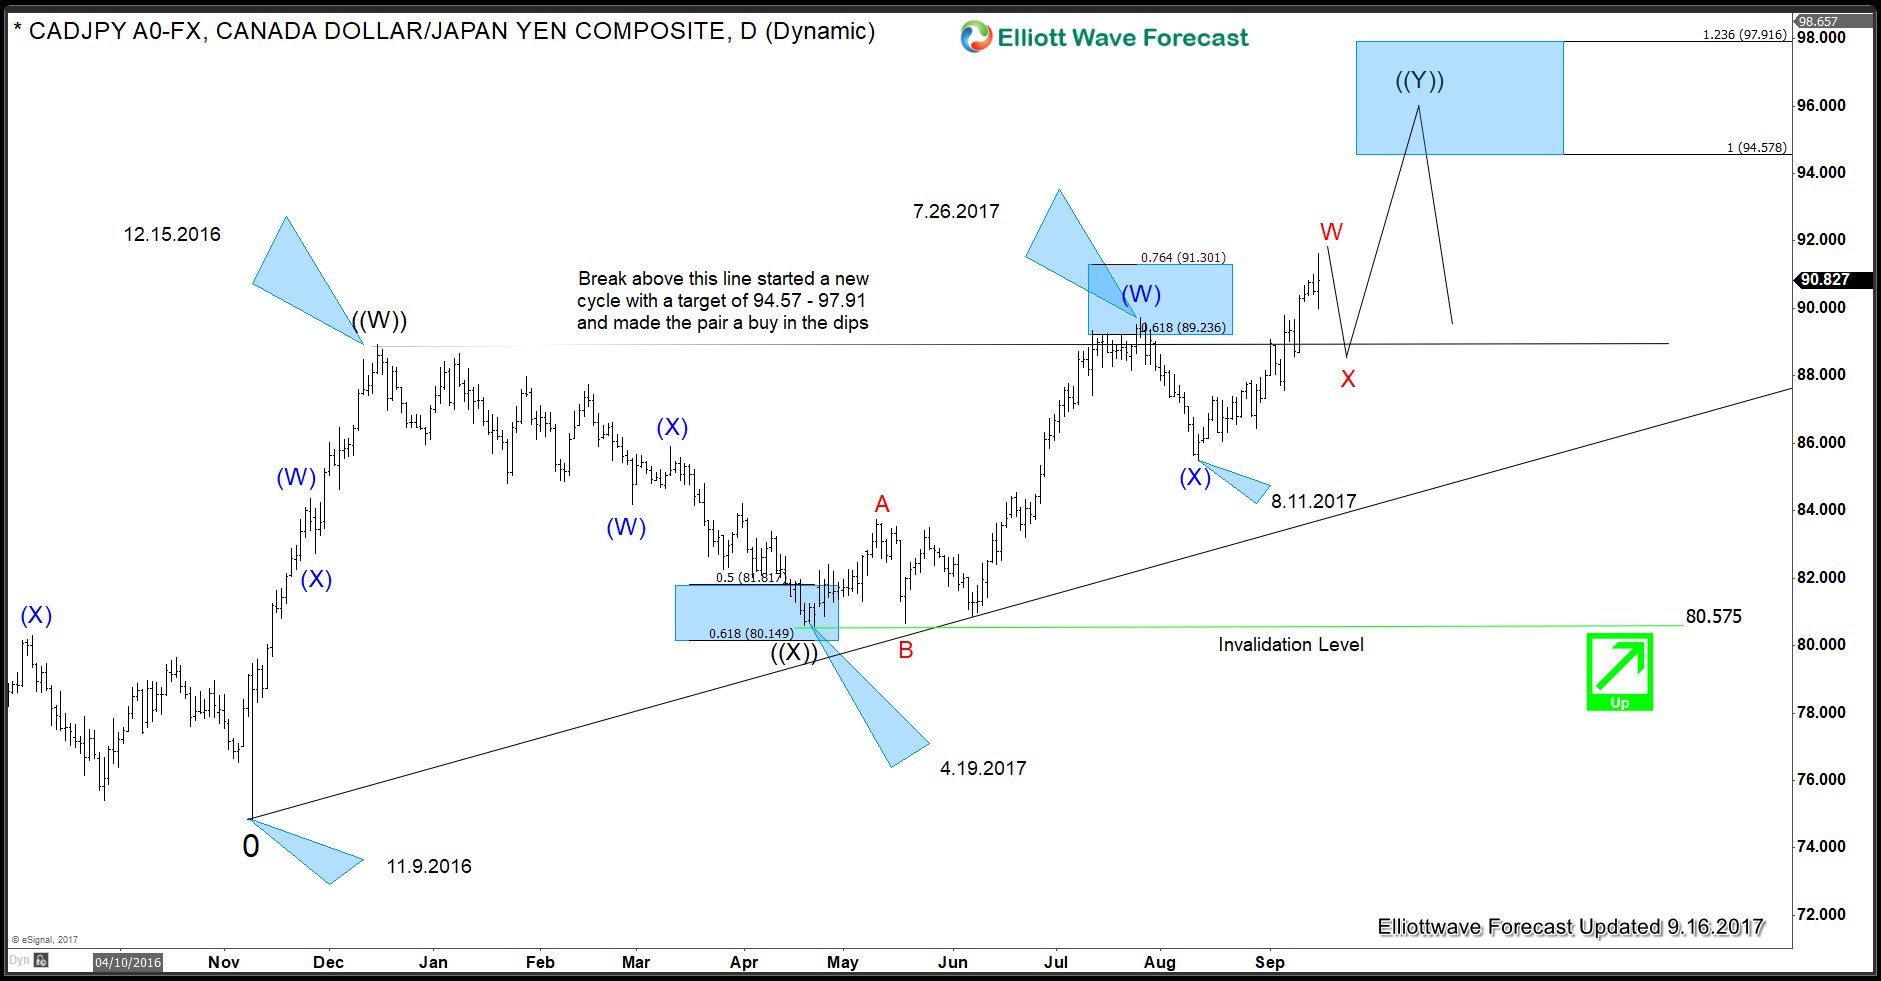
CADJPY Elliott Wave Sequence is bullish and incomplete to the upside due to which we have been telling clients not to sell the pair and use the dips as an opportunity to get long for higher prices. Our Live Trading Room was able to catch a long in CADJPY for a profit of +197 pips recently and in this blog, we will take a look at CADJPY daily chart to show that the rally is not over yet and any pull backs should still be viewed as a buying opportunity in the sequence of 3, 7 or 11 swings.
CADJPY Elliott Wave Sequence from 11.9.2016
Daily chart of CADJPY shows the pair rallied in 3 waves from 11.9.2016 low to 12.15.2016 high. Then, the pair pulled back to 50 – 61.8 Fibonacci retracement area of the rally from 11.9.2016 low and made a new high above 12.15.2016 peak. As soon as pair broke above 12.15.2016 peak, it created a bullish Elliott wave sequence with a target of 94.57 – 97.91 area. We know that market doesn’t move in a straight line and always does pull backs. Since the pair broke above 12.15.2016 peak, we have been telling clients to use pull backs as a buying opportunity in 3, 7 or 11 swings. As far as dips hold above 8.11.2017 low i.e blue (X) low, pair should remain supported and see more upside towards 94.57 – 97.91 area.
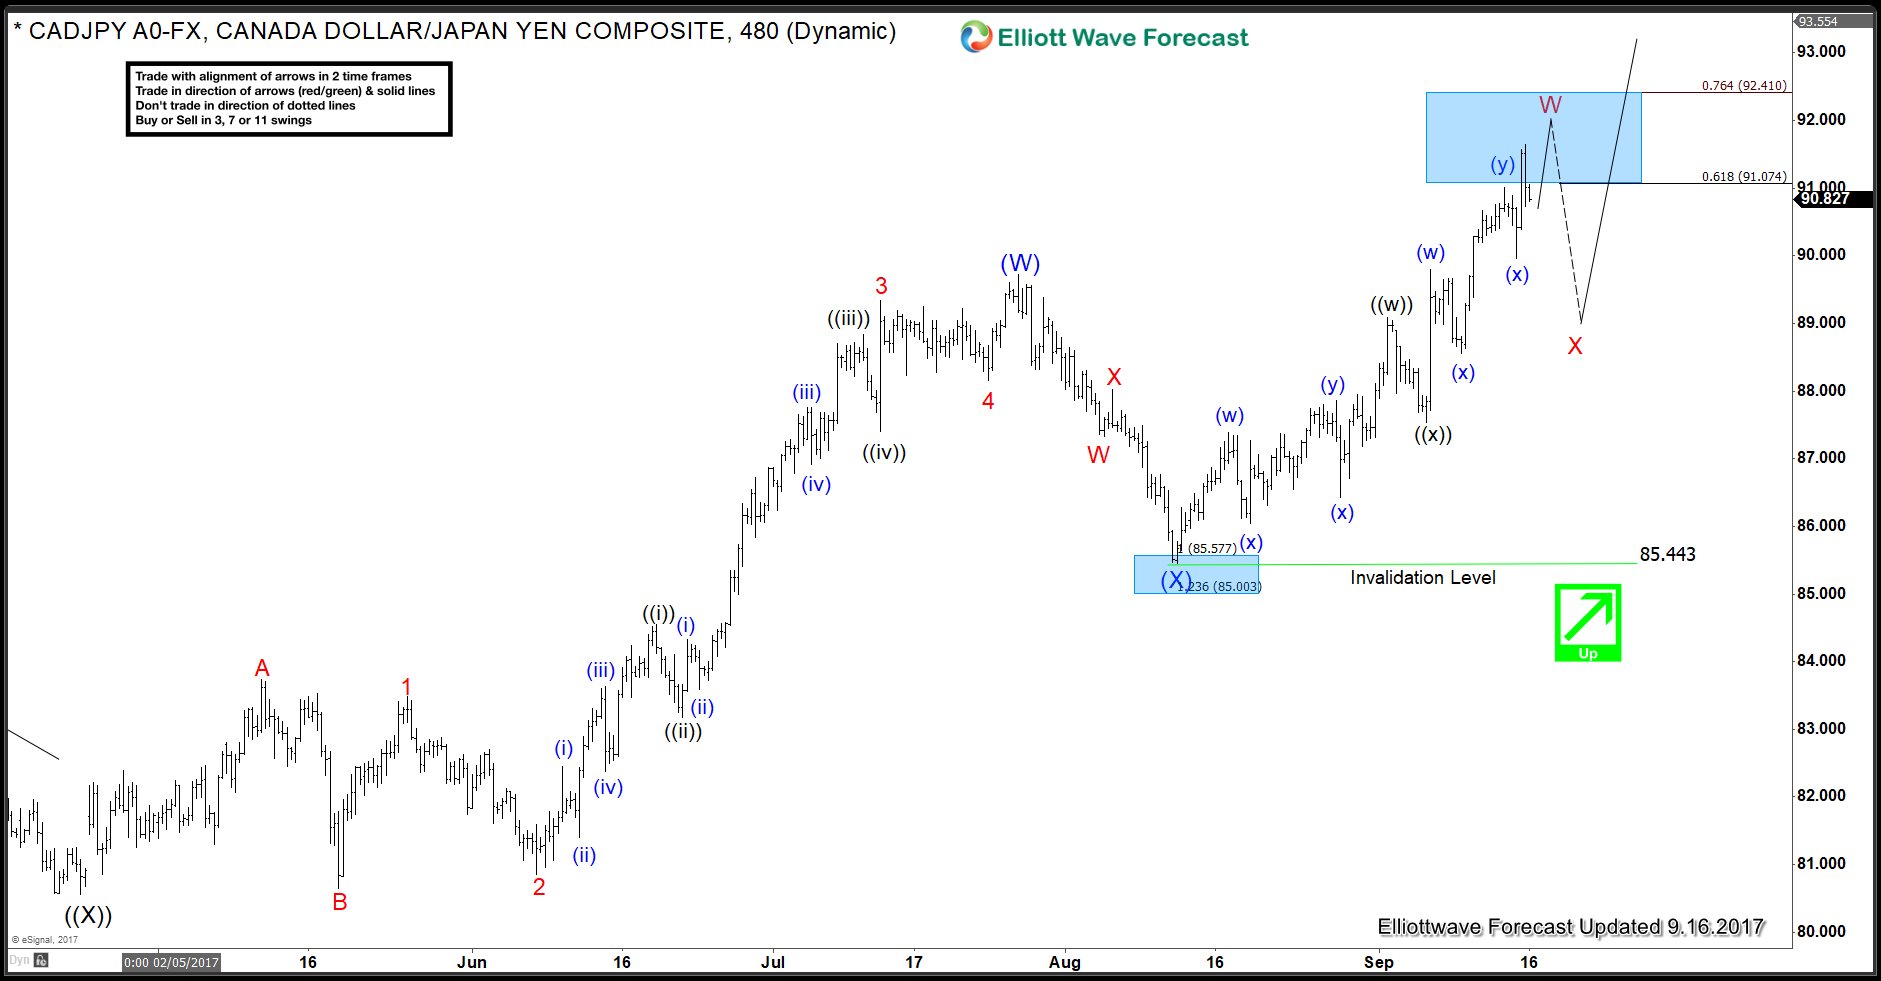
CADJPY 8 Hour Elliott Wave Analysis
Pair is showing 5 swings up from 4.19.2017 low which makes Elliott wave sequence incomplete and bullish against 8.11.2017 low in this time frame. Pair has reached 0.618 – 0.764 Fibonacci extension area of (W)-(X). This is the area which will typically end 5th swing in a 7 swing sequence. Therefore, we don’t like chasing the longs here as a pull back can be seen soon in wave X. We don’t like selling the pair and expect wave X pull back to find buyers in 3, 7 or 11 swings as far as pivot at 8.11.2017 i.e. blue (X) at 85.44 low remains intact.
Back


