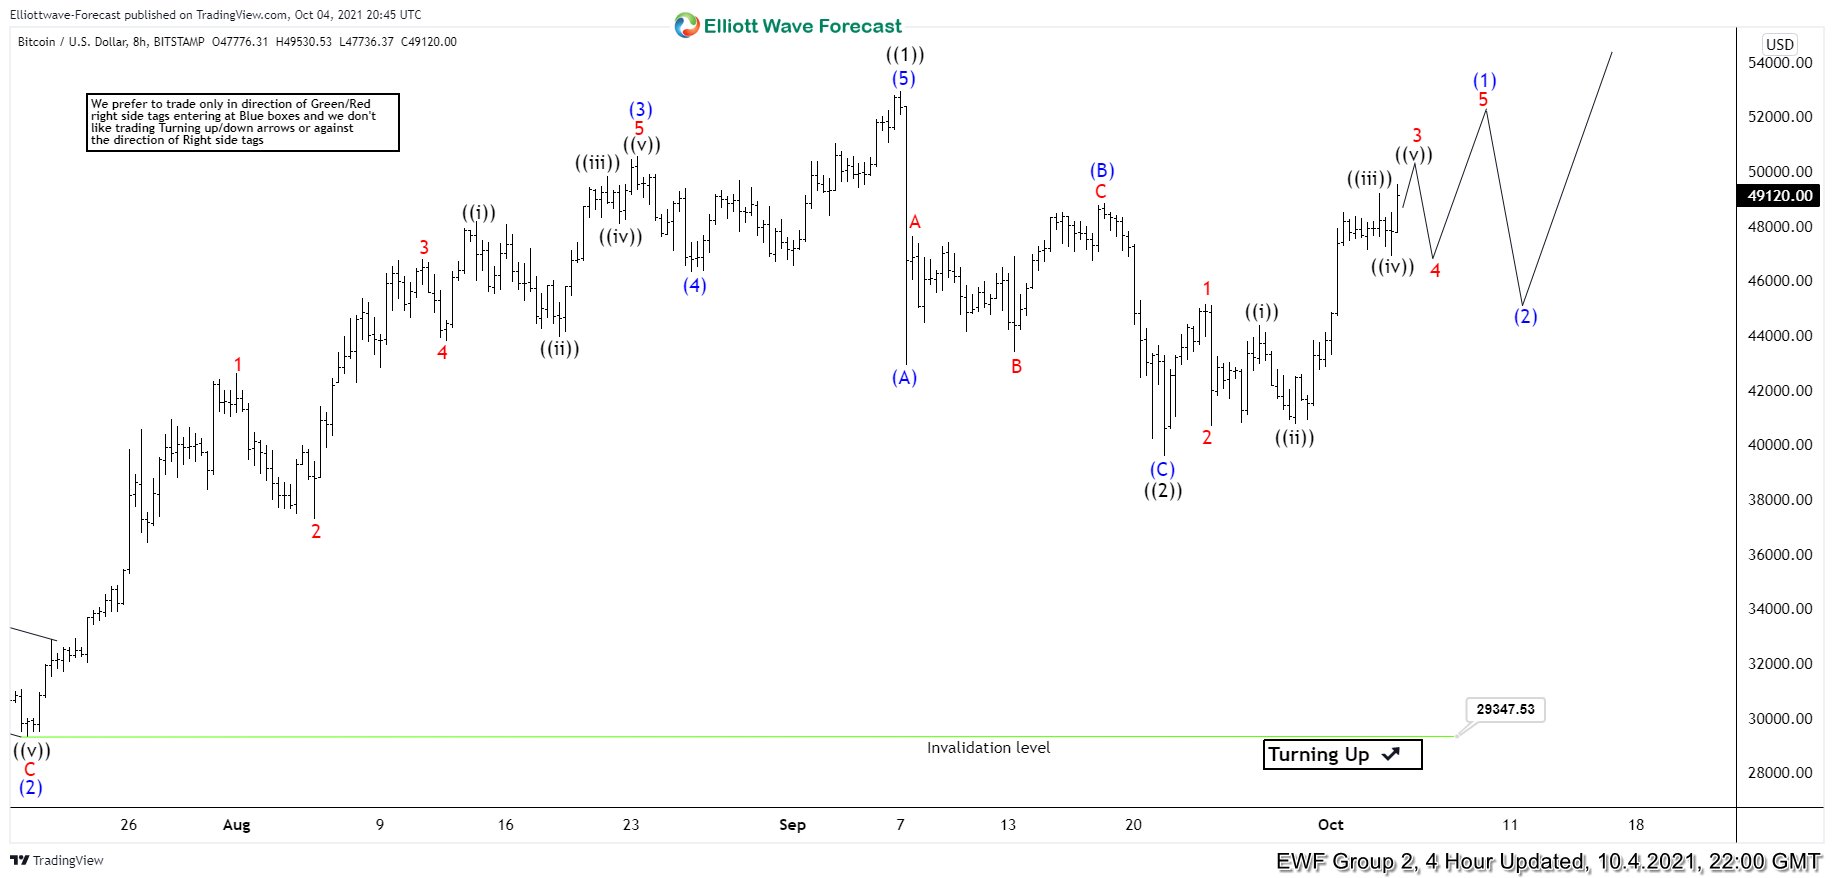
In this article, we will look at the correction in BTCUSD during the month of September and how we called the rally after it completed a Zigzag Elliott wave correction. Chart below is from 28th September 2021 when we called the correction completed and called for the rally to resume. We saw an Elliott wave pattern called nesting which is basically a series of 1-2-((i))-((ii)) and is seen before acceleration in wave ((iii)) takes place.
BTCUSD 4 Hour Elliott Wave Analysis 9.28.2021
BTCUSD 4 Hour Elliott Wave Analysis 10.4.2021
BTCUSD held above the low of red 2 and rallied strongly just as the chart on 9.28.2021 anticipated. We can see in the chart below that wave ((iii)) has completed and after a pull back in wave ((iv)), Bitcoin is closer to ending wave ((v)) of 3. Afterwards, we expect a pull back in wave 4 to correct the rally from red 2 low before another high to complete 5 waves up from black ((2)) low. Once wave (1) is completed, expect a pull back in wave (2) to correct the cycle from black ((2)) low before continuation higher. A break of black wave ((1)) peak will add more conviction to this view. Until then, a double correction lower in wave ((2)) can’t be ruled out and if seen, should present another good swing buying opportunity.
Back


