Commodity currencies have been in the decline this year against US Dollar as a result of market’s expectation of the Fed’s rate hiking cycle. A falling Australian Dollar will make imported products more expensive, resulting in price increase and adding to existing inflationary pressure. The higher the inflation rate, the faster the Reserve Bank of Australia (RBA) need to bring forward the first increase in cash rate. The Melbourne Institute monthly inflation gauge rose by 0.3 per cent in November to be up 3.1 per cent on the year. A sustained build up in inflation will bring forward the tightening cycle which then should eventually provide support in the Australian Dollar. In the meantime however, the Australian Dollar can continue to see selling pressure against US Dollar as a result of the divergence in monetary policy.
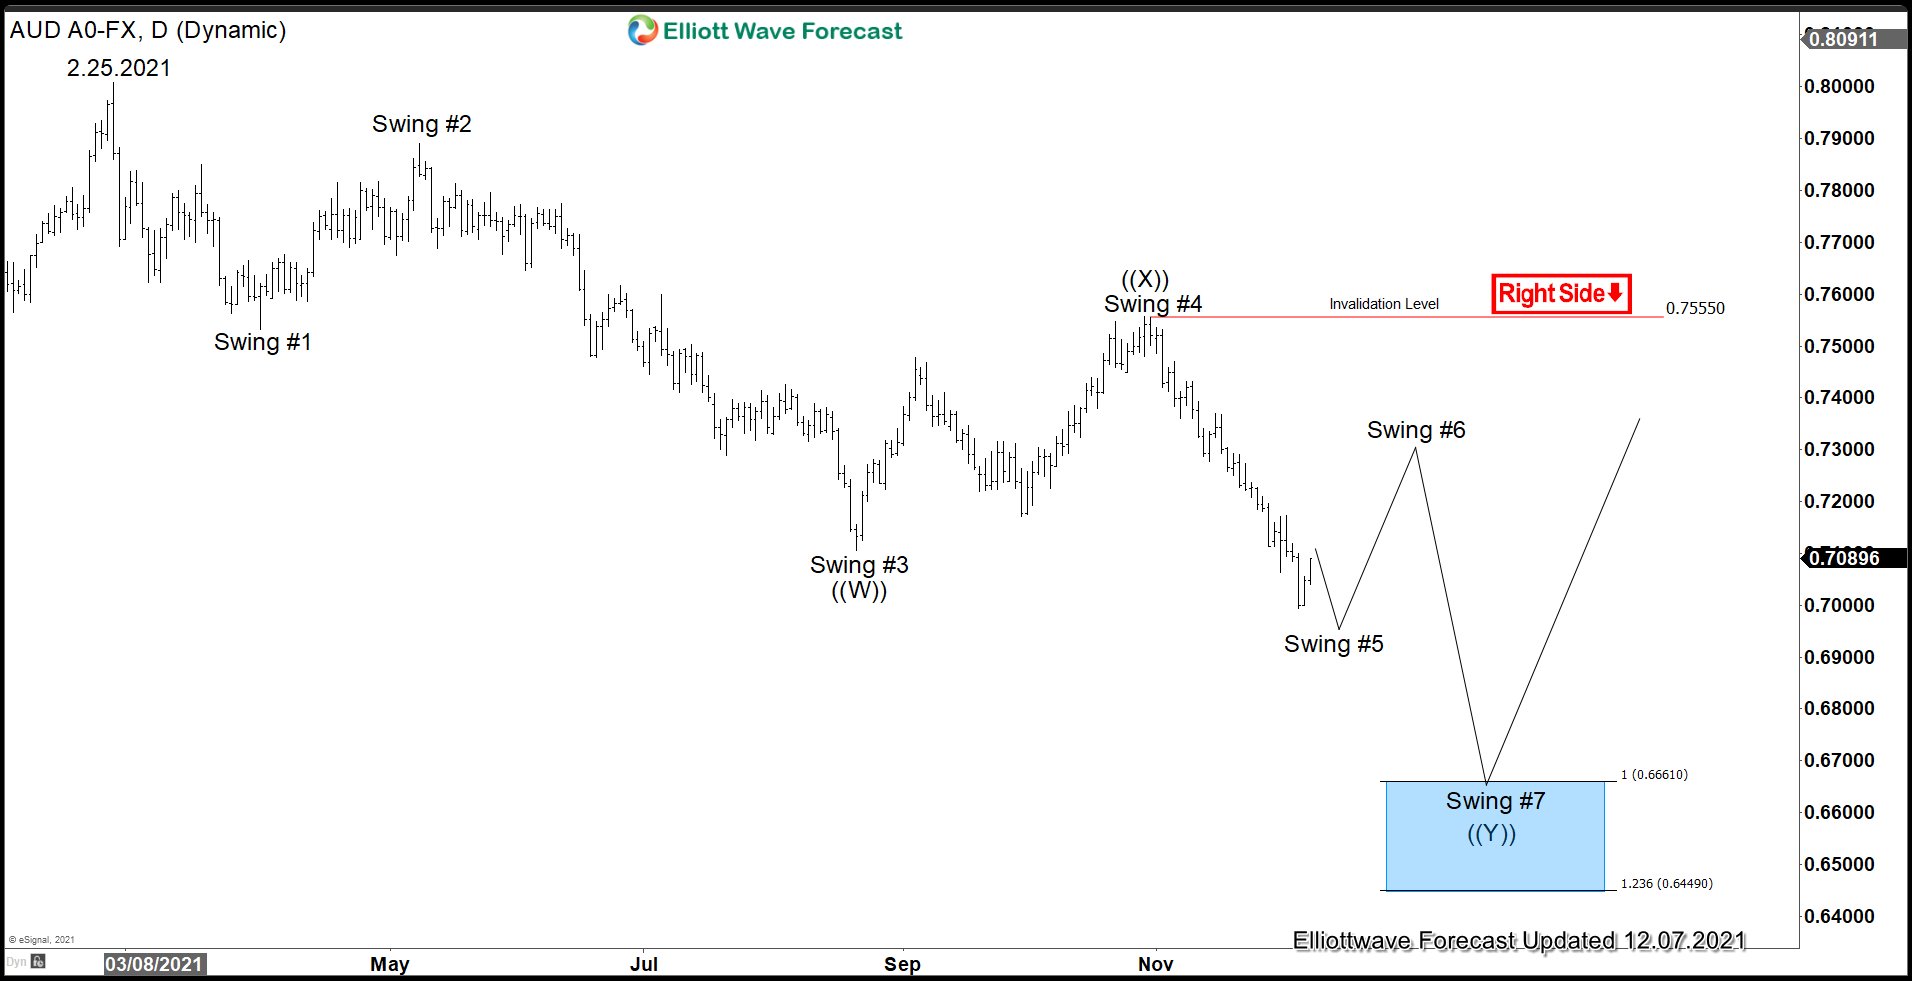
AUDUSD Daily Elliott Wave Chart
Daily chart of AUDUSD above shows a 5 swing incomplete sequence from February 25, 2021 high favoring further downside in the pair. The entire decline can be counted as a double three Elliott Wave structure where wave ((W)) ended at 0.7106. Pair then rallied and ended wave ((X)) at 0.7556. It has resumed lower and broken below the third swing, suggesting the next leg lower has started. This pattern suggests further downside in the pair as long as rally fails below 0.755. Potential target lower for swing #7 is 100% – 123.6% Fibonacci extension of the swing #3 which comes at 0.645 – 0.666.
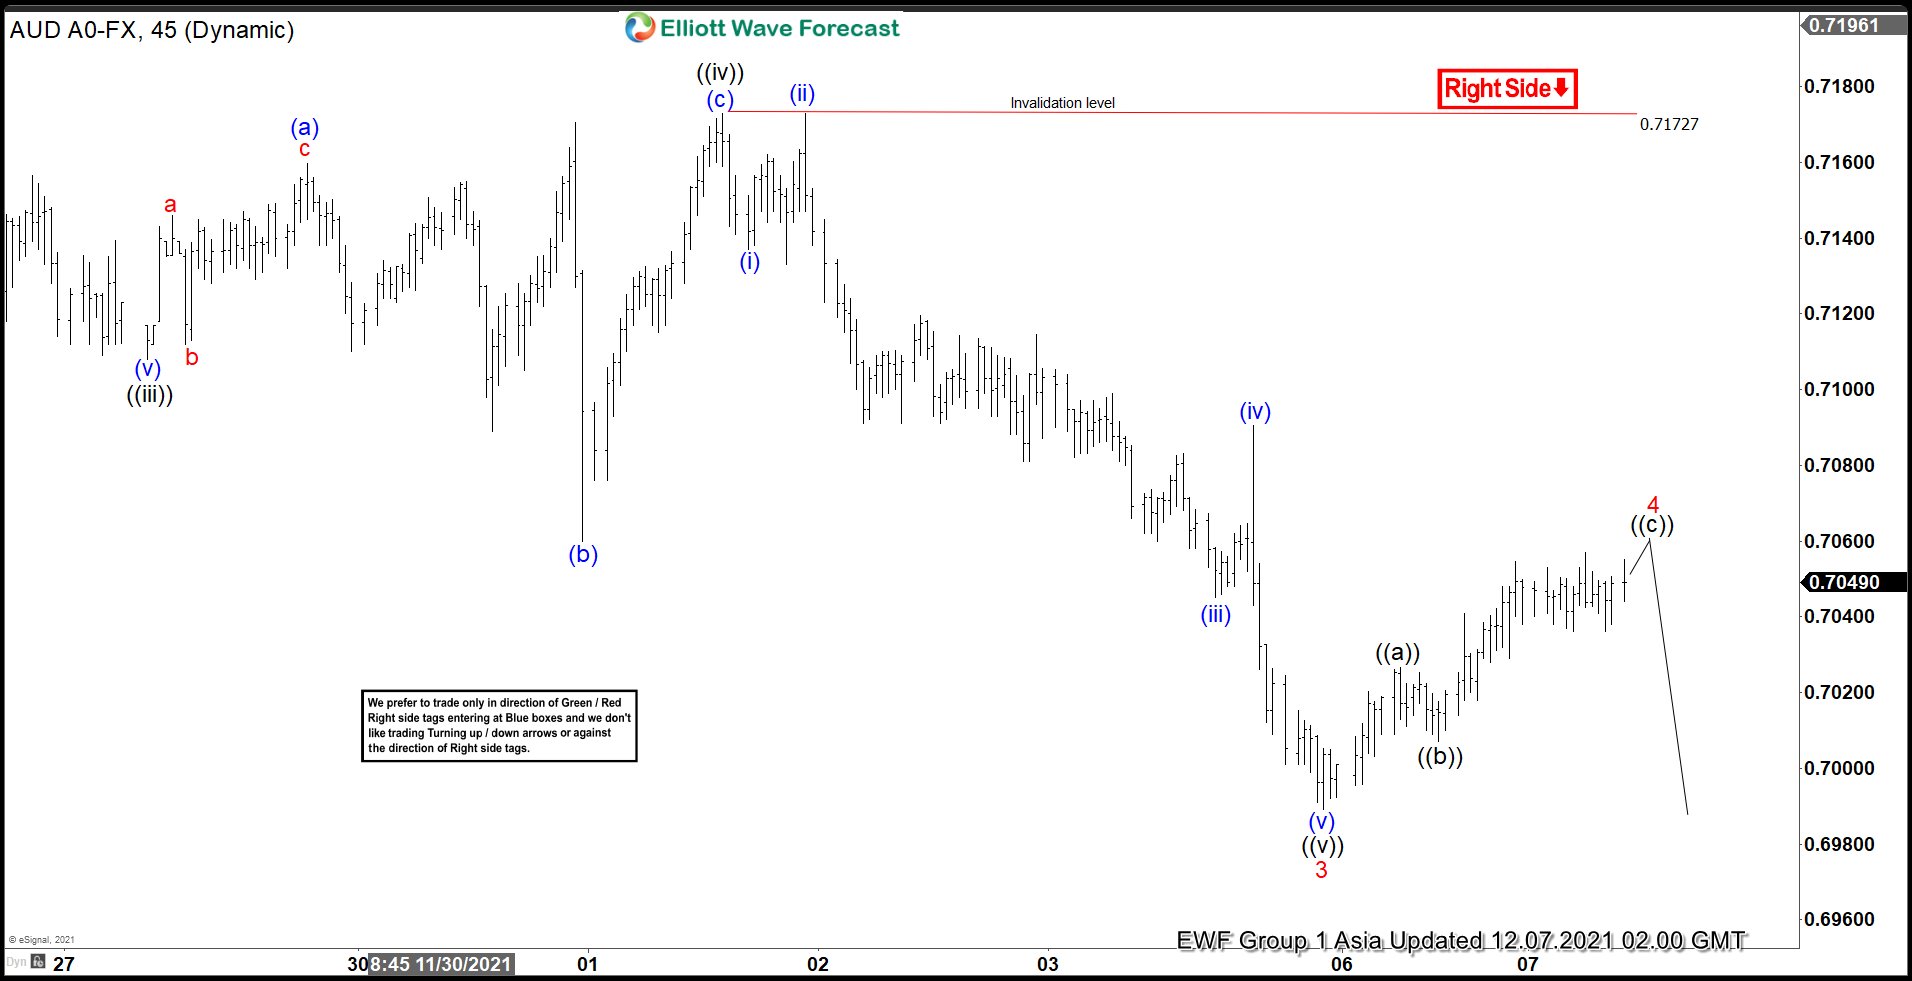
AUDUSD 1 Hour Elliott Wave Chart
1 Hour Asia chart above shows that pair could see another leg lower to complete wave 5 which then should end wave (A) and complete cycle from October 29, 2021 high. Afterwards, pair should rally in wave (B) to correct cycle from October 29 high before turning lower again. Alternatively, pair might have already ended wave (A) and in the process of doing larger degree rally to correct cycle from October 29, 2021 high before it resumes lower again.
For more updates on forex, indices, and commodities, you can take our trial here –> 14 Days Trial
Back


