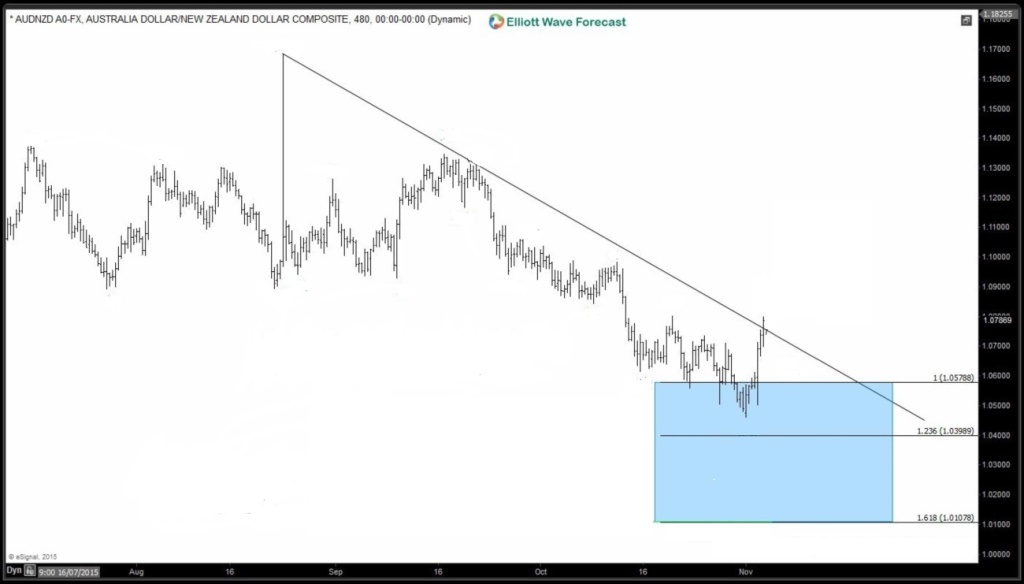
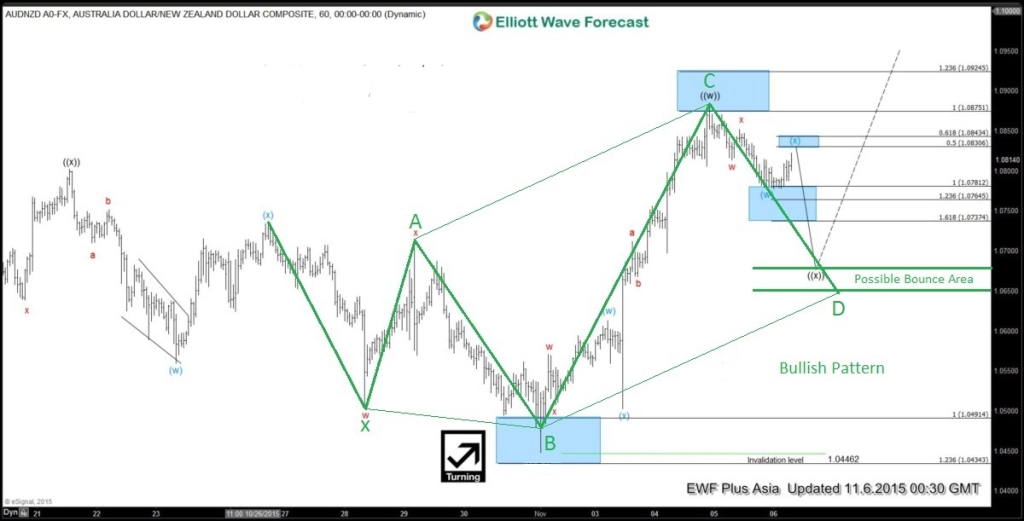
AUDNZD has been moving lower since August 24/2015 and it’s possible that the pair has found a temporary bottom at the 1.0446 October 30 low. The pair has since bounced and on November 3/2015 it made a rally to break above the trend line which can possibly be signalling that more Aussie strength against the Kiwi will be coming in the following days and weeks. Any pullbacks now can find buyers possibly waiting at the 1.0688 – 1.0648 area to trade it higher. Also there is a bullish pattern on the 1 hour chart that coincides where our projected Elliott Wave ((x)) can possibly terminate which coincidentally is also at the 0.50% Fibonacci retracement of the October 30 rally. The 1.0688 – 1.0648 area is where the green bullish pattern triggers for the BUY and both the Elliott Wave count and green bullish pattern is invalidated if price gets below 1.0446. If it reverses higher from the Possible Bounce Area look for AUDNZD to make another swing higher targeting the 1.0965 – 1.1030 area.
Wait for price to enter the reversal area to get a better risk/reward trade setup.
*Please use proper risk/money management according to your account size*
AUDNZD Broke above trend line possibly signalling for more upside in the coming days and weeks.
AUDNZD 1 hour chart with green bullish pattern and possible bounce area.
At Elliottwave-Forecast we cover 50 instruments (Forex, Commodities, Indices) in 4 different timeframes and we offer 3 Live Session Webinars everyday. We do Daily Technical Videos, Elliott Wave Trade Setup Videos and we have a 24 Chat Room.
Our clients are always in the loop for the next market move.
Try Elliottwave-Forecast for 14 days FREE !!! Just click here –> 14 day FREE trial
Back


