AUDJPY recently made a new low below September 24 low which created an incomplete bearish sequence. Implications are for the decline to extend as far as the bearish sequence remains intact. In this article, we will look at some of the charts which called for this recent decline in AUDJPY. Our Chart of the day article dated 10.23.2020 showed the decline from October 9, 2020 peak was impulsive and the bounce was expected to fail for extension lower, let’s take a look at that chart below.
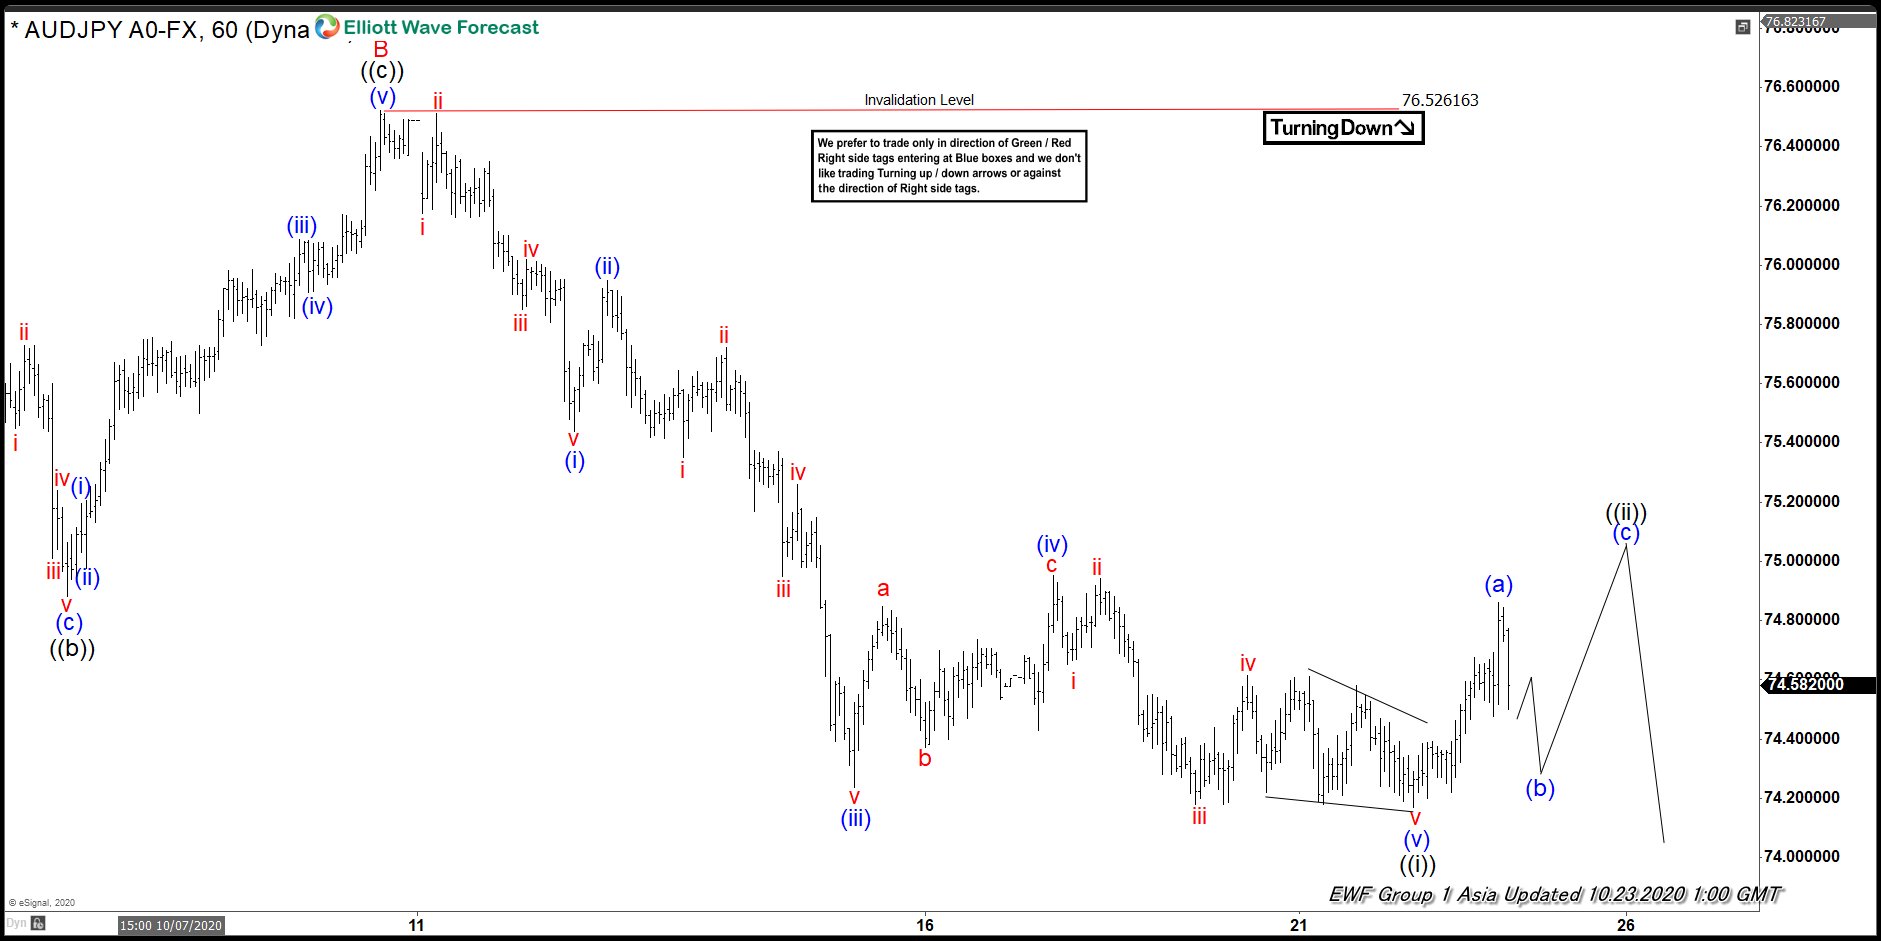
AUDJPY 1 Hour Elliott Wave Analysis 10.23.2020
Chart below shows wave B completed at 76.52, down from there wave (i) completed at 75.44, wave (ii) completed at 75.91, wave (iii) completed at 74.23, wave (iv) completed at 74.95 and wave (v) of ((i)) completed at 74.17. This completed an Elliott wave impulse structure and was followed by a bounce to 74.86 which we labelled as wave (a) and expected the pull back to hold above 74.17 low for another push higher to complete wave ((ii)) and then resume the decline.
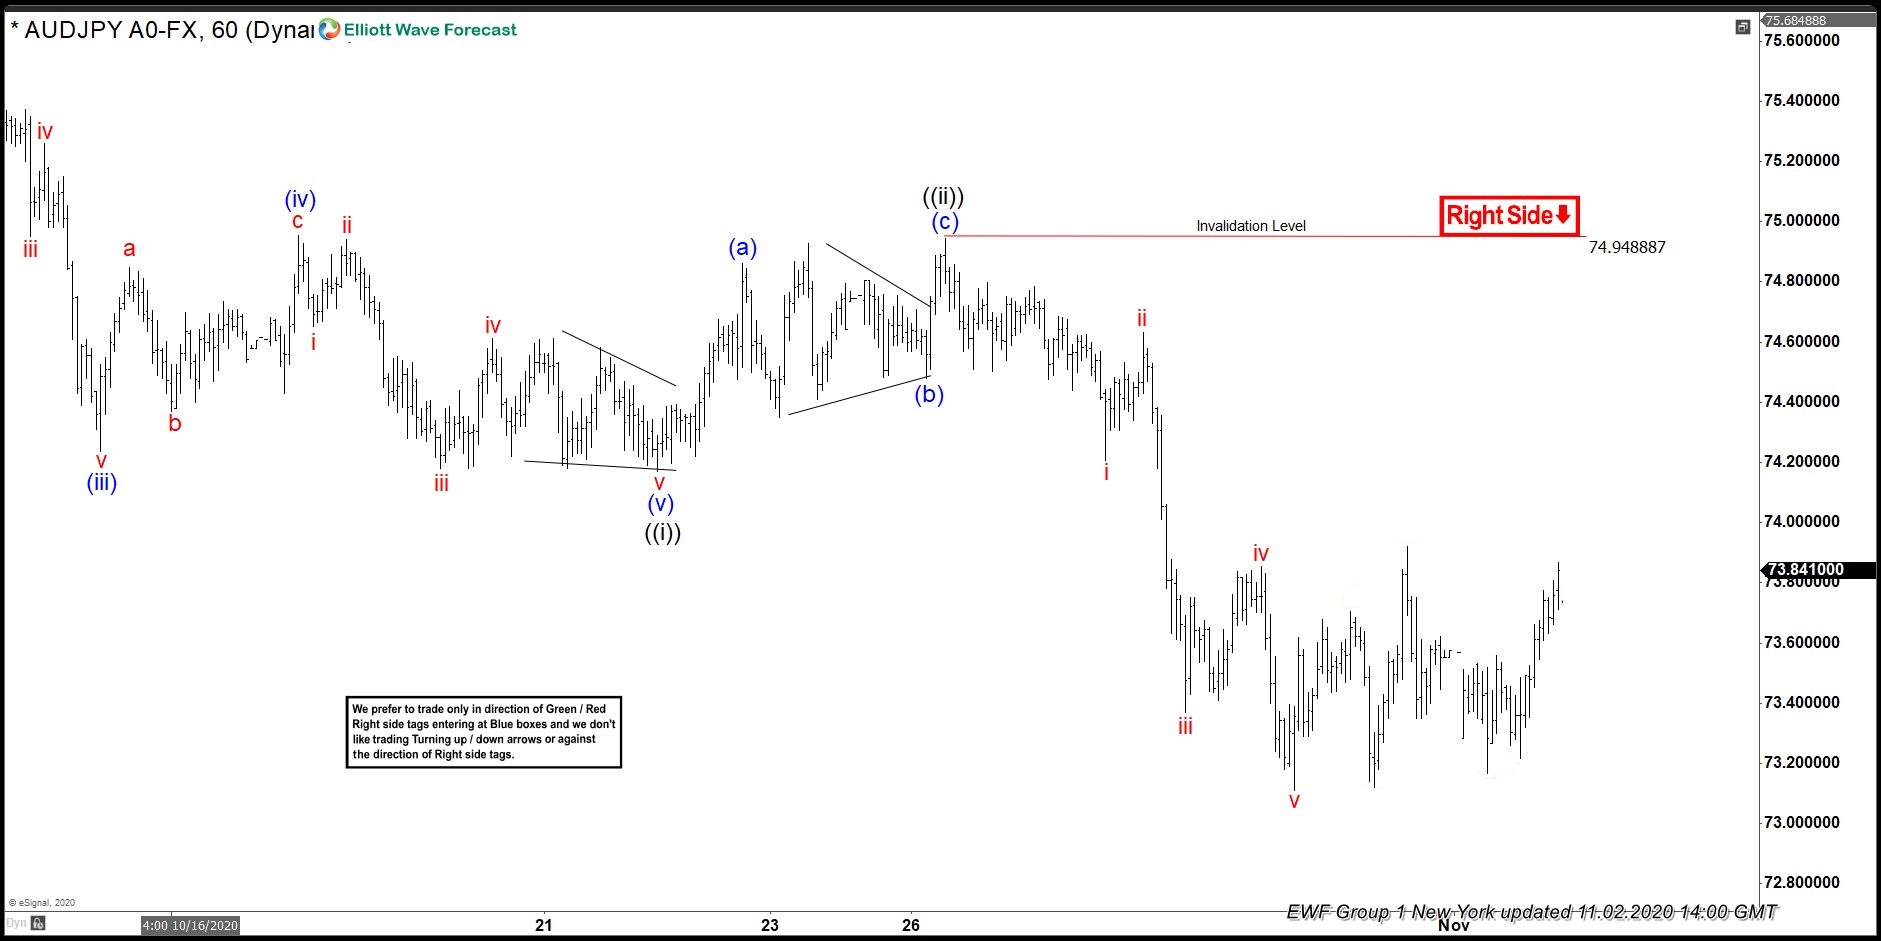
AUDJPY 1 Hour Elliott Wave Analysis 11.02.2020
In the chart below we can see that AUDJPY did make another push higher and completed wave ((ii)) at 74.94. It then resumed the decline and broke below the previous wave ((i)) low in another impulse move within which wave i completed at 74.20, wave ii completed at 74.63, wave iii completed at 73.36, wave iv completed at 73.85 and wave v completed at 73.11. Now, a bounce is expected to take place again and full analysis is available inside members area.
Back


