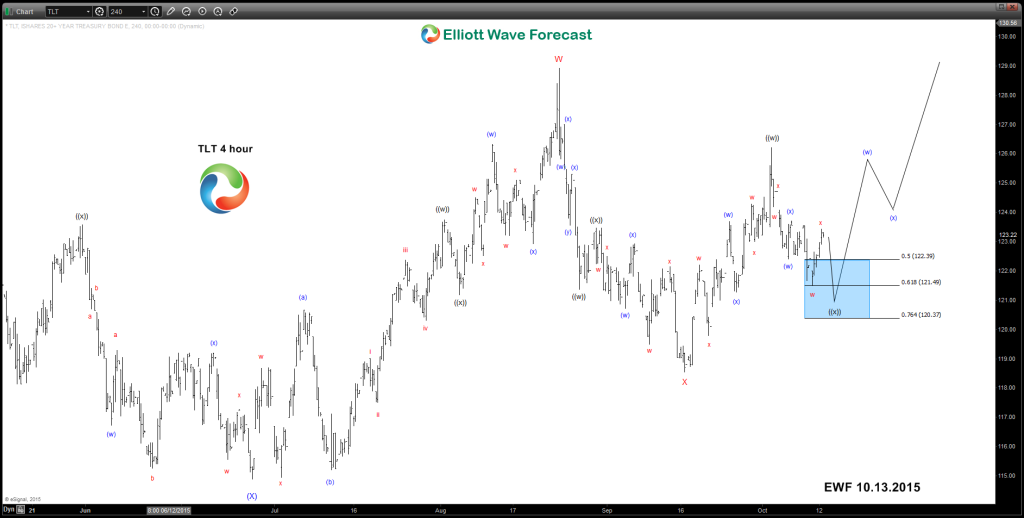
 Since the 26th of June, 2015 the TLT has rallied & continues to appear it will go higher once again while yields go lower. That said and knowing the correlation with yields as well as the maturity of that cycle lower from the 1980’s highs this market is in dangerous territory. It is not clear yet if new highs back above the January 138.50 highs again will be seen but it would technically make sense to. Down from the 138.50 highs were a clear 3 swings into the 6/26/2015 lows at 114.88 which is shown here as a blue wave (X) . Up to the 128.92 wave W highs of August 24th . I think this is the larger trend higher resuming although it does not count well as an impulse it was not expected to be anyway. Down from 128.92 we think this is most likely a “wxy” double three structure and completed a red wave X at 118.55 on the on the 16th of September. While price remains above there during near term dips we would expect a couple more swings higher in Y of (Y) toward the equal legs 1.236 extension of the W-X move that currently projects to come in at the 132.59-135.90 area . Further out in time and afterwards of reaching this area, if the dip lower continues to show it will remain above the aforementioned June 26th lows the TLT will probably swing higher again once more above the January 138.50 highs.
Thanks for looking and feel free to come visit our website and take a trial subscription and see if we can be of help.
Kind regards & good luck trading.
Lewis Jones of the ElliottWave-Forecast.com Team
