
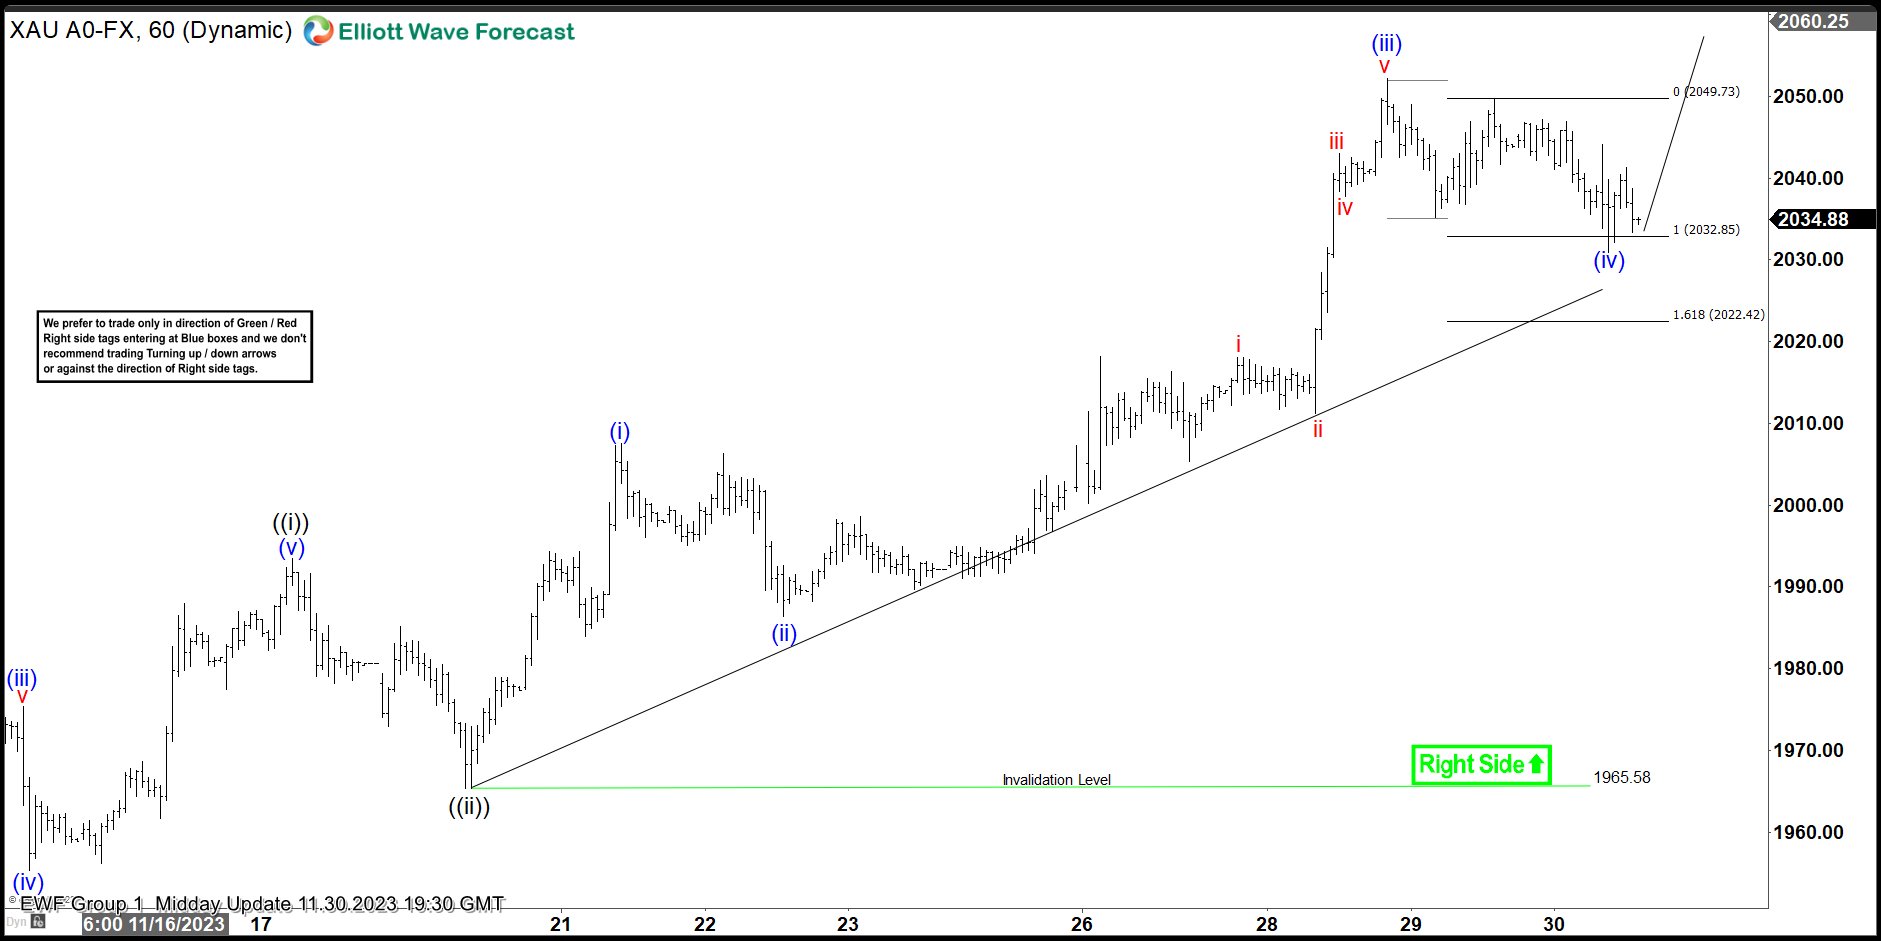
Last year, our live trading room provides 69% return annually across the 3 groups that we cover. In Live Trading Room, we scan the market everyday to find any tradable setup. We believe every serious traders need to have a good trading system with specific rules. A complete system must include the following: 1. Conditions […]
-

$NZDCAD Elliottwave Analysis 5.19.2016
Read MoreThis is a an Elliottwave Analysis video on $NZDCAD. Short term, the pair looks to have ended cycle from 12/29/2015 peak, and pair should be in larger wave (X) bounce to correct the decline from 0.958 before pair turns lower again. Near term target is 0.889 – 0.893 area, then it should pullback in 3 waves before higher […]
-

A Lesson from the Maze
Read MoreHave you ever played a maze when you were a kid? In Hong Kong Disneyland, there’s a maze located at the garden outside the hotel which has a shape of a Mickey Mouse head if seen from a distance above. The height of the bushes is designed so that little children’s sight would be blocked when they go inside […]
-
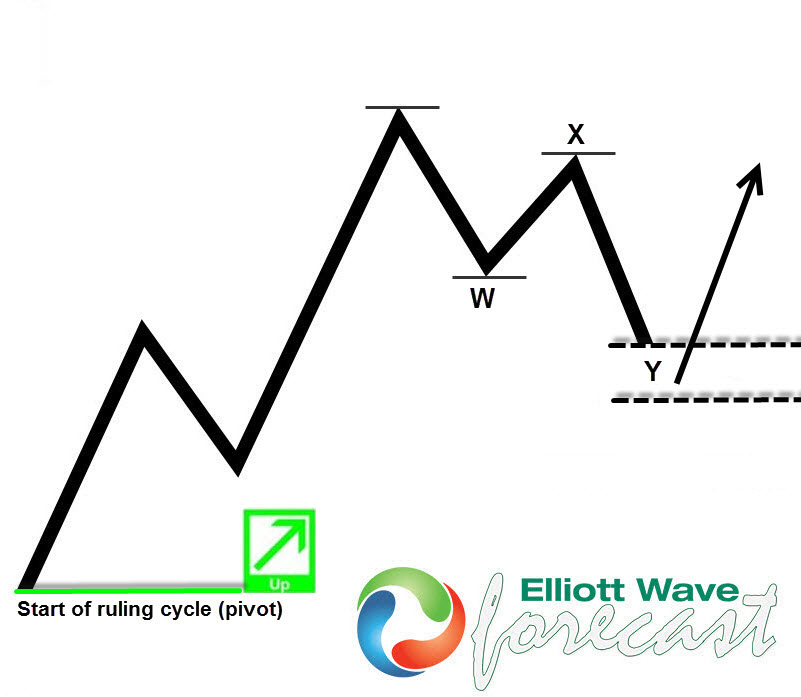
New to Elliott Wave? This is the first thing you should learn
Read MoreHello fellow traders, welcome to Elliott Wave Forecast. In this technical blog we’re going to get through some basic stuff of Elliott Wave Theory in order to help you get started with it. Many of you probably already know that Elliott Wave is the most powerful form of Technical Analysis used to forecast financial market […]
-
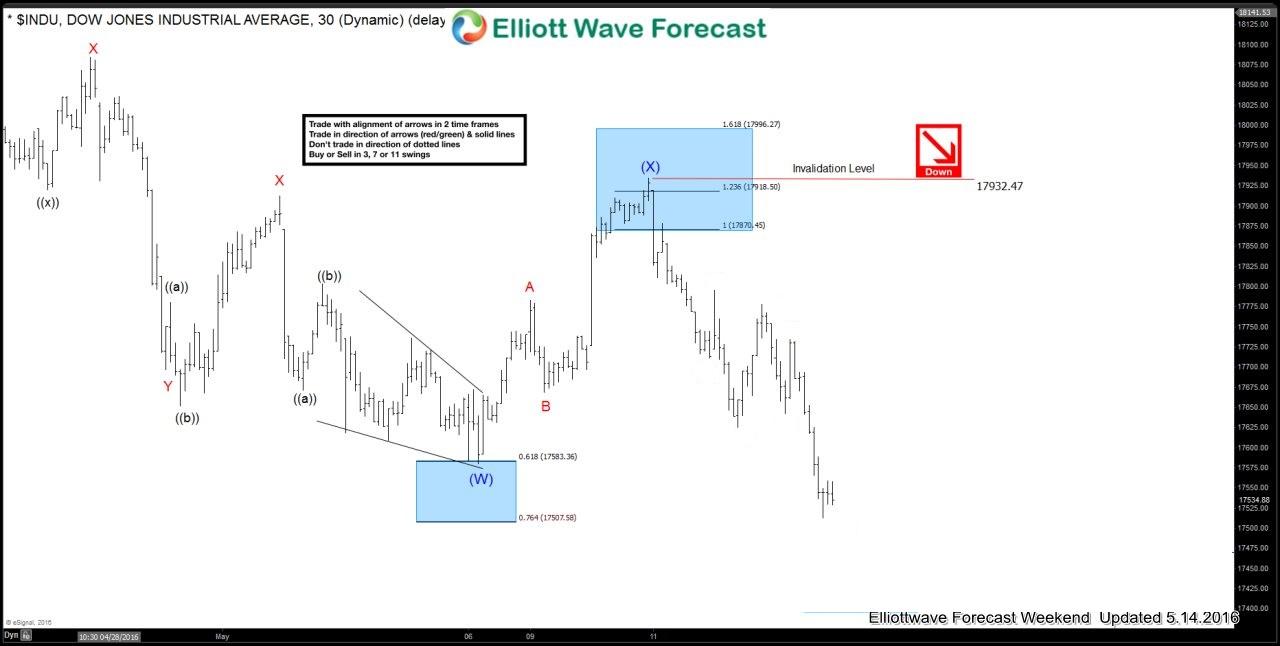
$INDU (Dow) Elliott waves forecasting the decline
Read MoreIn this blog we’re going to take a quick look at Dow 1 Hour chart from 10th May 2016. We can see Index broke the descending trend line from the peak suggest it most likely ended the cycle from 18173.54 high. Move up from 17580.38 to 17783.16 is a 5 wave move and hence we have labelled […]
-

XAUAUD Elliott Wave Update and targets
Read MoreIn February 2016, we published a blog called Gold: Will the rally extend or fail? in which we had a look at Gold cycles against major World currencies and then presented an in-depth Elliott Wave Analysis of XAUAUD (Gold – Australian Dollar) instrument. Our preferred view called for a dip towards 1606 – 1565 area followed […]
-
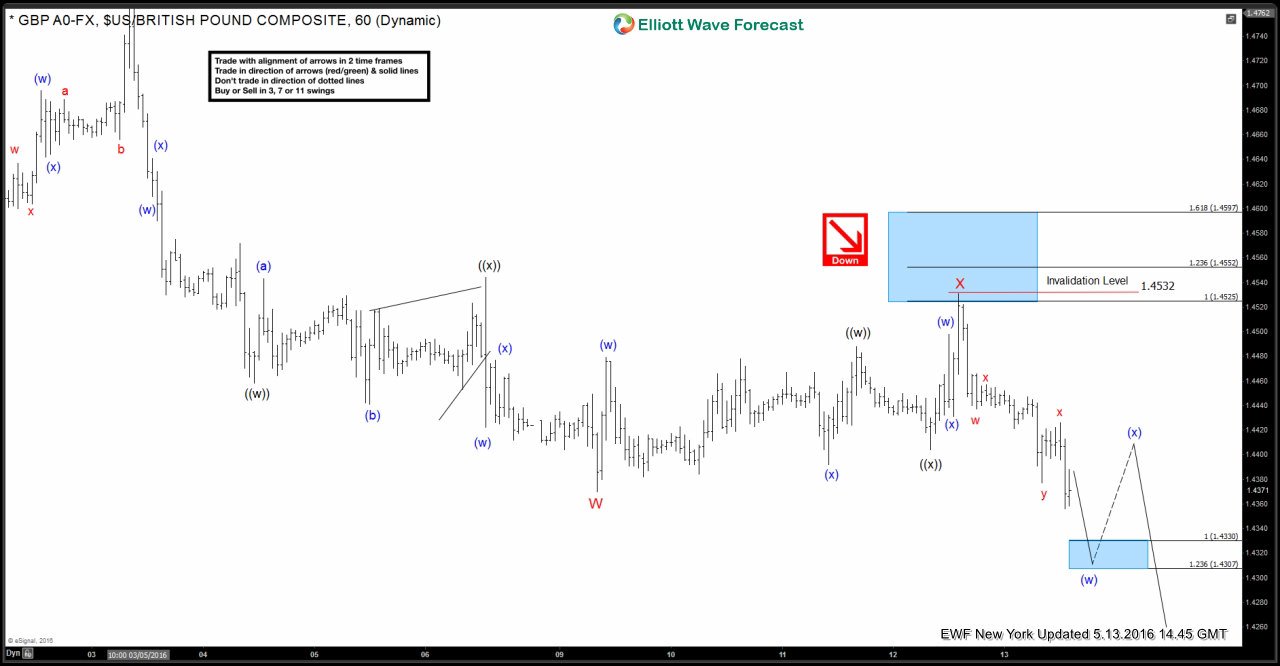
$GBPUSD Live Trading Room – BOE Live Trading
Read MoreHere is a quick blog from our Live Trading Room host, Dan Hussey. Take a look at how to manage your risk by using inflection zones and Elliot Wave to your advantage. The Live Trading Room is held daily at 8:00 AM EST , join Dan there for more insight into these proven methods of trading. Inflection zones […]