
Last year, our live trading room provides 69% return annually across the 3 groups that we cover. In Live Trading Room, we scan the market everyday to find any tradable setup. We believe every serious traders need to have a good trading system with specific rules. A complete system must include the following: 1. Conditions […]
-
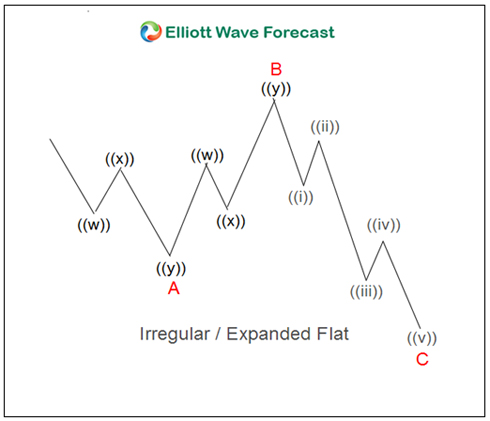
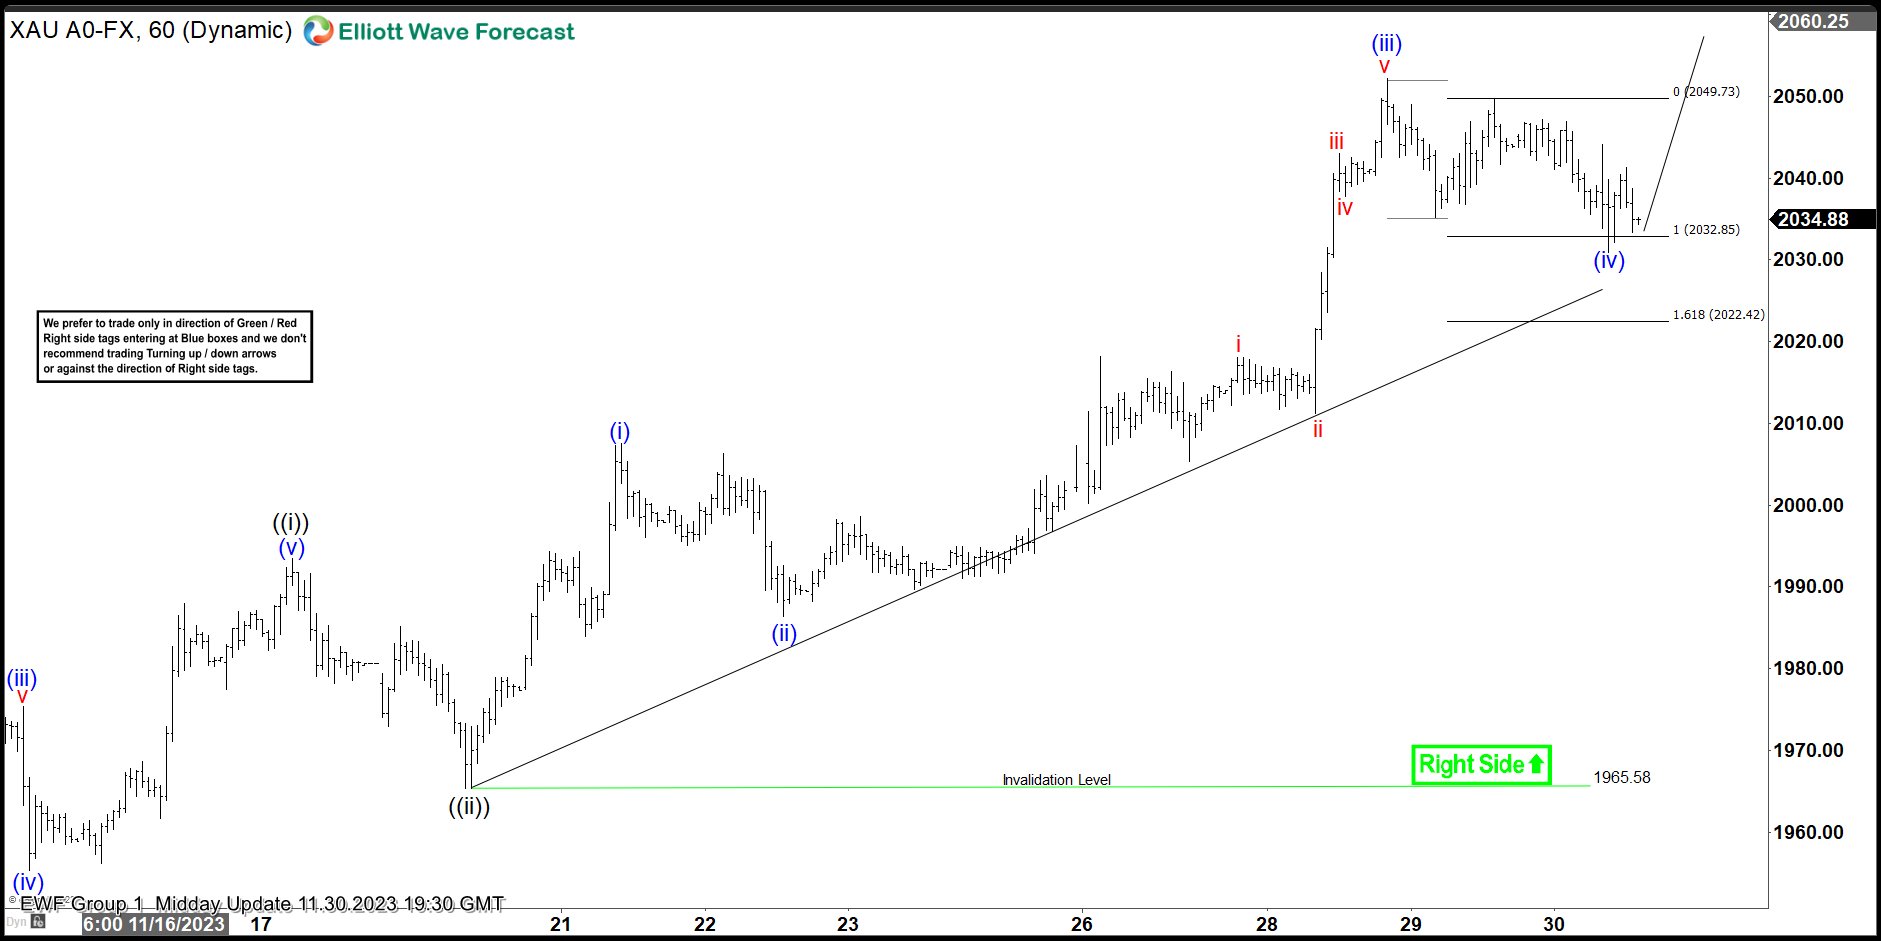
How to Measure Fibonacci Extensions in Elliott Wave Flat Corrections
Read MoreHow to Measure Fibonacci Extensions in Elliott Wave Flat Corrections In the first place the point of measuring a Fibonacci extension is to get the area pinpointed that an Elliott Wave correction will move against the trend. The conventional thought is that the market will trend in impulses of 5, 9, & 13 swings. The […]
-
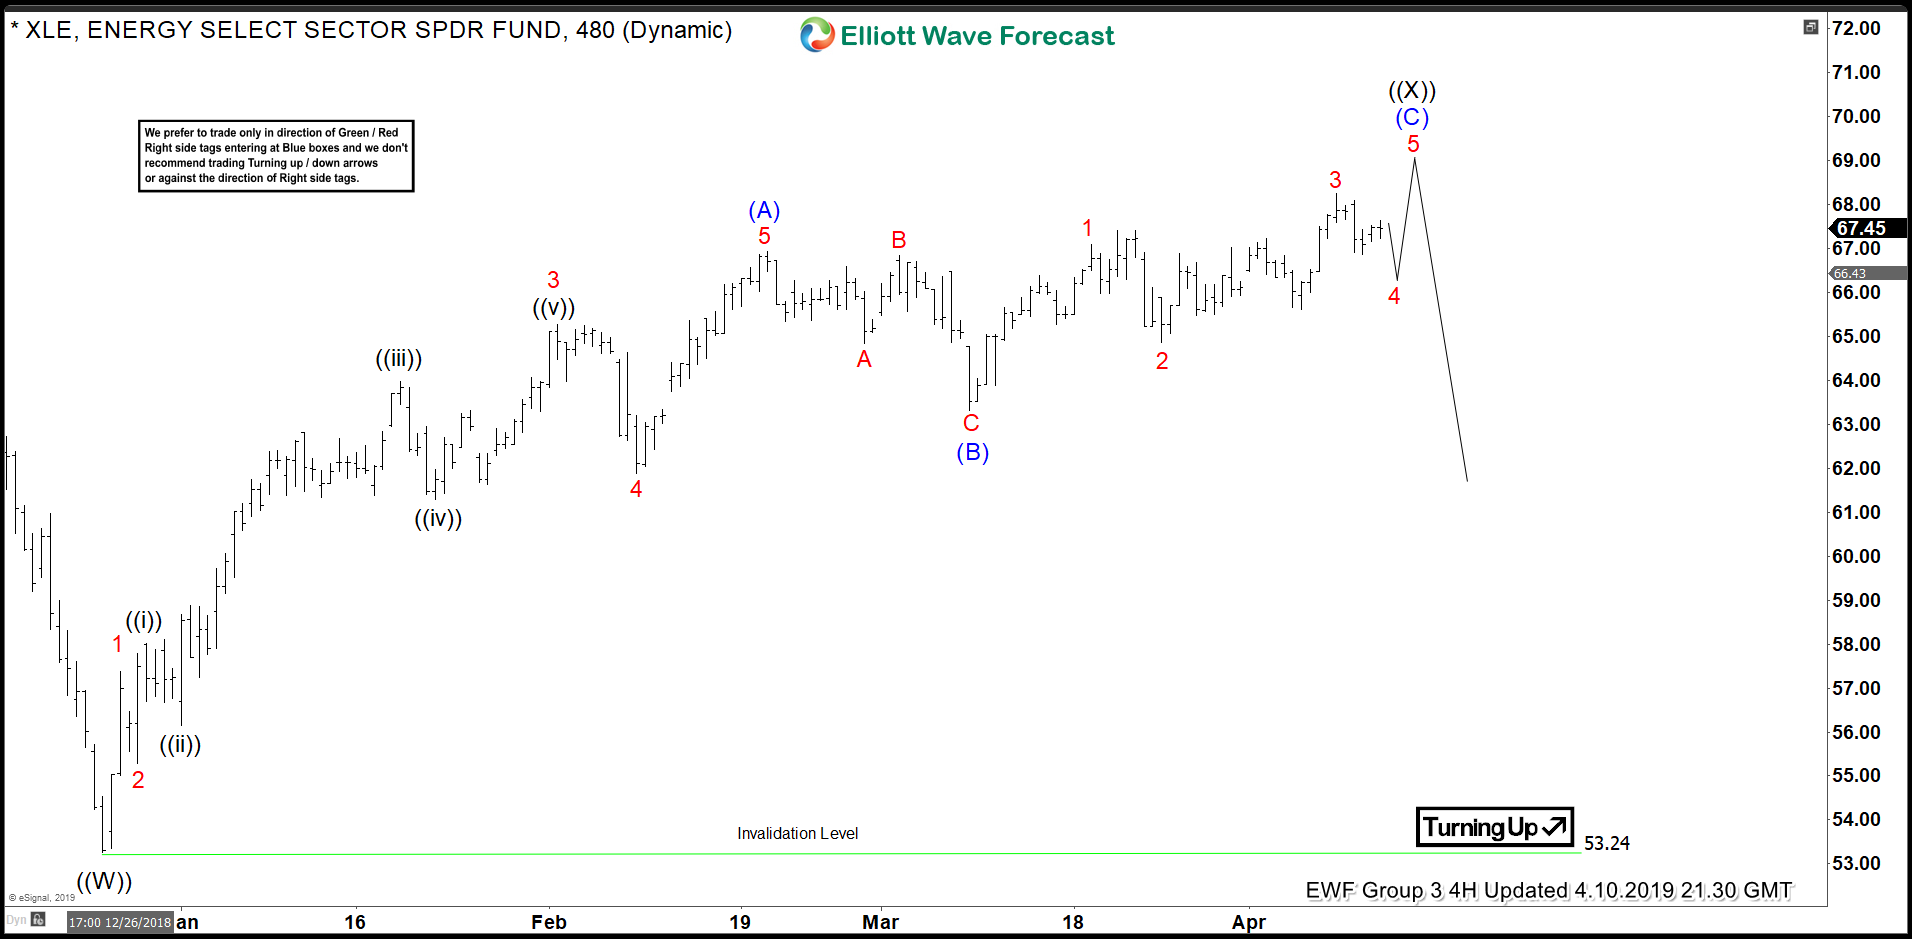
Elliott Wave Structure Suggests XLE Topping Soon
Read MoreXLE Topping Soon Taking a look at the recent Elliott wave structure in XLE suggests a top may be near. Starting from the 12/24/18 low at $53.25 the energy ETF shows a 5 wave impulse in wave (A) to $66.93 on 2/20/19. From there we count a 3 wave correction to the (B) wave low […]
-
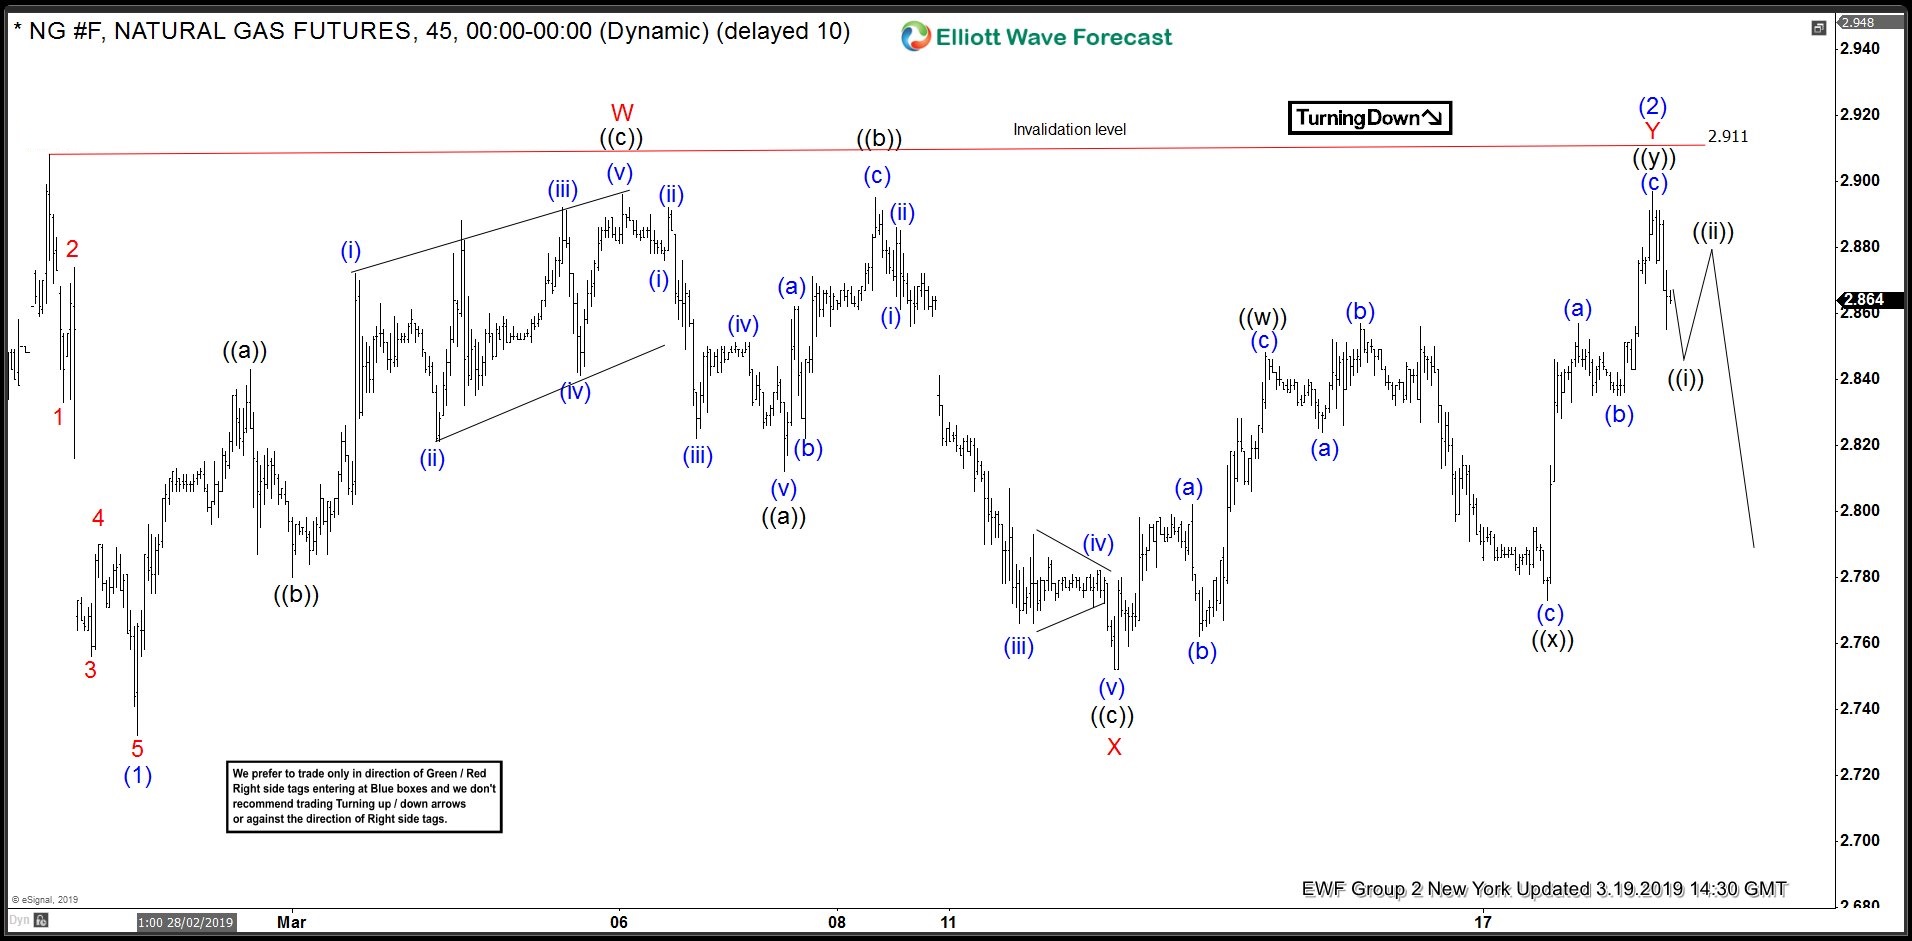
Natural Gas ( NG #F) Calling The Decline After Double Three Pattern
Read MoreHello fellow traders. In this technical blog we’re going to take a quick look at the charts of Natural Gas published in members area of the website. As our members know, we were calling February cycle completed at the 2.911 peak. The Futures made very sideways recovery against the mentioned peak, that unfolded as Elliott […]
-
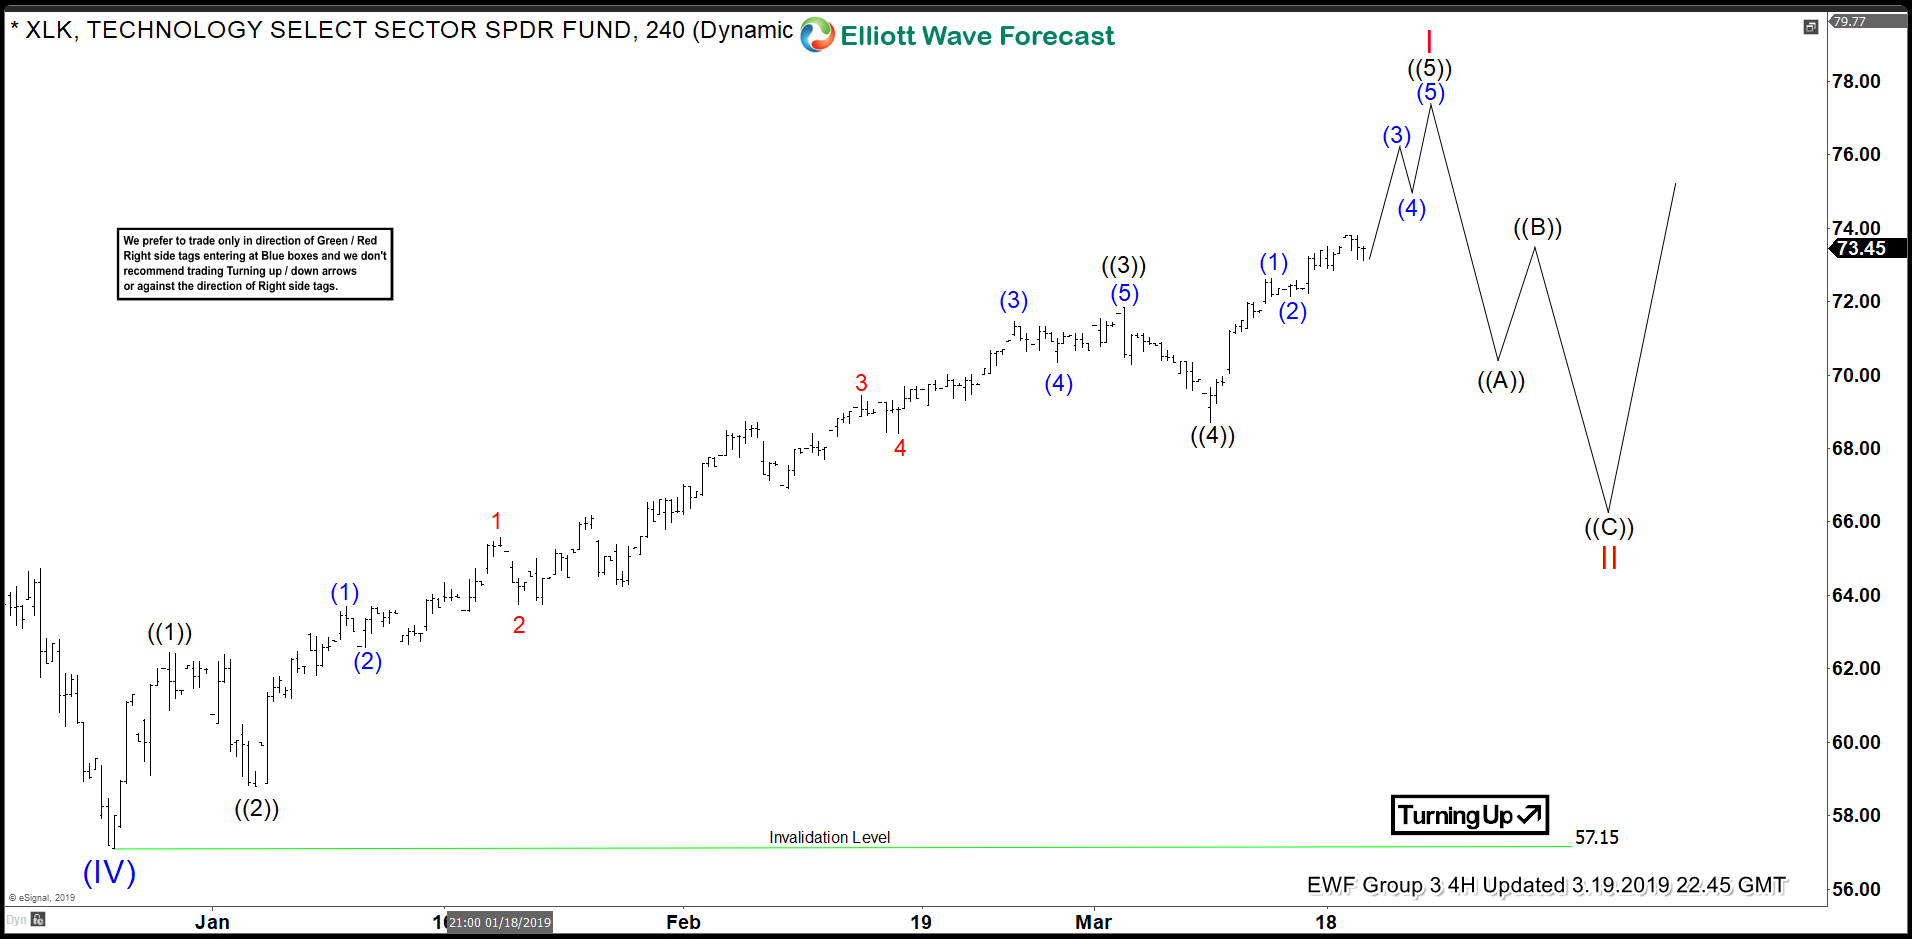
Elliott Waves from December Low Suggests XLK to Make New Highs
Read MoreXLK Pattern Suggests New Highs on the Horizon After a 24.5%, 7-wave, decline from the $76.27 peak of 10/3/2018, XLK appears to be showing signs of a bottom. This technology ETF, XLK, is now showing a clear 5 wave impulse from the 12/24/2018 lows which we are labeling as Super Cycle degree wave (IV). The […]
-
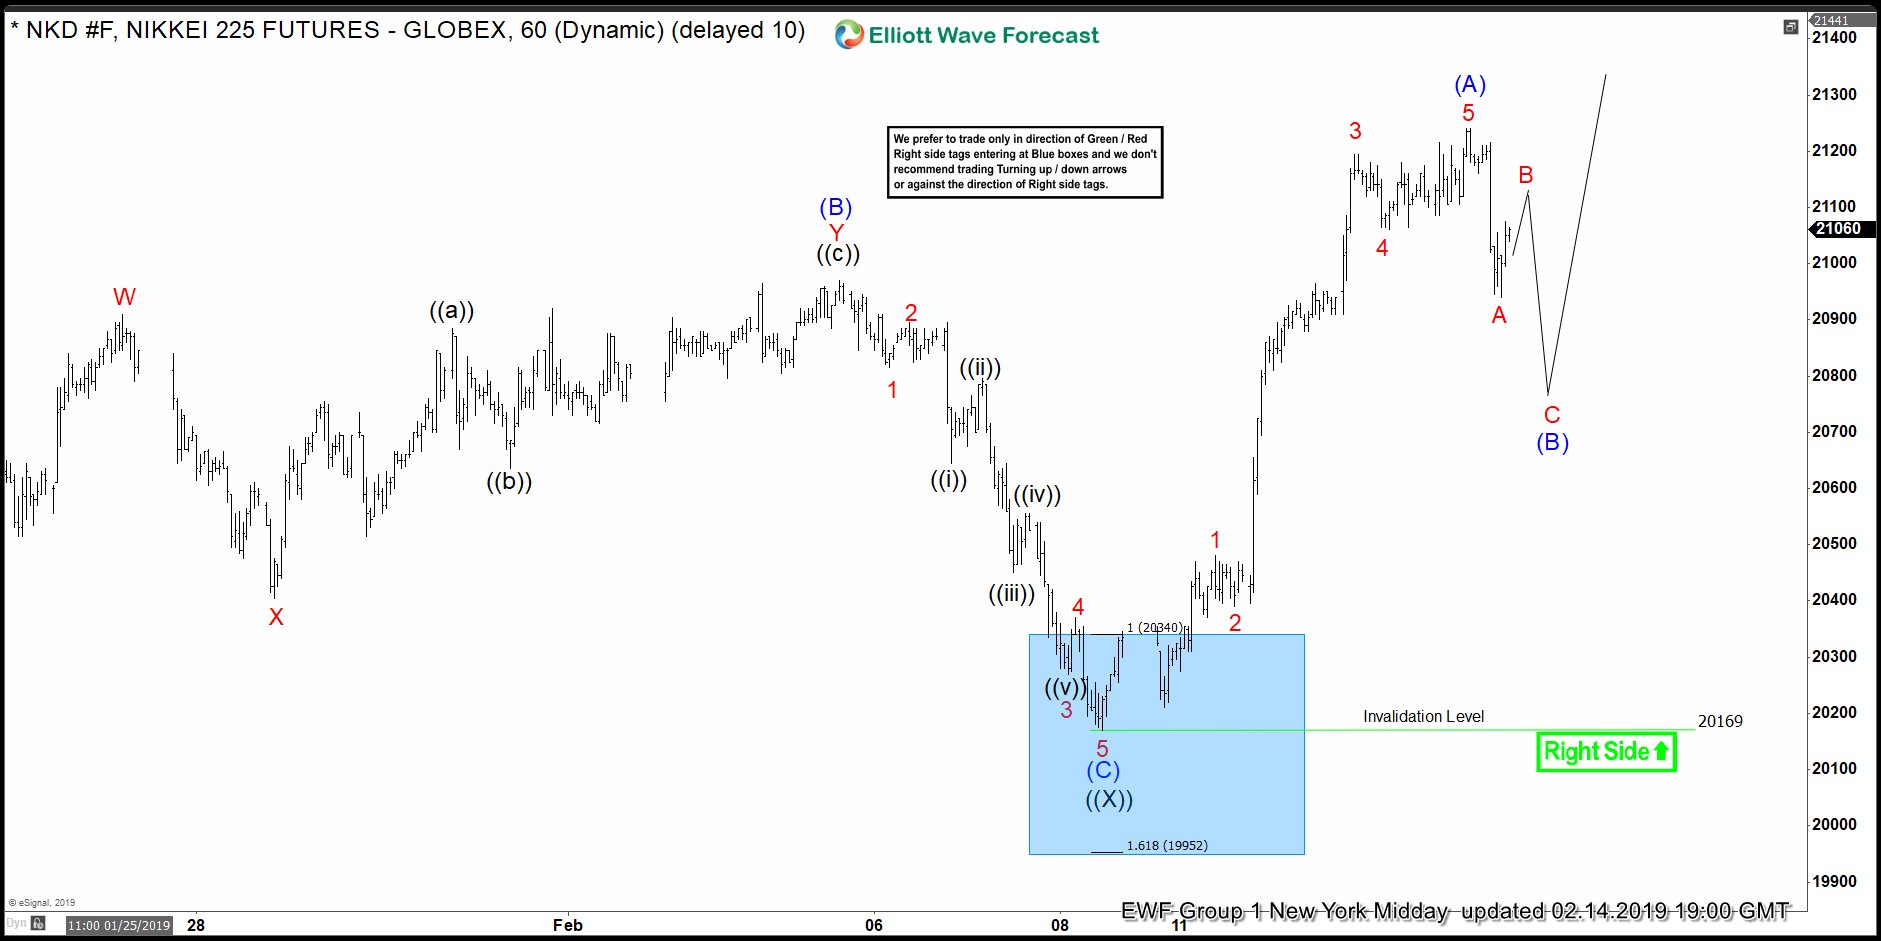
Nikkei Elliott Wave Zigzag Pattern Within February Cycle
Read MoreHello fellow traders. In this technical blog we’re going to take a quick look at the Elliott Wave charts of NIKKEI . Break of February 5th peak has made the cycle from the 12.26 low incomplete to the upside. The price structure is calling for more strength toward 22214-23476 area. At this stage short term cycle […]
-
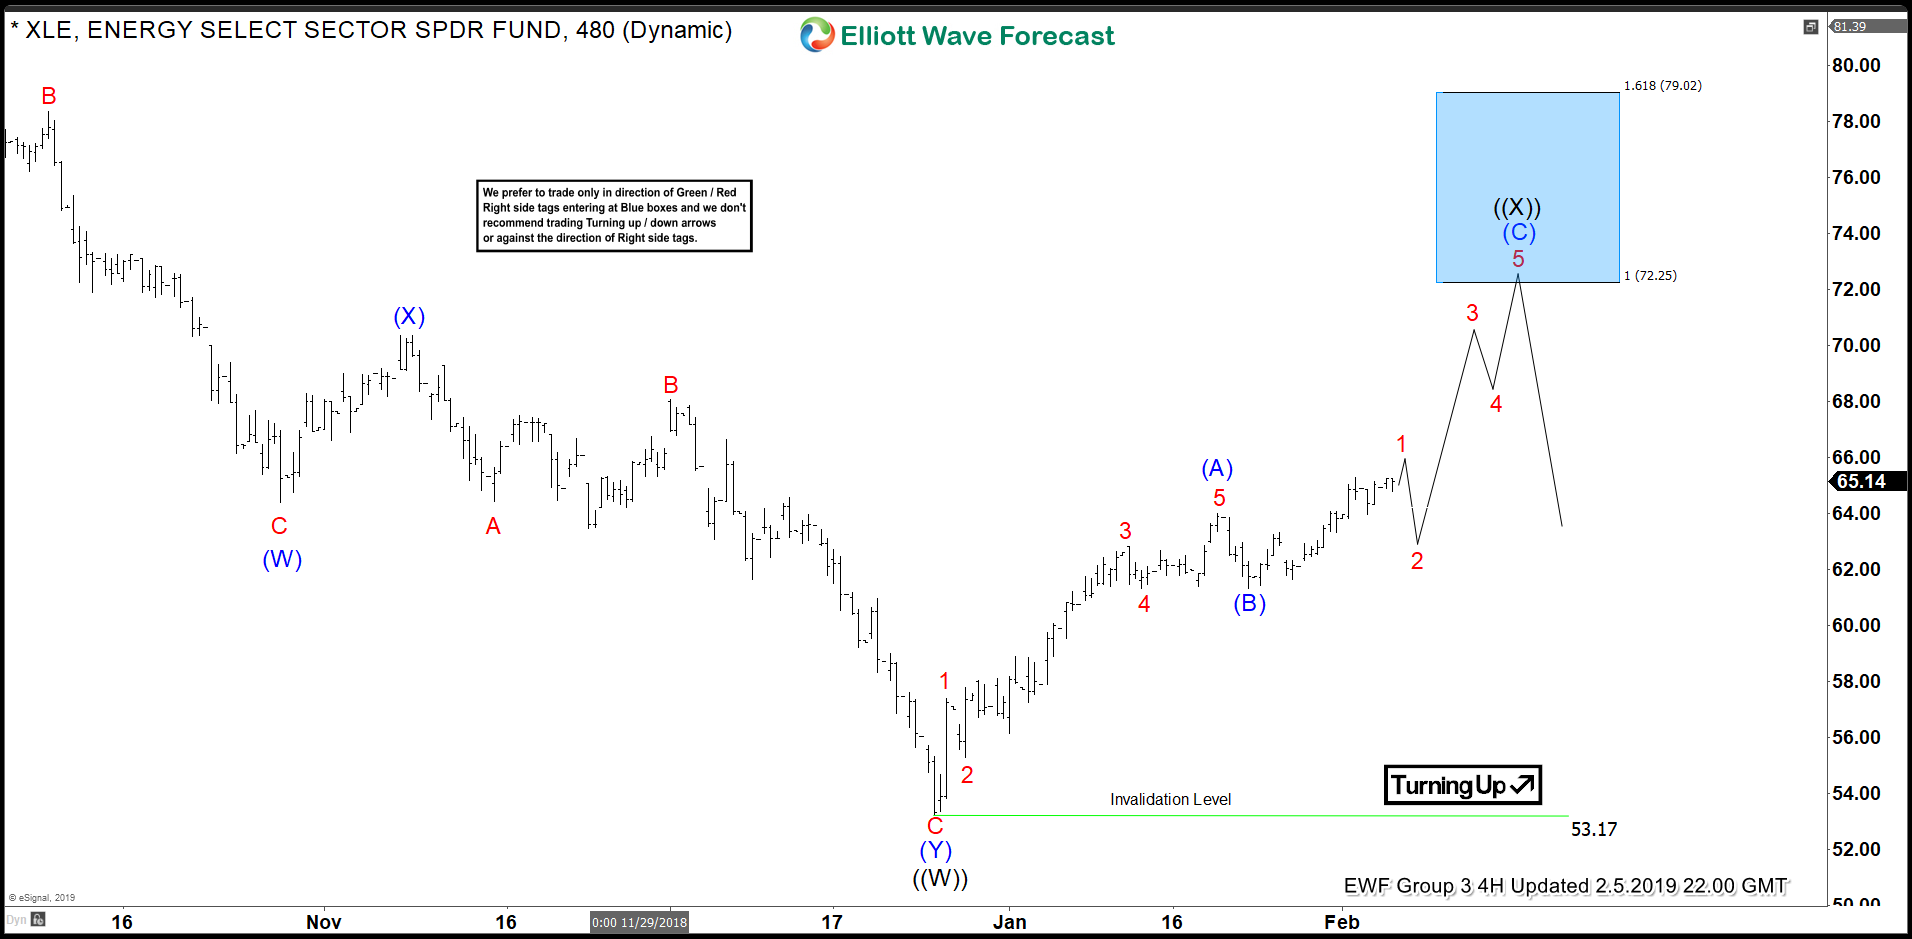
Energy Stocks of XLE Remain Bullish in the Near Term
Read MoreThe Energy Sector ETF, XLE, remains bullish in the near term. From the lows of $53.25 on 12/24/2018 we are charting a zigzag Elliott wave pattern. The target to the upside is $72.25 while the $61.30 low of 1/23/2019 holds. The Model of the Elliott Wave Pattern ZigZag patterns always subdivide into three waves. […]