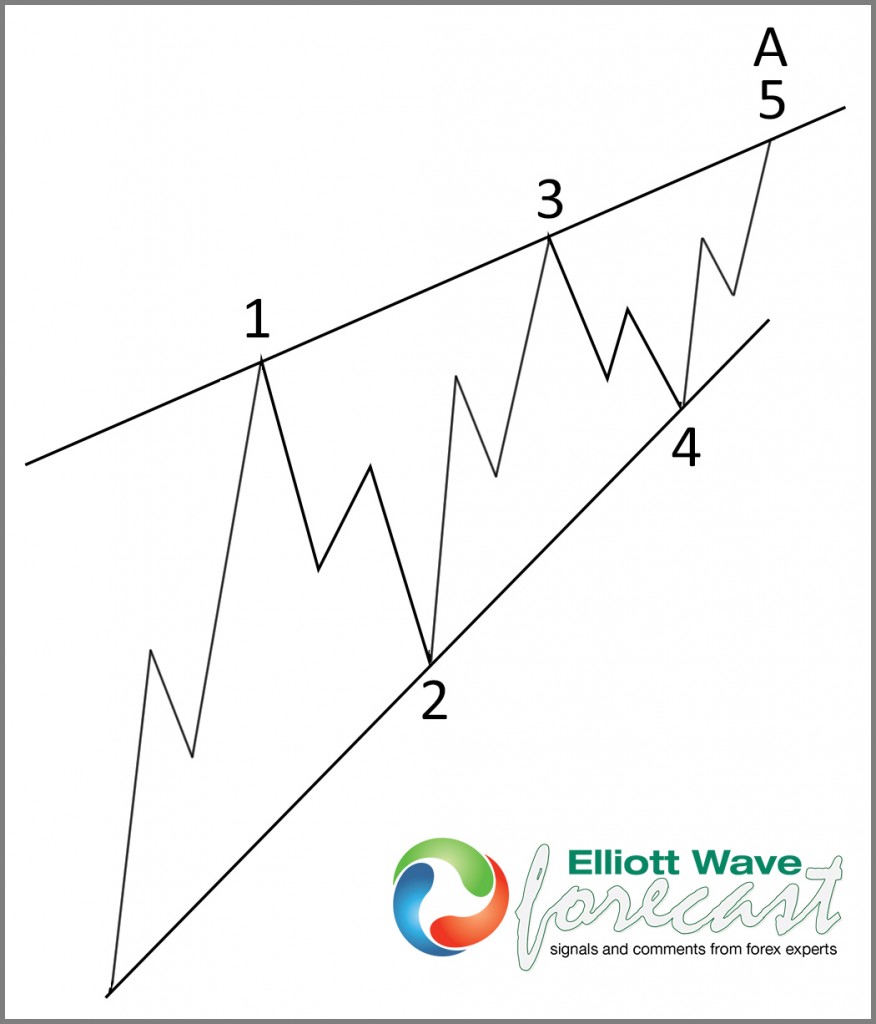
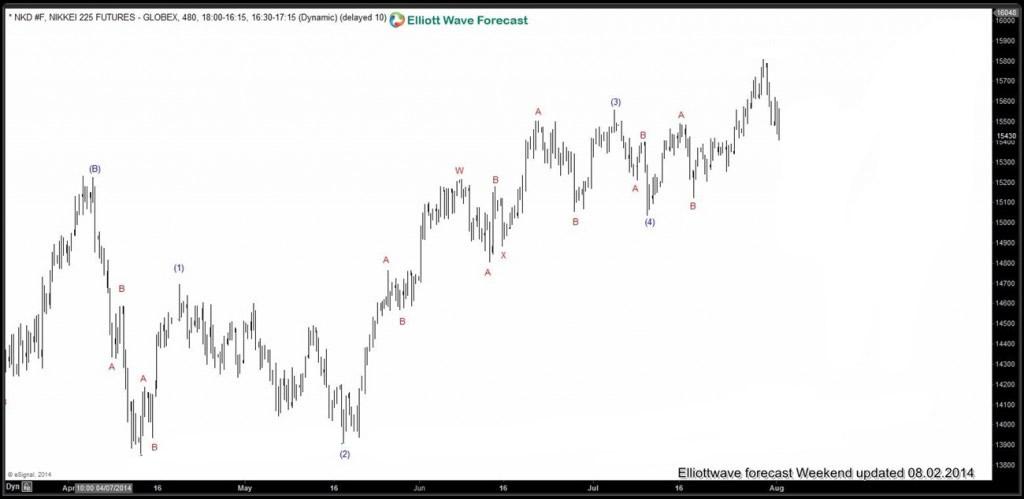
Nikkei has been rallying since April 2014′s low of 13800 in a diagonal. Diagonal is a five swing move with the convergence of boundary lines into a wedge shape. The subdivisions can be either 5-3-5-3-5 or 3-3-3-3-3. Ending Diagonals consist of 3-3-3-3-3 whereas Leading Diagonals can be either 5-3-5-3-5 or 3-3-3-3-3. In the case study below, we would be looking at a diagonal with sub-divisions of 3-3-3-3-3
Let’s take a look at the general structure of a leading diagonal below
Now let’s take a look at Nikkei’s 4 hour chart below
Wave 1 is complete at 14,643.
Wave 2 is complete at 13,889
Wave 3 is complete at 15,200
Wave 4 is complete at 14,843
Wave 5 is complete at 15,780
In each wave, the subdivision is in 3 waves as shown on the chart. We’ve warned our members everyday through our live session and 24 hour chatroom that global indices are close to forming a temporary top. Nikkei has followed our path, and start to correct the 5 wave moves.
I hope that you find the information in this blog helpful. Thank you for reading and if you would like to know more about us and how we can help you, I invite you to join our FREE summer promotion 14 day Trial. We have 24 hour coverage of 26 instruments from Monday – Friday. We provide Elliott Wave chart in 4 different time frames, four times update of 1 hour chart throughout the day, two live sessions by our expert analysts, 24 hour chat room moderated by our expert analysts, market overview, and much more! With our expert team at your side to provide you with all the timely and accurate analysis, you will never be left in the dark and you can concentrate more on the actual trading and making profits.
Kind regards,
Hendra Lau – Technical Analyst at Elliott Wave Forecast
Back


