One of the common challenges to practitioners of Elliott Wave principle is that the technique is subjective. There’s a saying that if you put 10 different Ellioticians together in the same room, they will all come up with a different Elliott Wave count. During our 20 years of experience with Elliott Wave Theory, we find out there’s some truth in this saying. The good news is we have been able to find ways to reduce the subjectivity of Elliott Wave labelling by improving the correlation between wave patterns and market context, thus increasing the accuracy of our forecast.
Innovative Approaches to Elliott Wave Analysis
Our company is known as an innovator in the field of Elliott Wave study. We successfully improved the subjectivitiy of Elliott Wave labeling by utilizing various technical tools, including RSI, CCI, our proprietary pivot system, and market correlation.
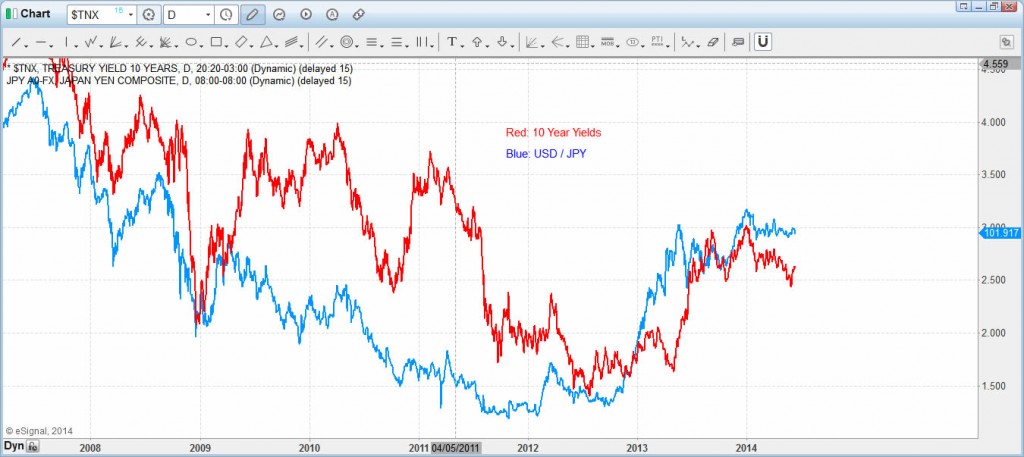
In this blog, I want to show how we use market correlation and RSI study to help us find the right Elliott Wave count for Ten Year Yields (TNX) and USD/JPY. First, let’s take a look at the correlation chart between TNX and USD/JPY below:
Strong positive correlation between TNX and USD/JPY demonstrated through historical price action
The Contrarian Technique in Market Analysis
From the chart above, there should be no doubt that these two instruments have positive correlation. One of the techniques we use at Elliott Wave Forecast is to look at the overall market and find the contrarian, that is an instrument with the clearest structure. Sometimes a particular instrument doesn’t show a clear structure and this makes it difficult to be labelled. We use the technique of finding the contrarian and we use market correlation to apply the structure of the contrarian to another correlated instrument that doesn’t have a clear structure.
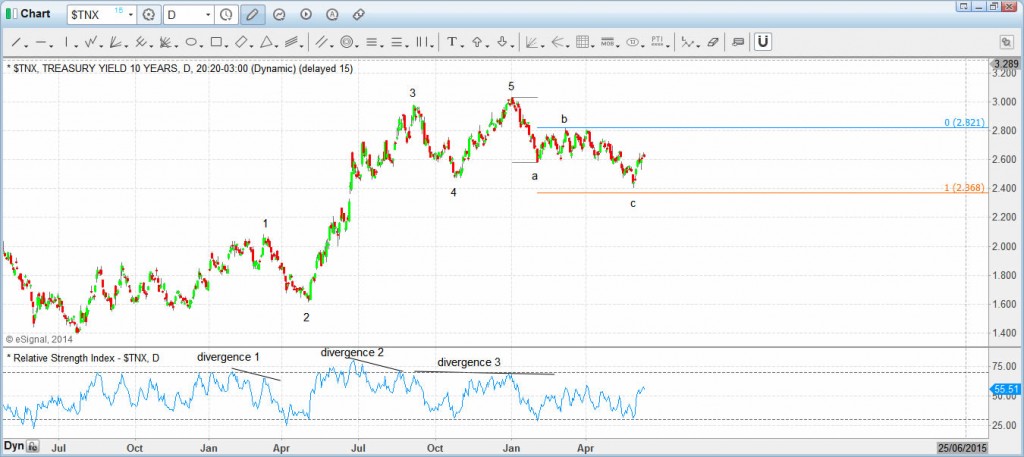
Let’s now take a look at the structure of both instruments more closely. Below is a daily chart of TNX and I will show how we label the Elliott Wave count with the help of RSI.
TNX daily chart showing five impulsive waves confirmed by RSI divergence patterns
TNX Wave Analysis with RSI Confirmation
From the start of the rally in the middle of 2012, we count five impulsive waves in TNX. In addition to the old rules of Elliott Wave about impulsive waves, we use RSI study to confirm that this is indeed five impulsive waves. In impulsive waves, we should find three RSI divergence: In wave (v) of 1, in wave (v) of 3, and in wave 5. We can see all this divergence from the chart above which confirms that TNX indeed has five impulsive waves from the low to the peak. Since the beginning of 2014, we also see TNX drops in a classic abc correction structure. Wave c of this correction hits equal leg of wave a recently, which gives us the confidence that TNX is ready to either resume the rally to a new high or at least rally higher in three waves to 50% retracement of the high.
USD/JPY Elliott Wave Count Analysis
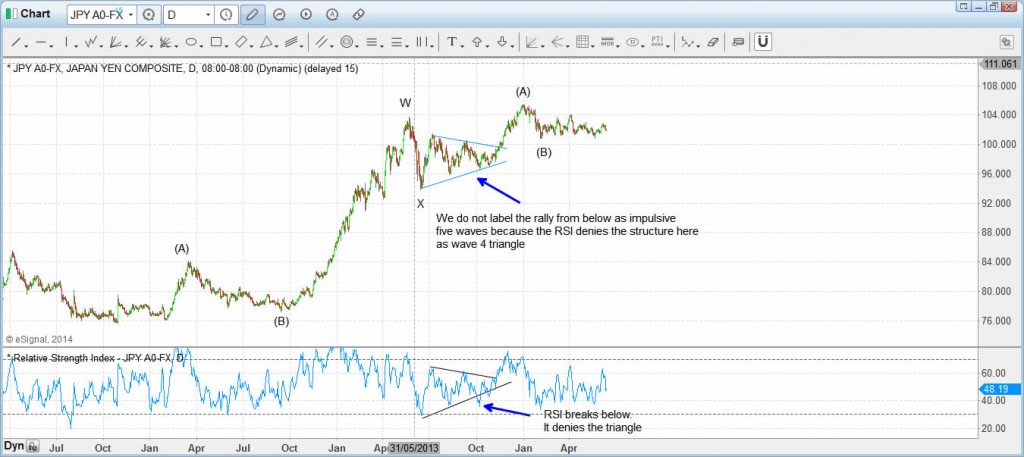
Next let’s take a look at the daily chart of USD/JPY below and see how we use the RSI study to label Elliott Wave count:
USD/JPY daily chart showing our unique double three interpretation versus conventional five-wave count
Almost every Ellioticians that we know label USD/JPY rally from the low as five impulsive waves. A lot of wavers also believe that following a terminal thrust from triangle wave 4 (as shown with the arrow above), USD/JPY will retrace most of the gains. However, we at Elliott Wave Forecast don’t fall into this trap. As we look at the RSI, we know that the consolidation above is not a triangle because the RSI makes a new low. We label the rally in USD/JPY as a double three. Since early 2014, USD/JPY has been consolidating and it has been very difficult to label that consolidation. Many Ellioticians who expect a big correction after wave 5 peak still call for a big retracement in USD/JPY.
Applying Correlation Techniques to Current Market Conditions
It’s not easy to label the consolidation in USD/JPY since early 2014. However, using market correlation technique, we know that TNX has already hit the equal leg and ready to do some sort of rally. Thus even though it’s possible for USD/JPY to have ended the cycle from 2012, we are expecting a bounce in USD/JPY either by holding 100.79 low or from 99.5 (equal leg from 105.44). Our primary count of USD/JPY thus still shows further upside for the pair to complete the double three structure.
Expand Your Trading Knowledge with EWF
If you enjoy this article, feel free to read other technical articles at our Technical Blogs, check Chart of The Day, or join our 14 days free trial. We have 24 hour coverage of 26 instruments from Monday – Friday. We provide Elliott Wave chart in 4 different time frames, four times update of 1 hour chart throughout the day, two live sessions by our expert analysts, 24 hour chat room moderated by our expert analysts, market overview, and much more! With our expert team at your side to provide you with all the timely and accurate analysis, you will never be left in the dark and you can concentrate more on the actual trading and making profits.
Back


