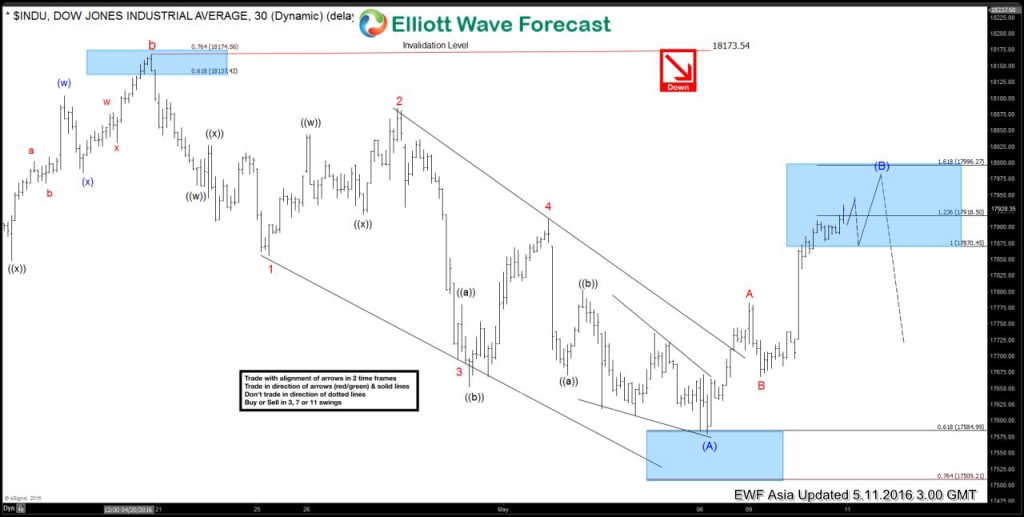
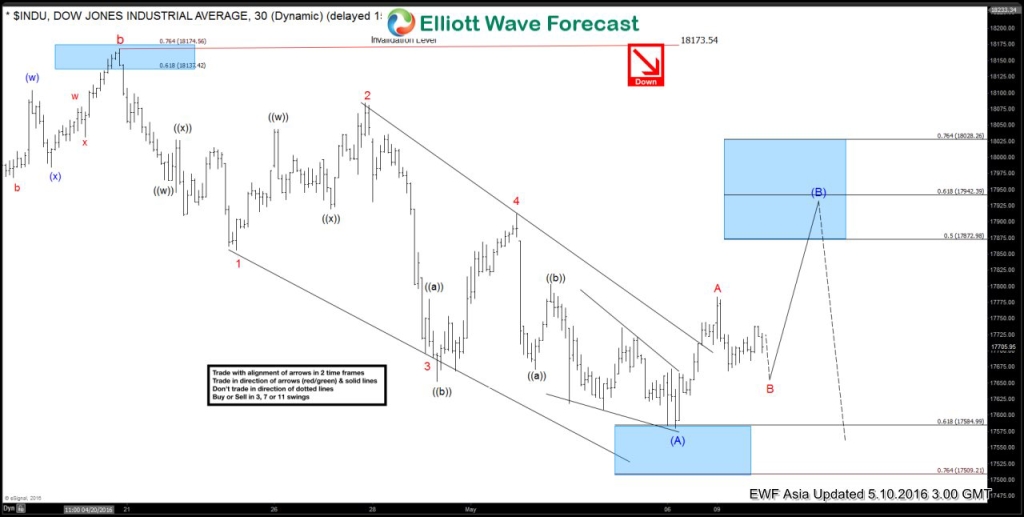
In this blog we’re going to take a quick look at Dow 1 Hour chart from 10th May 2016. We can see Index broke the descending trend line from the peak suggest it most likely ended the cycle from 18173.54 high. Move up from 17580.38 to 17783.16 is a 5 wave move and hence we have labelled it as wave A. Elliott wave theory states that after a 5 wave move (unless 5 waves complete wave C of a FLAT structure), there should be a 3 wave pull back and another 5 wave move in the same direction. Therefore, we called for a pull back in wave B and another rally in wave C to complete a 3 wave bounce from 17580.38 low.
Here’s the 1 hour Asia updated chart of May 11th which shows Index made a 3 wave pull back (wave B as expected) and rallied again in 5 waves to complete 3 waves up from 17580.38 low (zig-zag structure) and then it was expected to turn lower again in line with the higher time frame wave count.
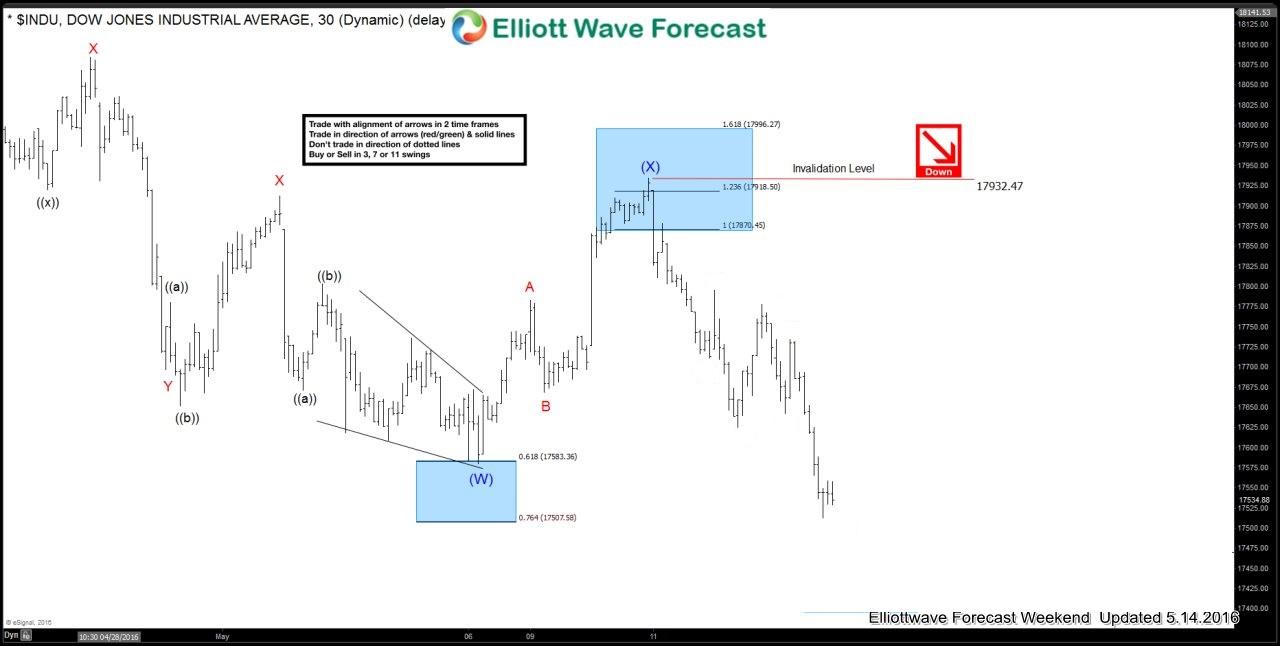
 Below is the 1 hour chart from last weekend update and shows Index has already broken below 17580.38 low.
Proper Elliott Wave counting is crucial in order to be a successful trader. If you want to learn more on how to implement Elliott Wave Theory in your trading and to learn more about next trading opportunities in the Market, try us free for 14 days. You will get access to Professional Elliott Wave analysis in 4 different time frames, Daily Elliott Wave Setup Videos ,Live Trading Room and 2 live Analysis Session done by our Expert Analysts every day, 24 hour chat room support, market overview, weekly technical videos and much more. If you are not member yet, use this opportunity and sign up now to get your (free trial).
Back


