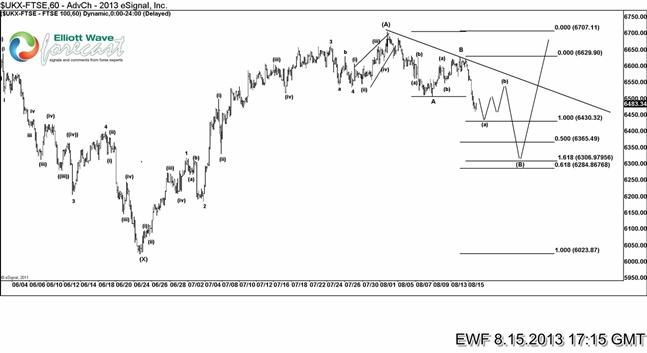
It’s time to revisit $FTSE chart as we last looked at it on 8.1.2013 and establish that bulls had regain control as Index showed a 5 wave move up following a 5 wave decline which is a bullish setup. We expected Index to find resistance around 6743 and turn lower in 3 waves to complete a 5-5-3 bullish setup. Index formed a peak @ 6707 on the day our last article was published and started turning lower.
We can see initial decline from 6707 – 6507 was a clear 3 wave move which was followed by a 3 wave pull back to 61.8 fib retracement (6629). Resistance here proved to be strong and Index has already broken to new lows below 6507 which confirms our primary view that wave B is in place. Since wave A was a 3 wave move, we are looking for a 3 wave decline from wave B peak (6629). Decline from 6629 appears impulsive but still in need of another swing lower. C = A target comes @ 6430 and could provide support for completion of wave ( a ) and a bounce in wave ( b ). As that bounce fails below descending 1 hour trend line (shown on chart), expect another round of weakness to take prices lower toward 6365 (50 fib), 6306 (C = 1.618 x A) and 6284 (61.8 fib). We expect Index to find buyers in this region and resume the rally for new highs above 6707 peak.
If wave ( a ) indeed becomes a 5 wave decline, wave ( b ) pull back would offer a shorting opportunity for short-term traders but our strategy remains to establish long positions in the above mentioned zone as Index shows 7 swings down.
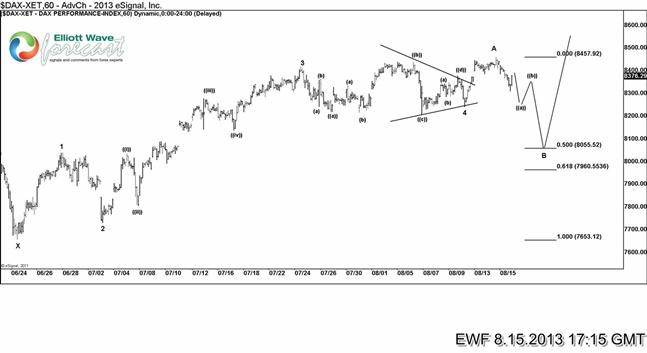
We will also talk about $DAX in today’s article which made a new high while $FTSE was in wave B pull back and we believe the new high came as a triangle thrust and this Index is also showing a 5 wave move up from 7653 low market on the chart. Ideal corrective target is 50 fib (8055) but it remains to be seen whether Index would get this deep in the correction as it is lagging behind FTSE even in the current drop. We don’t like selling the Index into wave B pull back and just like $FTSE our strategy remains to establish long positions in the inflection zone i.e 50 – 61.8 fib (7960 – 8055). Throw $IBEX into the mix and we would get to the same conclusion that 3 waves down from the recent peaks should prove corrective and result in more upside in the European Indices.
If you would like to see our mid-term view in these and other instruments, why not Sign up for 14 day Trial We cover 25 instruments in 4 different time frames working round the clock to provide you with frequent & timely updates and to keep you on right side of the market.
If you are interested in learning more about Elliott wave structures and sequence of waves / swings why not check out and register for up coming webinar on this topic. See the details here
Back


