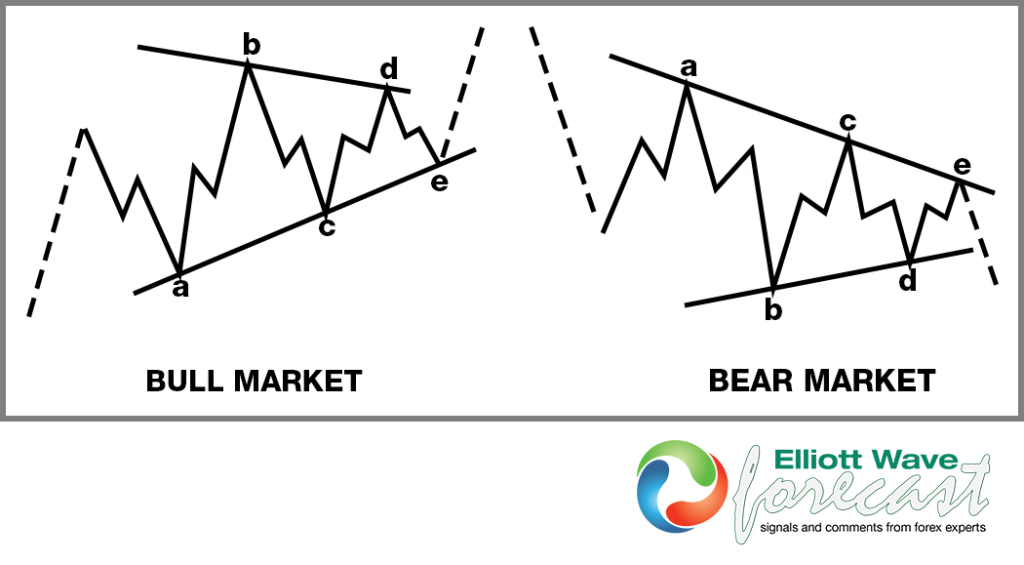
Elliott Wave Theory Structure : A Running Triangle
Triangles are overlapping five wave structures. They subdivide into five, three swing moves as 3-3-3-3-3 that give pause to a trend. This consolidates the progress made during a trending move that can be either bullish or bearish. These will only show up in the fourth waves of a five wave impulse. These are never seen as a stand alone structure in wave two. It is relatively common seeing triangle structures in three swing moves. Whereas they connector wave between the wave W or A. That being with the triangle itself being a wave B or wave X connector. Afterward the thrust from the triangle resumes in wave C or Y in the same direction as the preceding wave W or A.
In these particular running triangle structures, what you will see is the wave “b” to exceed the origin point of wave “a” in either a bullish or bearish market. One indicator we will use to identify the possibility of a triangle being in progress is the RSI. The wave “a” and “b” will show the high and low points of the rsi reading as well as price with the wave “c”, “d” & “e” contracting smaller each swing in both rsi and price until it reaches it’s terminus and resumes it’s previous trend. For this illustration purpose, it is seen below. The dotted lines preceding the “a” waves of the triangle can be either the wave 3. They also can be a wave A or W. After the “e” wave terminates the triangle the dotted lines resume the preceding trend in either a wave 5, wave C or Y.
Thanks for looking and feel free to come visit our website and take a trial subscription and see if we can be of help.
Kind regards & good luck trading.
Lewis Jones of the elliottwave-forecast.com Team
Back
