Market Correlation
Market correlation is one of the powerful techniques we use to forecast the market. Many traders, especially beginners, make mistake by trading and forecasting only one or a few instruments. E.g. the most popular are EURUSD, USDX, SPX, DAX, Gold. Although EURUSD is the most popular forex pair ever, it doesn’t always have the clearest structure among them. In fact, in majority of time it won’t be the clearest one, hence you have to analyse other instruments in order to get the reliable path for EURUSD.
We at Elliott Wave Forecast always based our analysis on the most clearest structures we have at particular stage. Even more, we use different instruments to determine paths and cycles in the different time frames.
In this technical blog we’re going to take a look at the Elliott Wave forecast of USDNOK and see how we use market correlation. It’s one of the instruments that helped us to forecast the short term path for USDX and EURUSD.
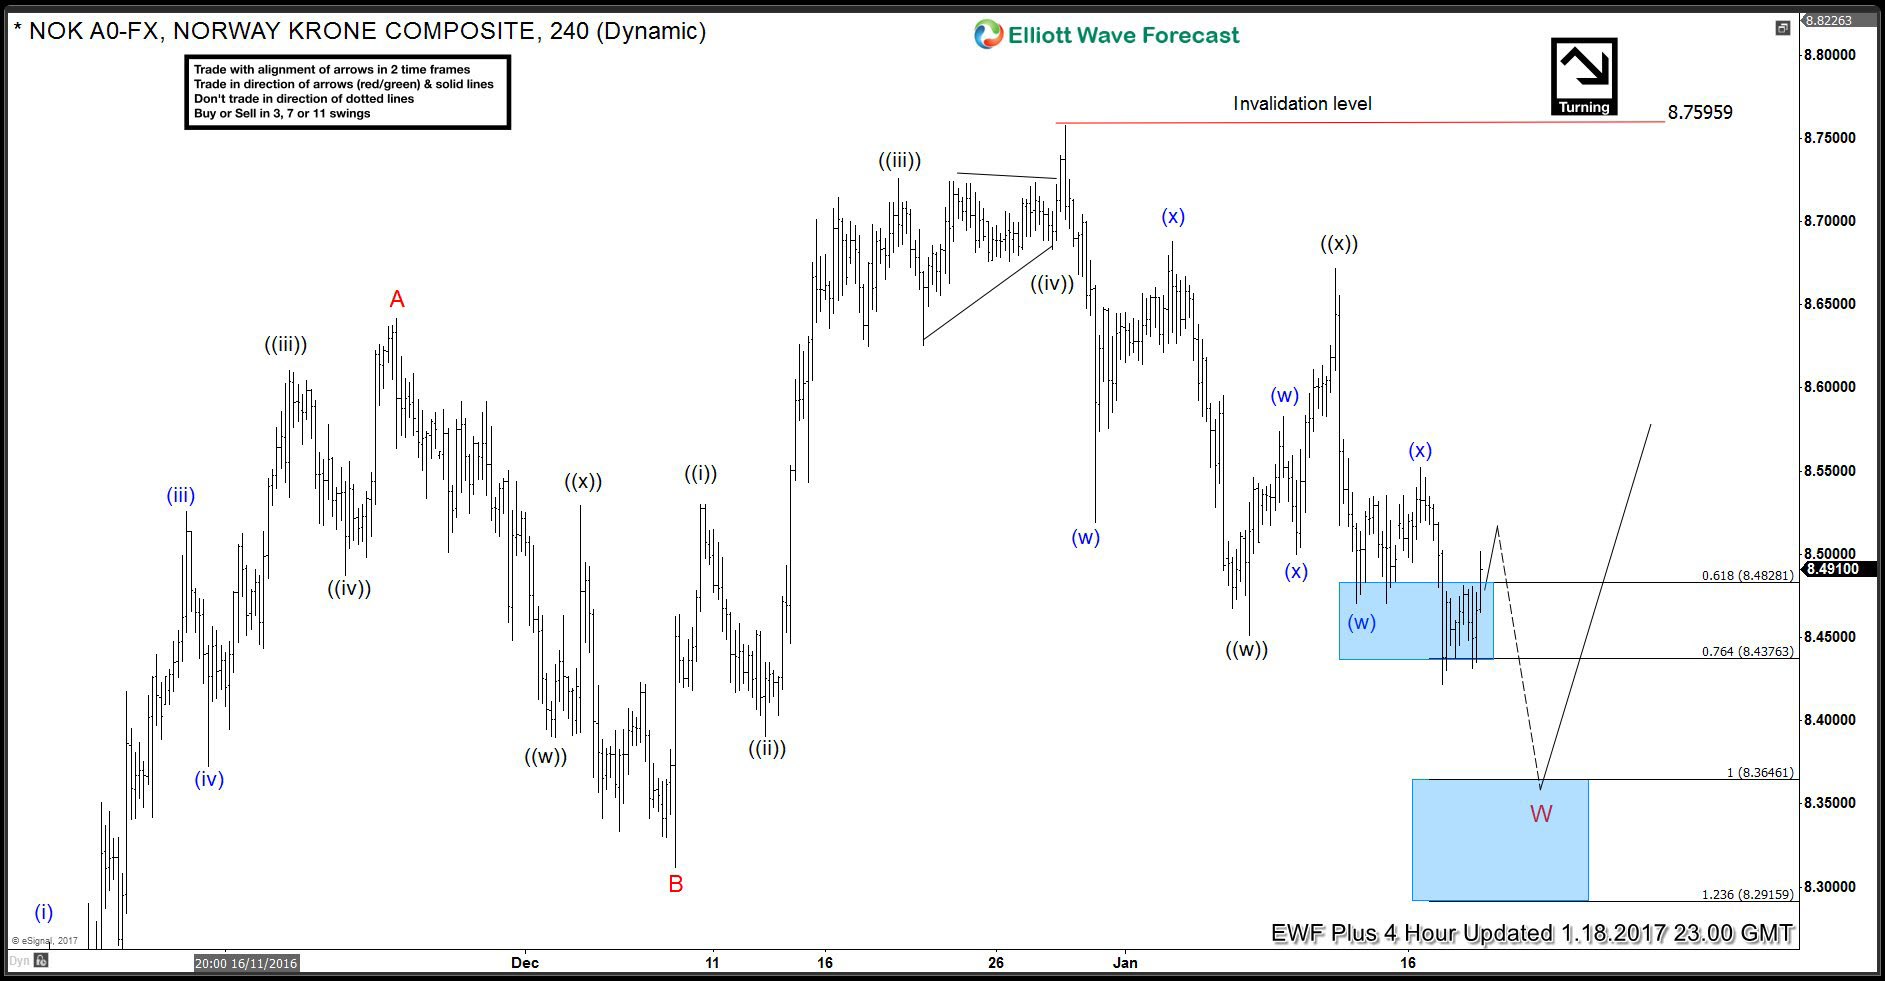
USDNOK 4 Hour 01/18 2017 Elliott Wave forecast
Once USDNOK broke the 01/06 low (8.4528) , it has given confirmation that more downside in dollar is going to happen. With mentioned broke in USDNOK,we got 5 swings in the cycle from the 12/28 peak. That means incomplete bearish structure. Our Elliott Wave forecast suggested further decline toward 8.3646-8.2915 where it can complete cycle from the 12/28 peak. Short term : the pair is bearish against the 8.5526 high in the first degree. We expect to see sellers in the 8.4912-8.5053 area for proposed decline.
At the charts below you can see how we forecasted the path in USDX and EURUSD.
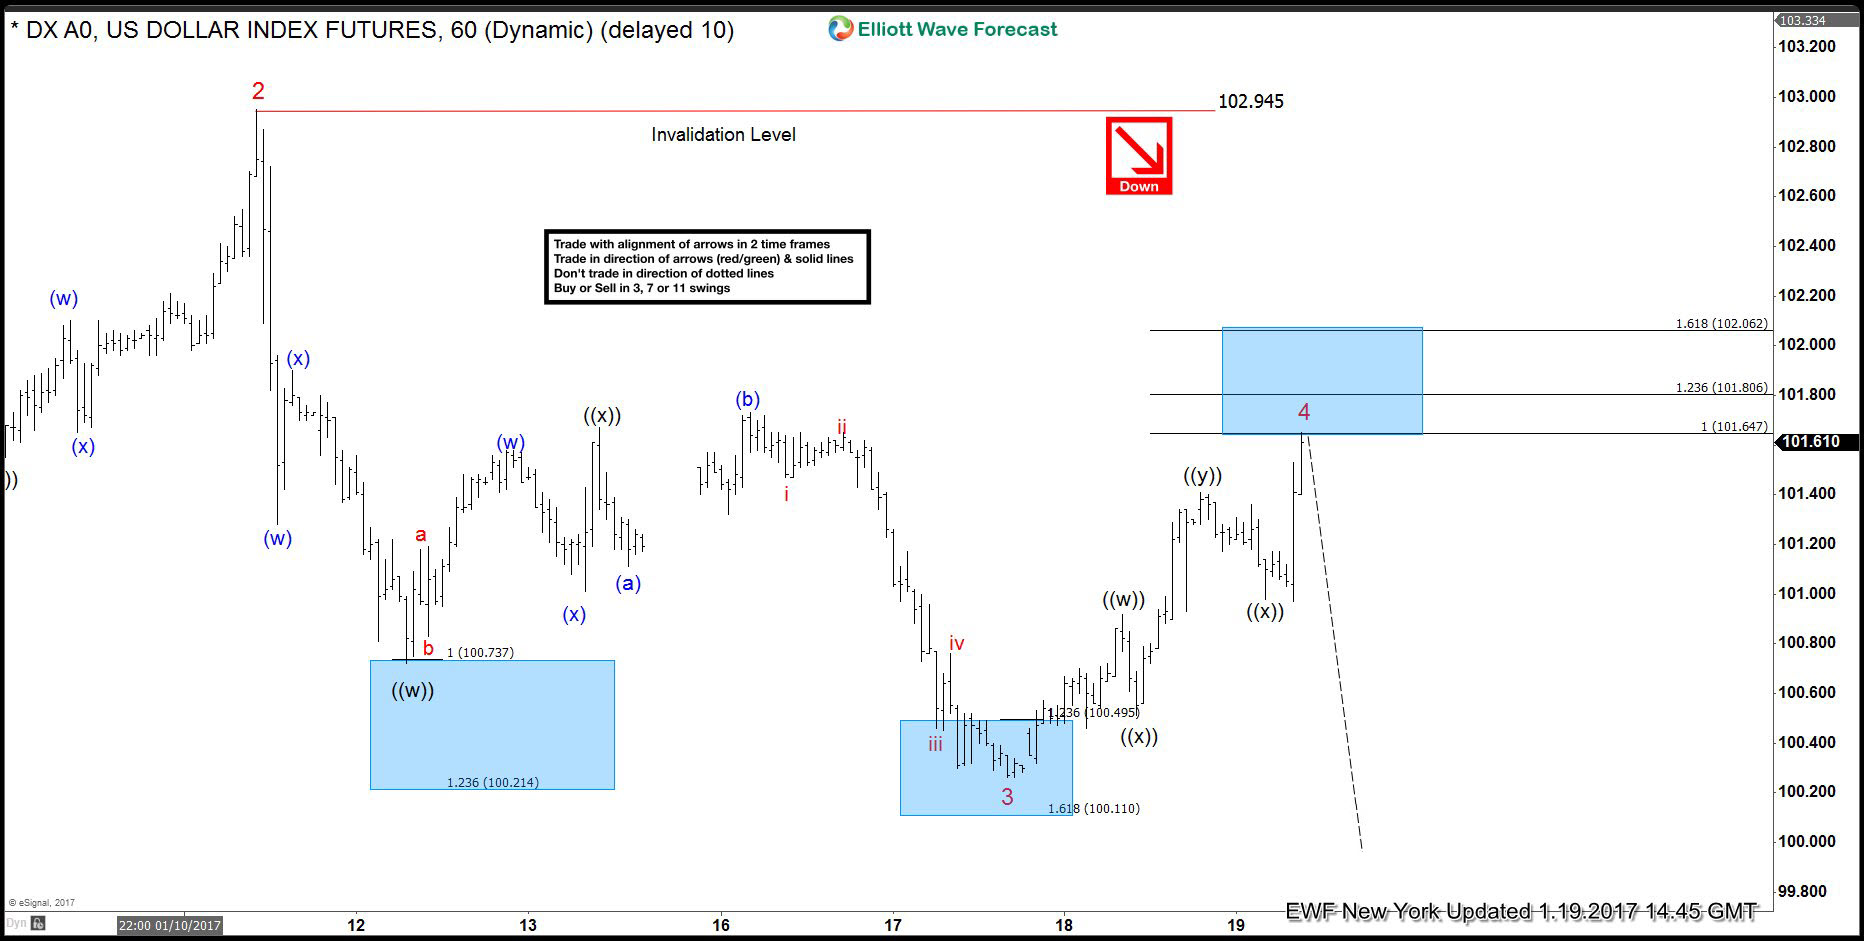
USDX NY Update 01/19 2017 We expect at least another extension to the downside until USDNOK reaches proposed target at 8.3646-8.2915. USDX is about to complete wave 4 red at 101.64-201.80 area where sellers are expected to appear. We’re aware that USDX is in the bonus time, however still calling for another low due to a market correlation.
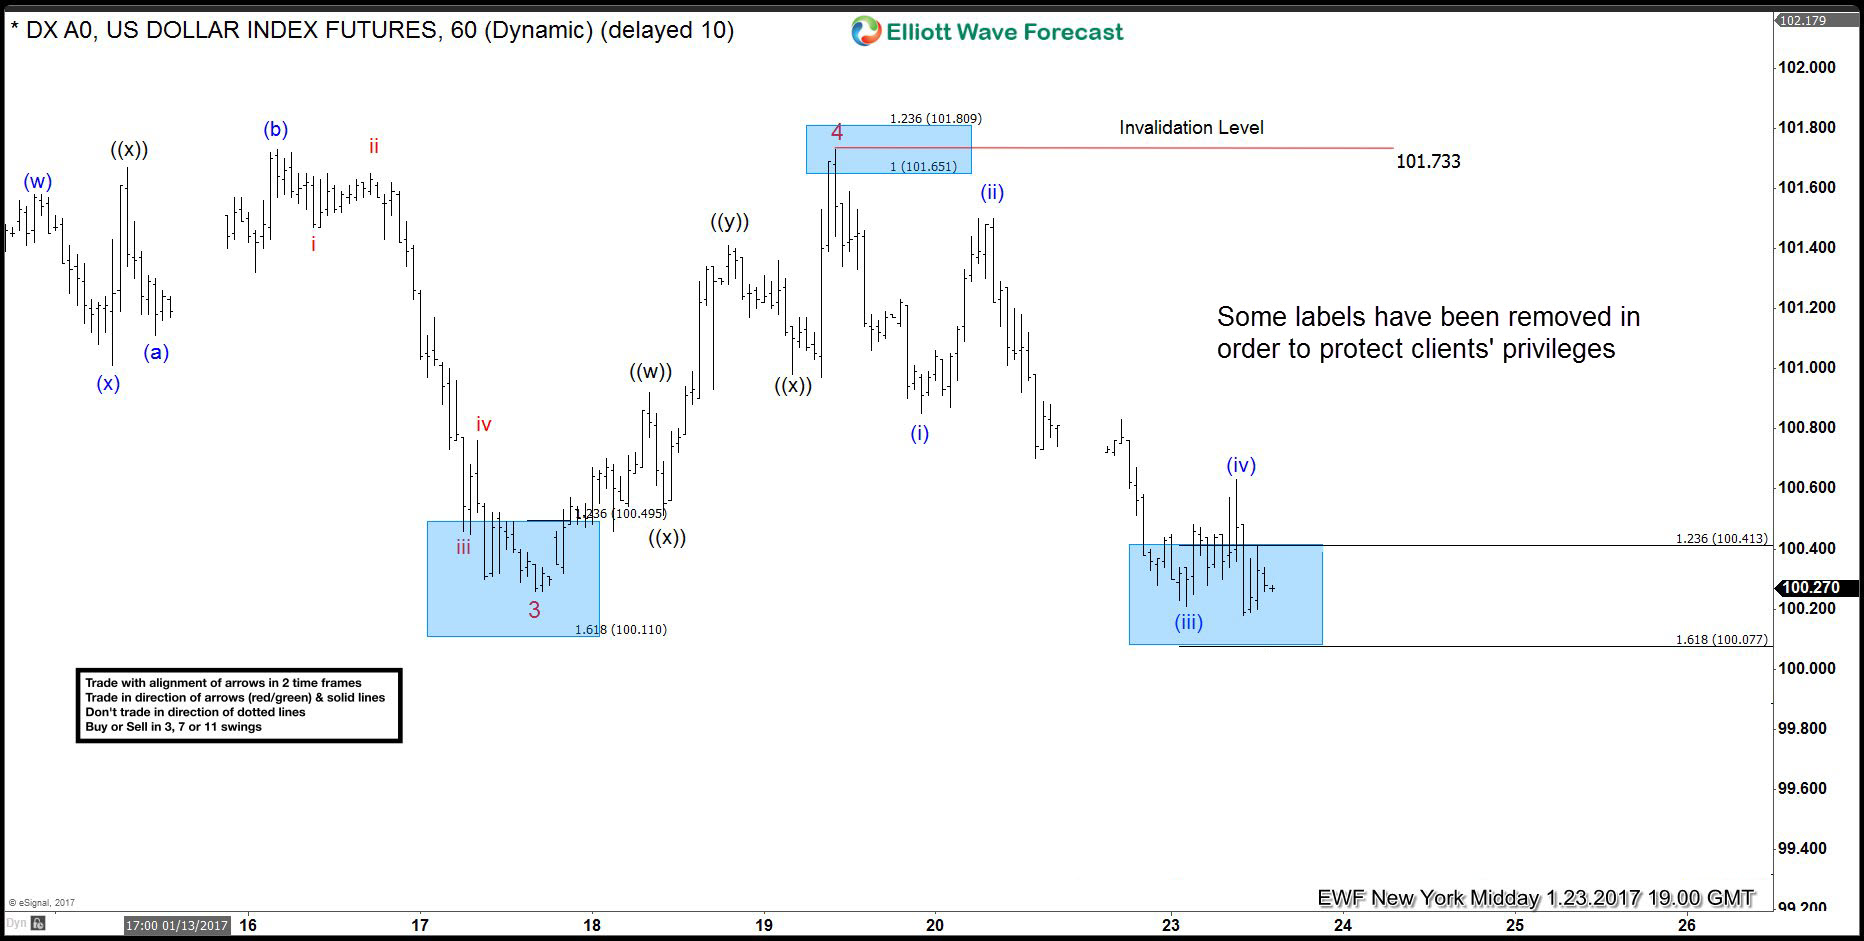
USDX NY Midday 01/23 2017 Wave 4 red recovery has ended as triple three. We got the proposed decline and new low has been made.
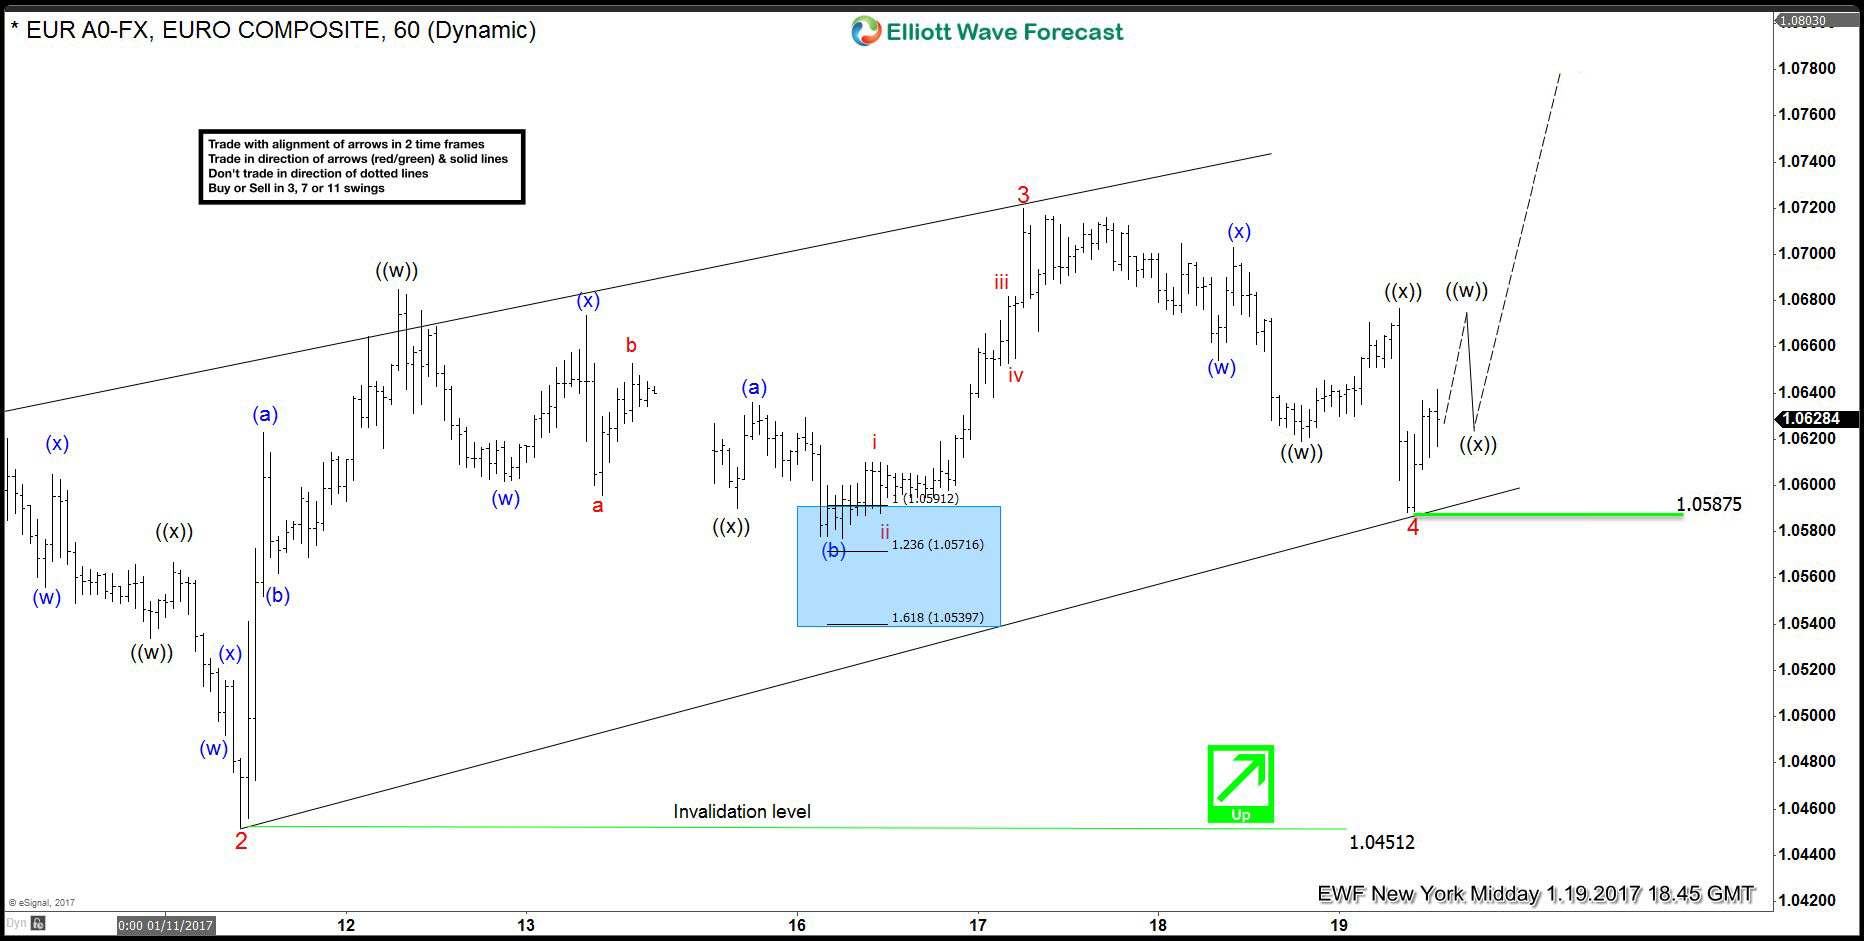
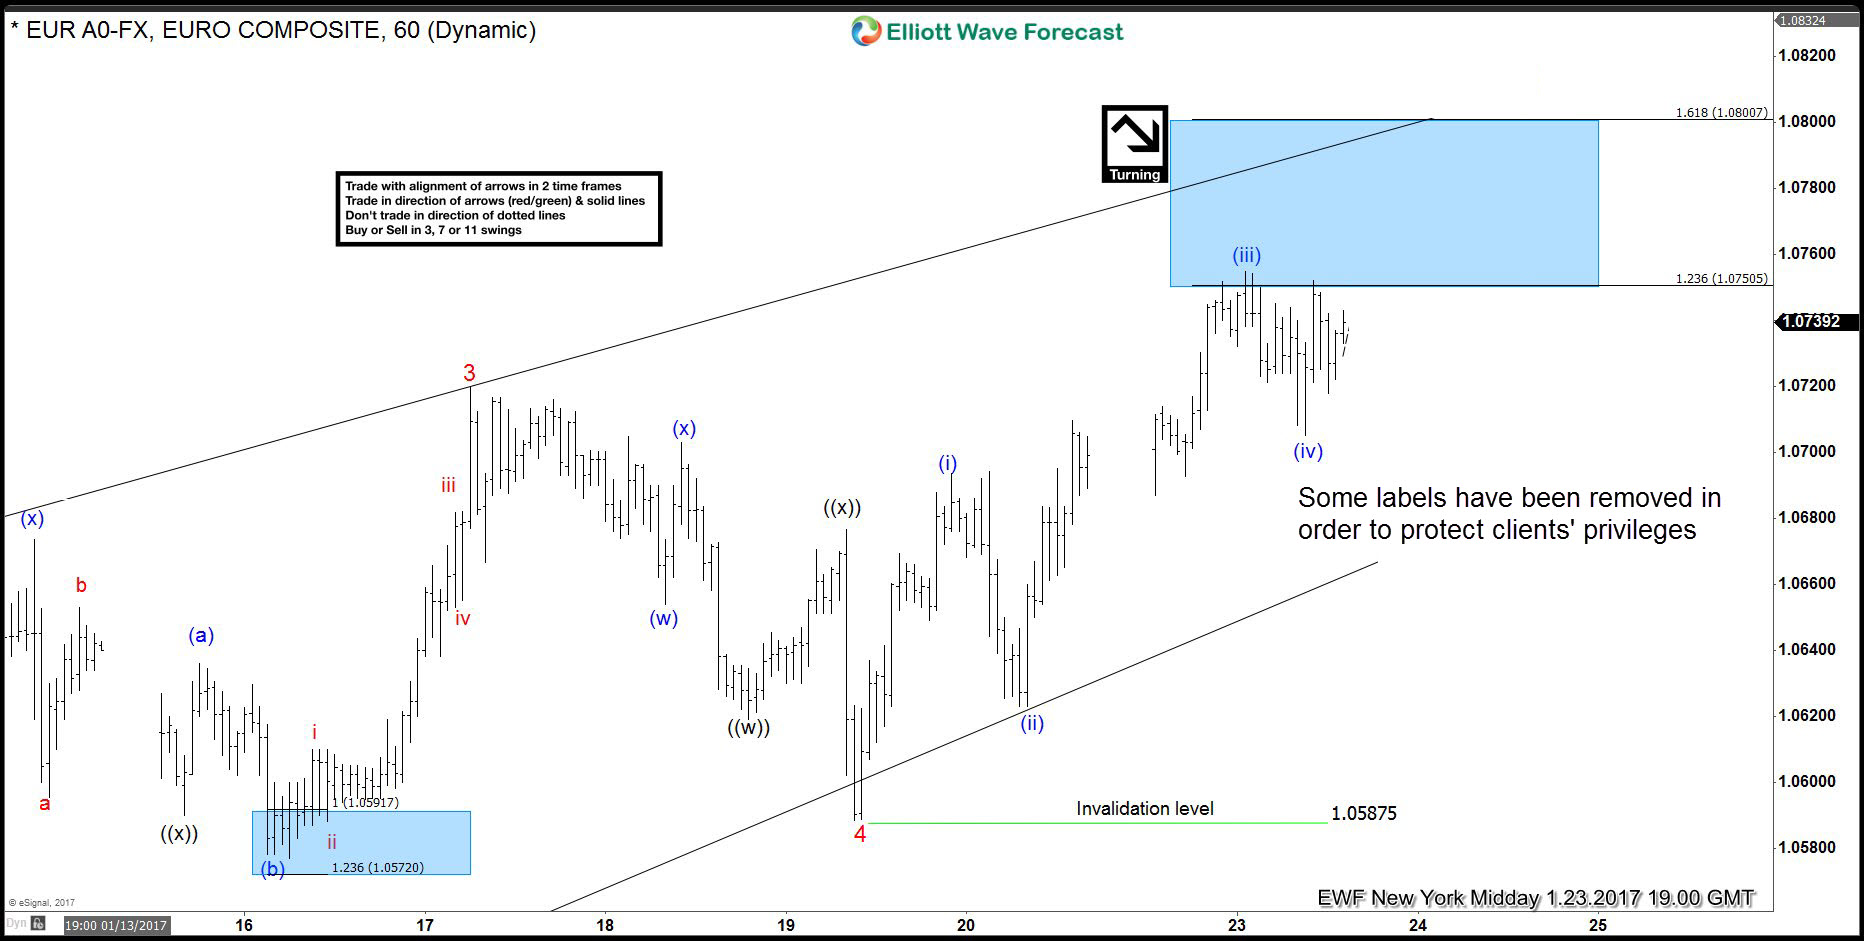
EURUSD NY Midday 01/19 2017 Current view suggests wave 4 red is done at 1.05875 and remains supported in short term. The pair is expected to make another high within wave 5 during the proposed decline in USDNOK.
EURUSD NY Midday 01/23 2017 Short term low:1.05875 held nicely ,we got the proposed rally toward new highs.
Market correlation is one of the most important techniques that helps us to forecast the market. If you want to learn the way we do it , join EWF now for Free. Our market experts educate members constantly through live sessions. Also providing you with money management and trading psychology tips. With us you keep growing not only as an analyst, but also as a trader.
If you’re interested in the future path of USDNOK, USDX, EURUSD you will find Elliott Wave analysis in the membership area of EWF.
Elliott Wave Forecast
Through time we have developed a very respectable trading strategy which defines Entry, Stop Loss ,Take Profit levels with high accuracy.
You will get access to Professional Elliott Wave analysis in 4 different time frames. Strategy of the Day/Week Video, Live Trading Room, 2 live Analysis Session done by our Expert Analysts every day, 24 Hour Chat Room support, Market Overview, Weekly technical videos and much more. Elliott Wave Forecast keeps you on right side of the market.
Back
