In our past article “US Dollar Outlook into FOMC Meeting on March 16“, we argue that the Fed is likely going to stay put and temper the rate hike expectation and this action should cause U.S. Dollar weakness.
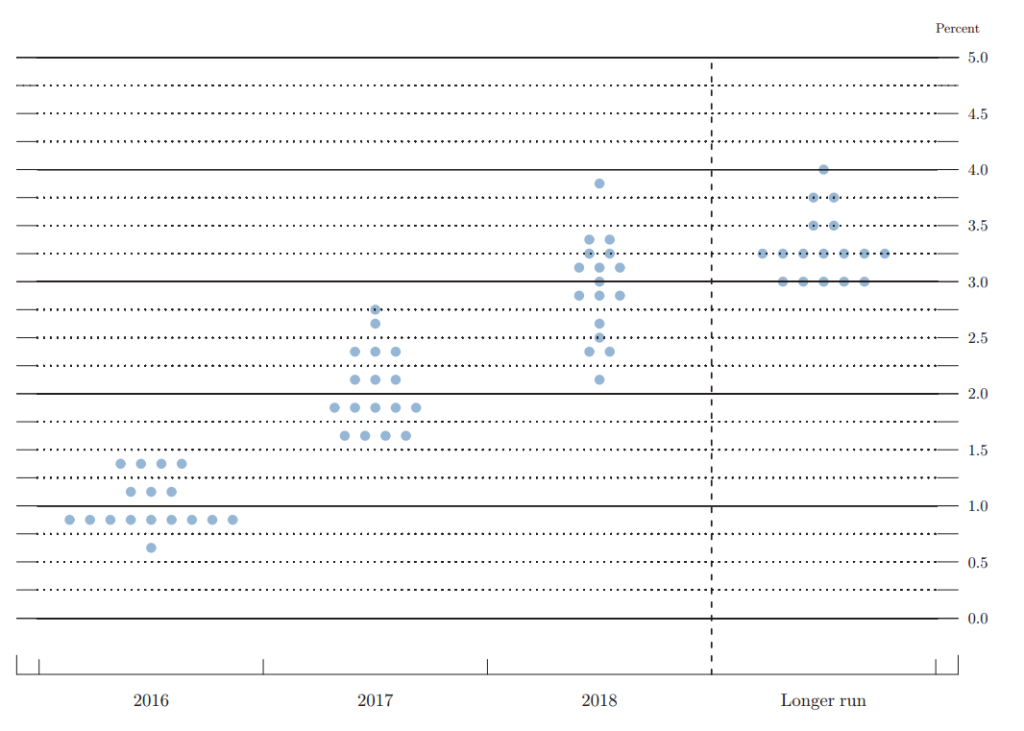
It happened as expected with the Fed last Wednesday lowers the median 2016 dot to two hikes from four hikes. The Fed cited international risk and global financial condition posing downside risk. Below is the new dot plot for 2016 and beyond.
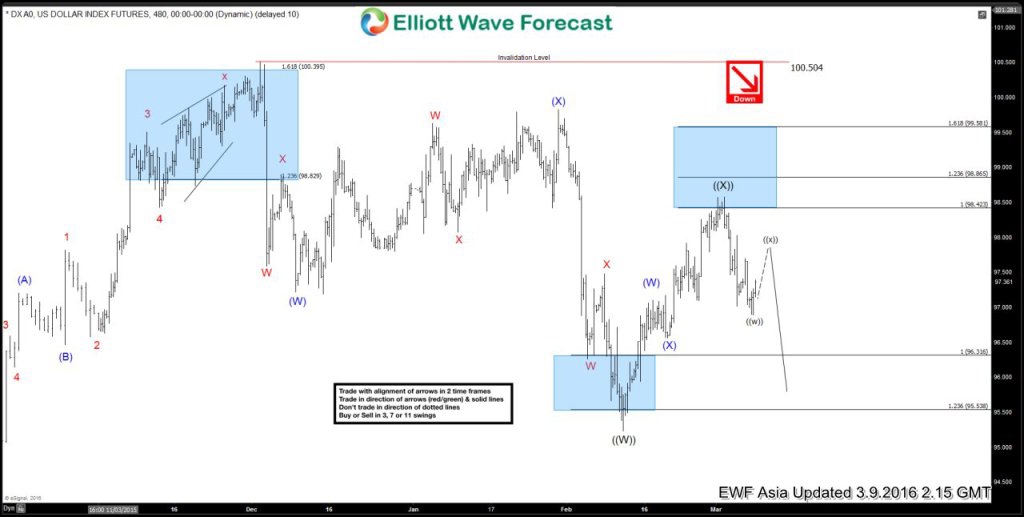
The dovish view by the Fed resulted in broad U.S. Dollar weakness. Below is the 4 hour Elliottwave chart before the FOMC Meeting on March 16 and based on the sequence, we were also looking for more downside.
After FOMC meeting, we’ve seen a broad based U.S. Dollar weakness resulting in stronger Yen and stronger Euro. In Japan and Euro-area, headline inflation rate is very low and thus strong appreciation in their currencies is not welcomed. Similarly, Australia and New Zealand are also fighting low inflation, and both central banks have indicated they are open to ease further if necessary. Thus, the question is whether this decline in USD is a temporary move or whether this is the start of something bigger and longer lasting.
It seems that there’s a limit to this U.S dollar weakness because either 1) Other central banks likely respond by easing further or 2) weaker U.S. Dollar helps the U.S to close the output gap, and strong U.S. data will require the Fed to tighten the policy and thus reverse the U.S. dollar selloff. All this suggest that U.S. Dollar can resume the rally again once the post FOMC move runs out of course.
However, not all central banks equally have the tools to defend against their currency appreciation. Suppose U.S. Dollar selloff is temporary, we think Australia Dollar and New Zealand Dollar may have a better chance because their positioning is quite stretched with $AUD/USD having risen 11.7% since Jan 15, and $NZD/USD having risen 8.4% since Jan 20. Furthermore, the RBA and RBNZ still have plenty of traditional tools left with the interest rate still at 2% and 2.25% respectively.
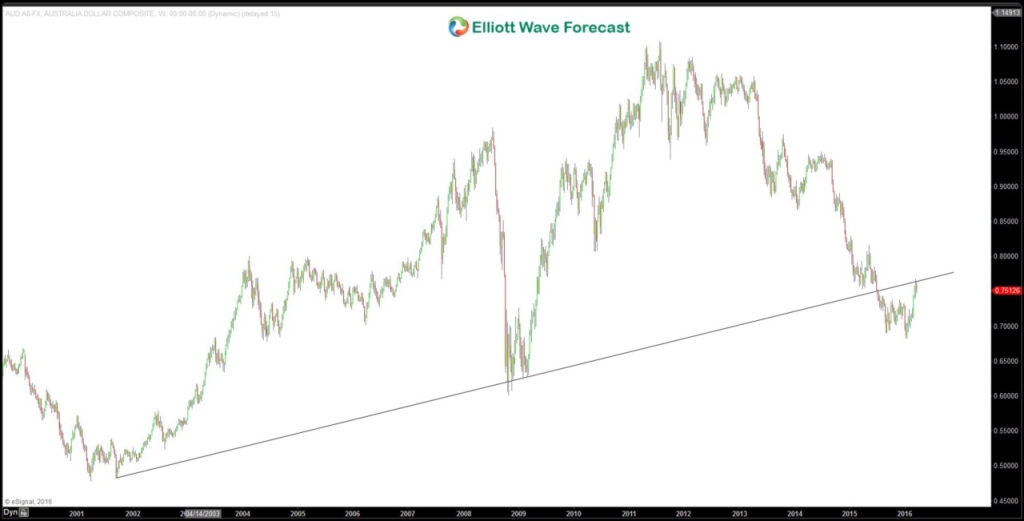
$AUD/USD weekly chart above breaks and close below 2001 trend line support. Pair is currently retesting this line.
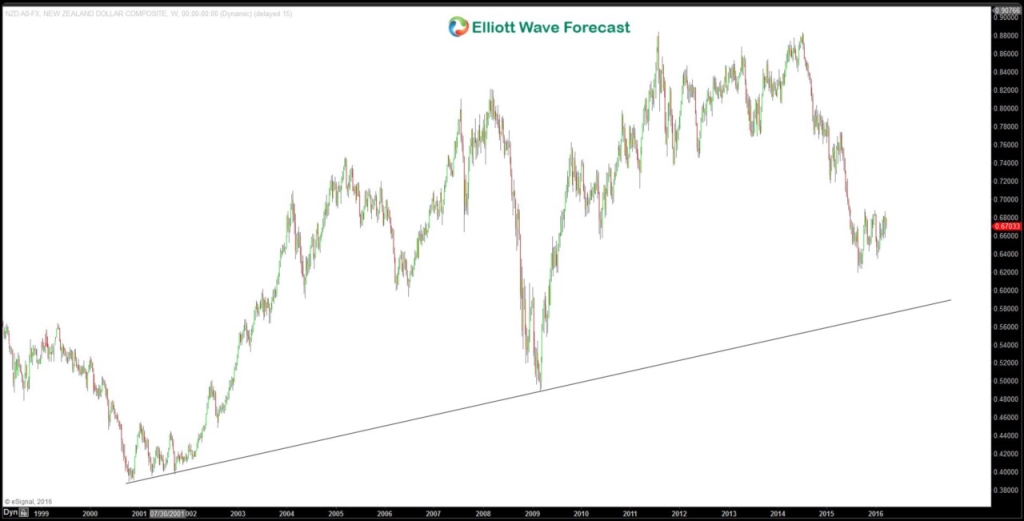
Unlike $AUD/USD which has broken and closed below the 2001 trend line, $NZD/USD weekly chart above has not retested the trend line from 2001. Pair can look to test it within 1 year.
If you enjoy this article, feel free to read other technical articles at our Technical Blogs and also check Chart of The Day. For further information on how to find levels to trade $USDJPY, or other forex pairs, indices, and commodities using Elliottwave, take our FREE 14 Day Trial. We provide Elliott Wave chart in 4 different time frames, up to 4 times a day update in 1 hour chart, two live sessions by our expert analysts, 24 hour chat room moderated by our expert analysts, market overview, and much more! With our expert team at your side to provide you with all the timely and accurate analysis, you will never be left in the dark and you can concentrate more on the actual trading and making profits.
Back


