“Patience is bitter, but its fruit is sweet.” – Aristotle
There are times in this business of trading that require a great deal of patience. In the world of Elliott wave analysis there is perhaps no other test of one’s patience than that of a triangle. Right now we project that a Minor degree wave B triangle has completed in Bitcoin (BTC/USD) and its progression has most definitely tested the patience of crypto-currency traders.
The Basics of a Triangle
Before we get into the specifics of the proposed triangle in Bitcoin let’s review the basic tenets of Elliott wave triangles. A triangle is one of three main categories of corrective wave patterns characterized as a sideways and often prolonged series of 5 overlapping waves that reflect a 3-3-3-3-3 patterned structure. This series of 5 overlapping 3 wave movements are labeled generically and without regard to degree here as A-B-C-D-E. Within a triangle there appears to be a struggle between the typical “dip” buyers and their counterpart “rip” sellers that over time “contract” a particular instrument in terms of volume, volatility , and price. There are 4 types of Elliott wave triangles and all are depicted for reference in the diagram below and here at our website. Click here for a hierarchy of our Elliott wave labeling degrees.
Where Triangles Occur
Triangles occur just before the final actionary cycle of the next largest degree wave. In an impulsive sequence triangles occur in the “fourth” wave. In a corrective sequence triangles typically occur in the “B” wave. There are also allowances for a triangle to occur in the final wave “X” of a double zigzag, triple zigzag or combination correction. For now, let’s focus on the wave 4 or B. Reference here for a complete compilation of Elliott wave corrective structures.
The Minor Degree Wave B Triangle in Bitcoin
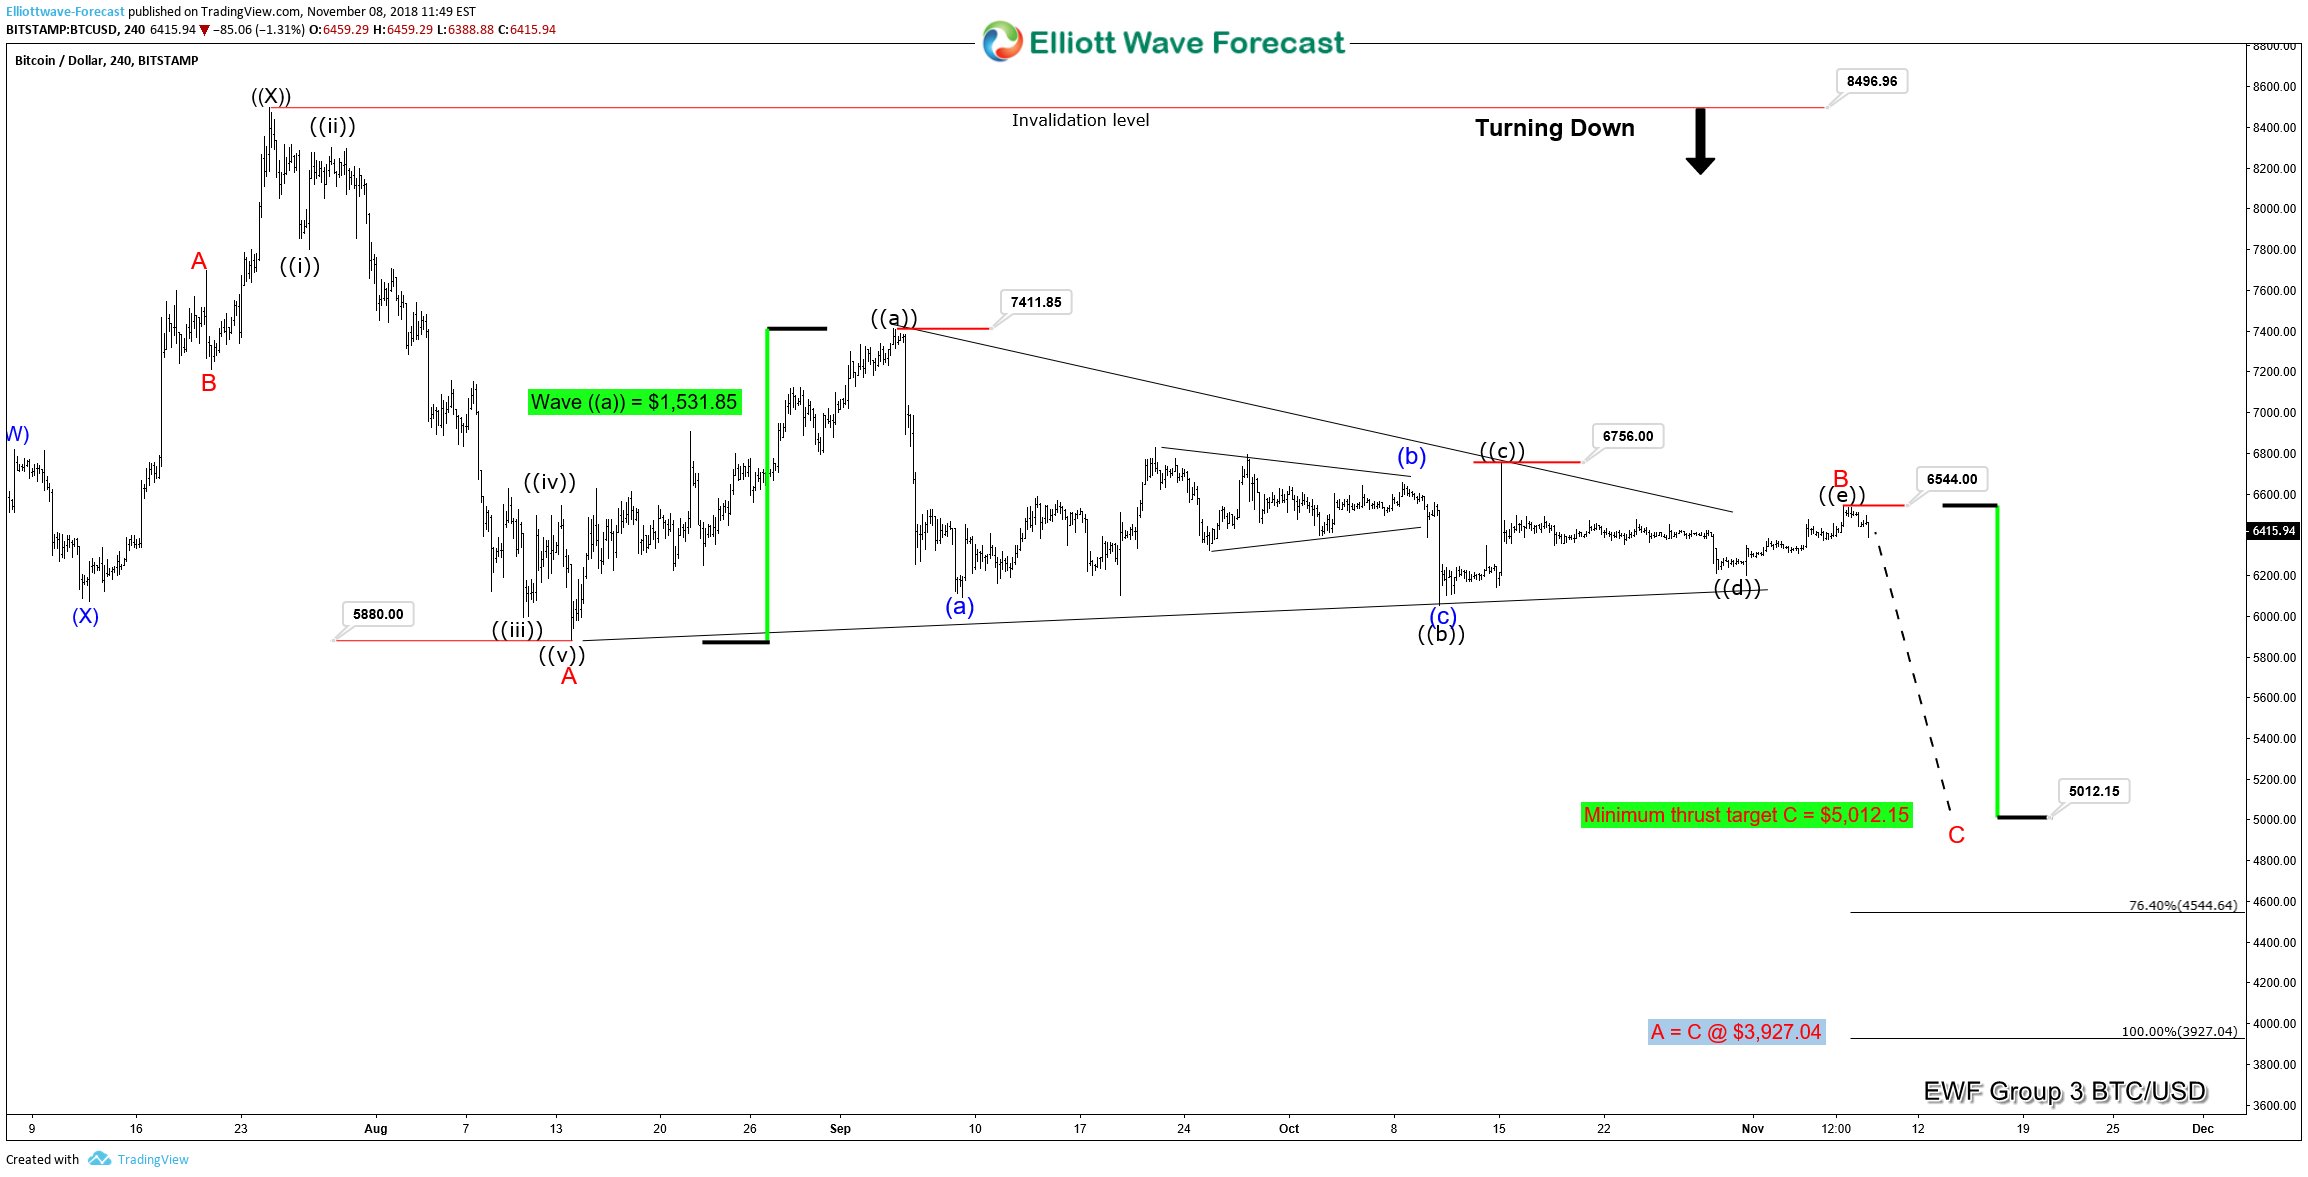
The Bitcoin cross (BTC/USD) has been pretty much locked in consolidated, corrective, sideways price action ever since the low of $5,880 on August 14, 2018. The first and widest portion of this proposed Minor degree wave B triangle began at the aforementioned low and peaked on $7,411.85 on September 4, 2018 which is labeled Minute degree ((a)) in the chart below. Minute degree wave ((b)) progress in its 3 wave decline to a low of $6,055.28 on October 11, 2018. Minute degree wave ((c)) reached its 3 wave extreme on October 15, 2018 at $6,756 followed by the 3 wave bearish progression in Minute degree wave ((d)) to a low of $6,199.25 on October 31, 2018. We have now charted progression and completion of the final 3 wave sequence in Minute degree wave ((e)) at the $6,544 high of November 7, 2018.
What Happens Now that the Bitcoin Triangle is Said to be Complete?
The resolution of a triangle is in the direction of the prior actionary wave. In the case of Bitcoin the prior actionary wave, labeled Minor degree A in red, was to the downside. The resolution of the triangle is also known in the Elliott wave world as a “thrust” out of the triangle. In Bitcoin we are expecting the thrust to be the Minor degree wave C to the downside in order to complete the higher Primary degree wave ((Y)).
One way to measure this expected thrust is to measure the length of the widest portion of the triangle and project that calculated length from the end of the ((e)) wave (and end of B) to obtain a minimal target for the end of the thrust. In the chart above you can see the green highlighted areas depicting 2 ranges. The first range on the left of the chart is the range that the Minute degree wave ((a)) of the triangle covered from low to high equal to a distance of $1,531.85. This is our widest range of the triangle. Projecting a decline of $1,531.85 from the end of the B wave triangle gives us a minimal target of $5,012.15. Another target would be the measurement of equality between the length of Minor degree wave A to Minor degree wave C extended from the top of Minor degree wave B. This measurement gives us a secondary target of $3,927.04. On a daily and weekly time frame our subscribers have even larger downside targets.
The Current Near Term Structure in Bitcoin
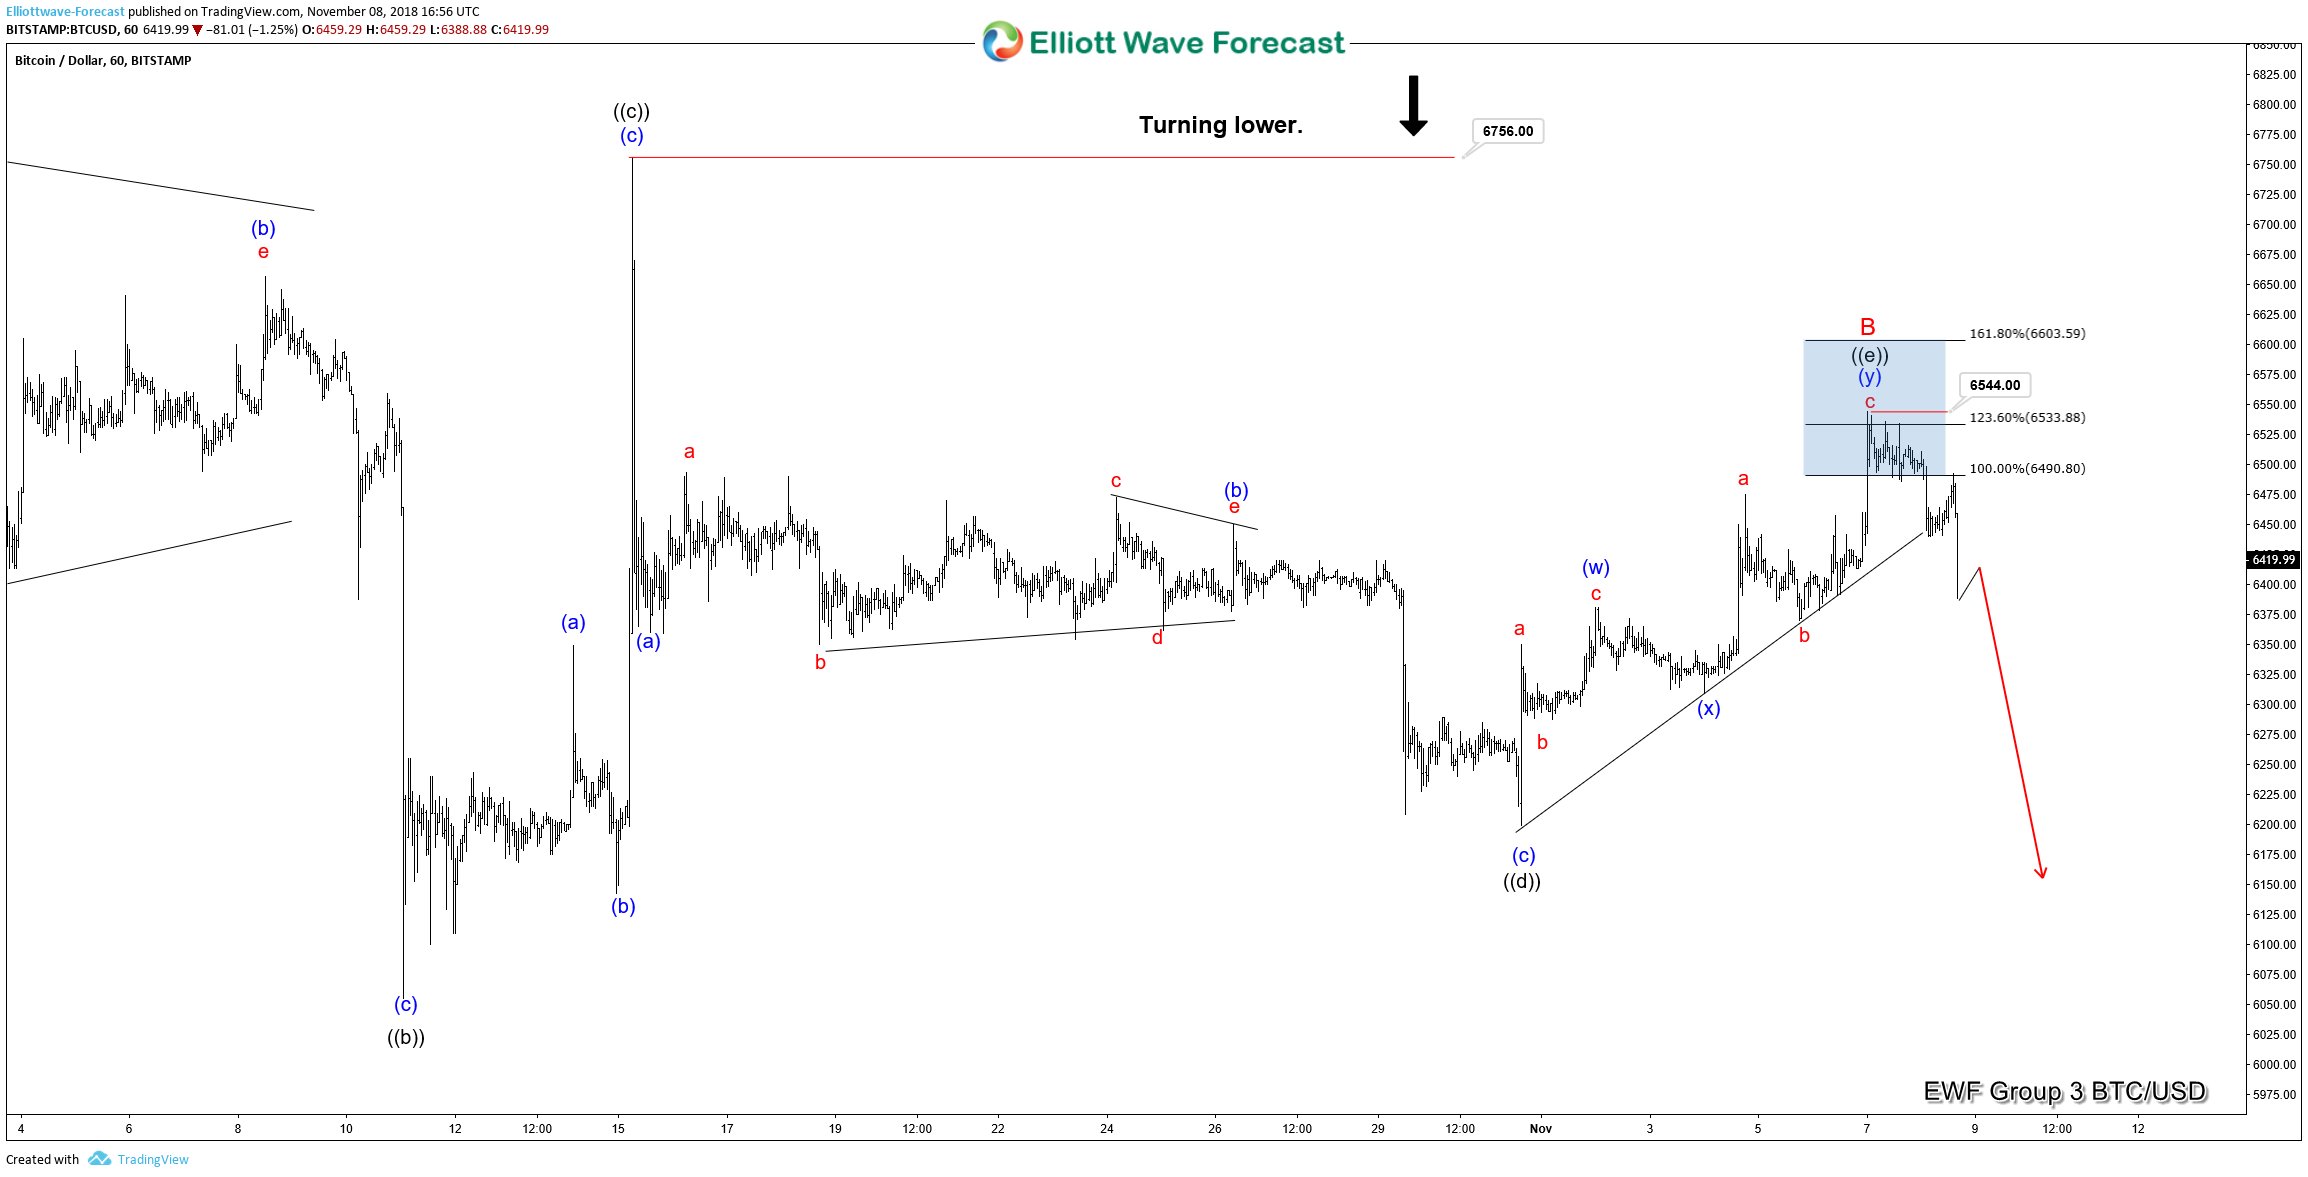
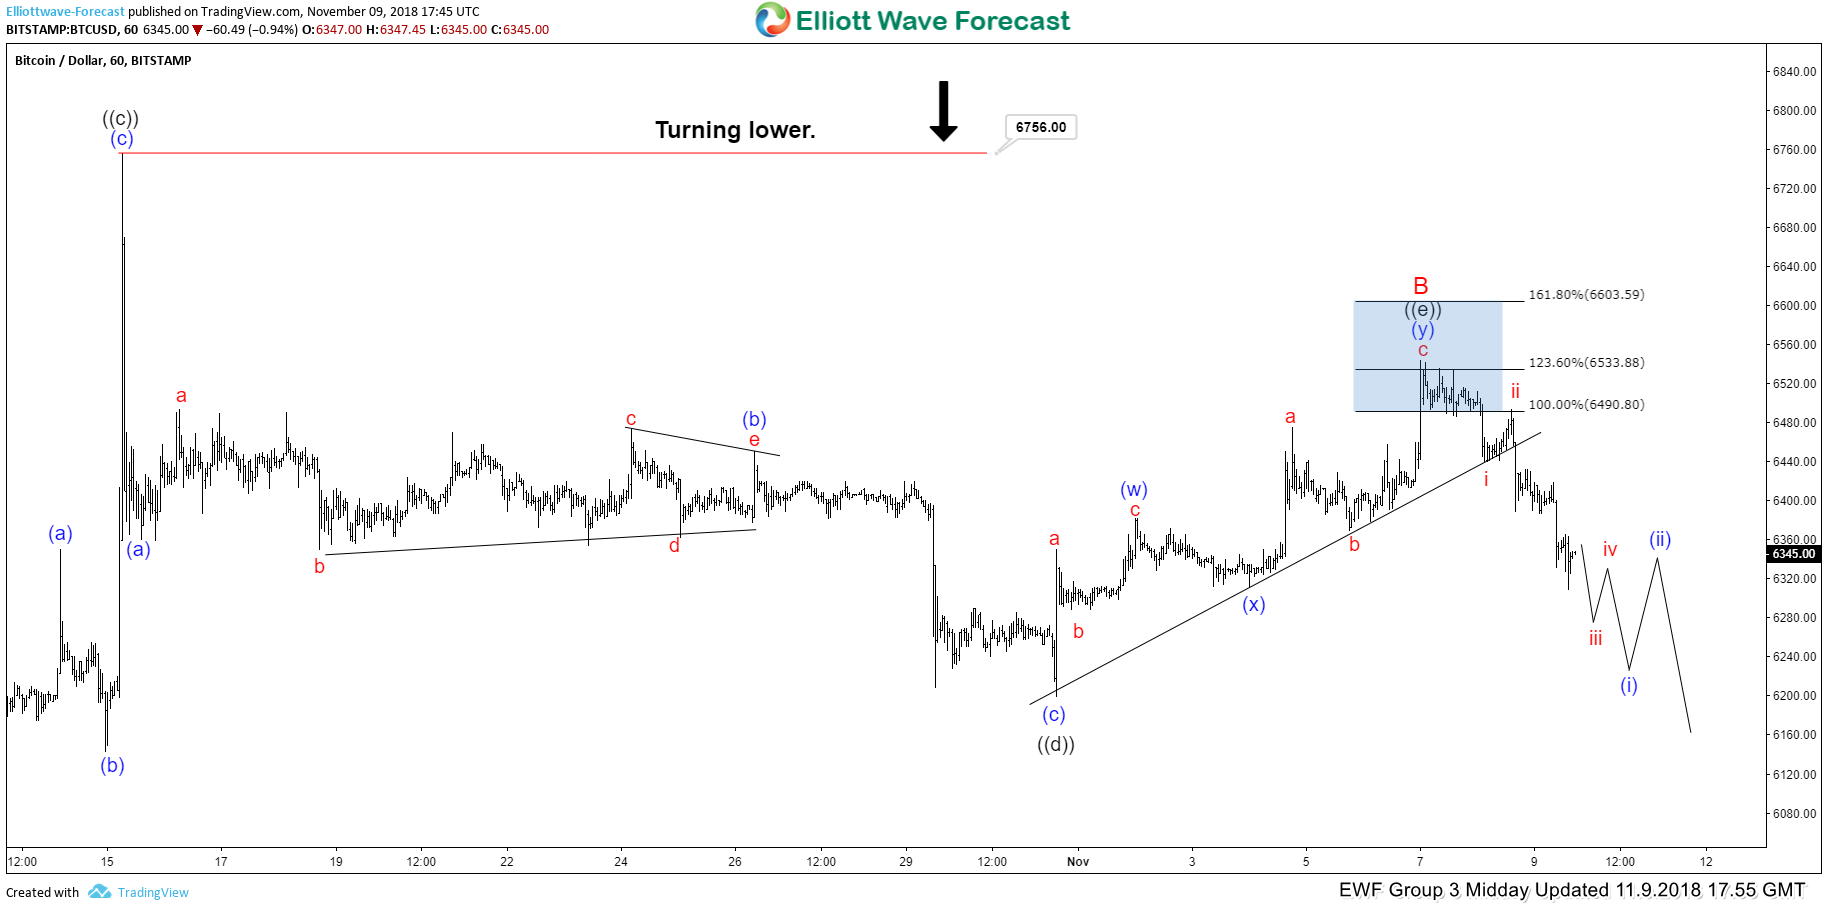
In the two charts below you can see the progression to the downside in Bitcoin has begun. We are currently labeling the decline with a bearish motive notation. Chart 1hr_a shows the first few hours after we stated the Bitcoin triangle finally completed. Chart 1hr_b shows what happened just a few short hours after the picture of Chart 1hr_a was captured in Bitcoin.
Chart 1hr_a Bitcoin November 8, 2018
Chart 1hr_b Bitcoin November 9, 2018
Chart 1hr_b above shows the midday update for Bitcoin on a 1 hour time frame for November 9, 2018. As you can see we’ve continued in the projected direction and are indeed progressing to the downside in an impulsive manner. This current price action in Bitcoin is helping prove our analysis. Going into the next few trading session traders should continue to look for lower prices toward the abovementioned targets for Bitcoin.
Is Your Analysis of Bitcoin on Track?
In this brief primer on triangles and Bitcoin you can see where we think Bitcoin is going in the very near term. After a summer sideways lull Bitcoin appears to be waking up. Want to know how much lower Bitcoin can go aside from the minimal targets set forth here? Or do you just want to be on the “right side” greater than 85% of the time no matter what instrument you trade? Then take a risk free 2 week trial of Group 3 offerings. We look forward to serving your trading analysis needs at Elliottwave-Forecast.com
Trade Safe!
James
EWF Analytical Team
Back


