SUI is a high-performance Layer 1 blockchain and smart contract platform designed to make digital asset ownership fast, private, secure, and accessible. In today’s article, we’ll explore the daily Elliott Wave structure for its native token and explain the potential bullish outcome after the recent correction.
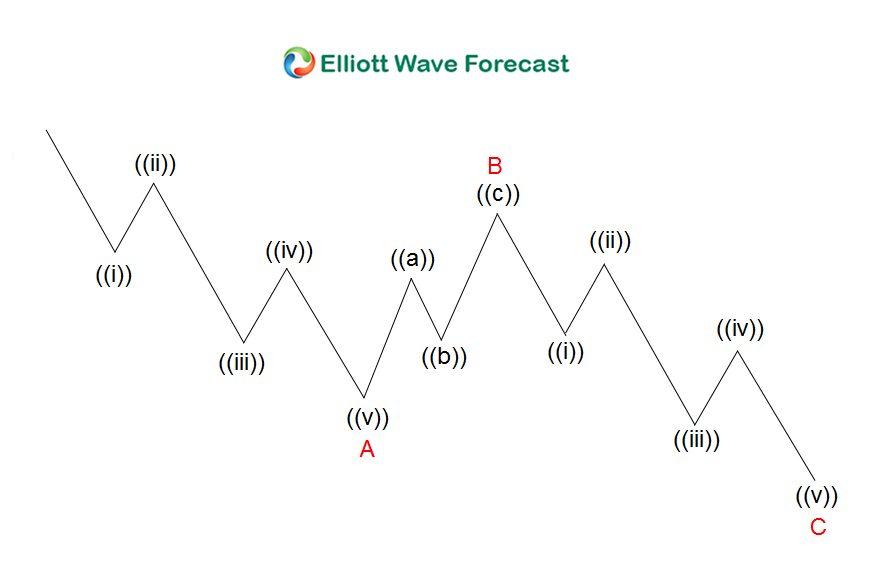
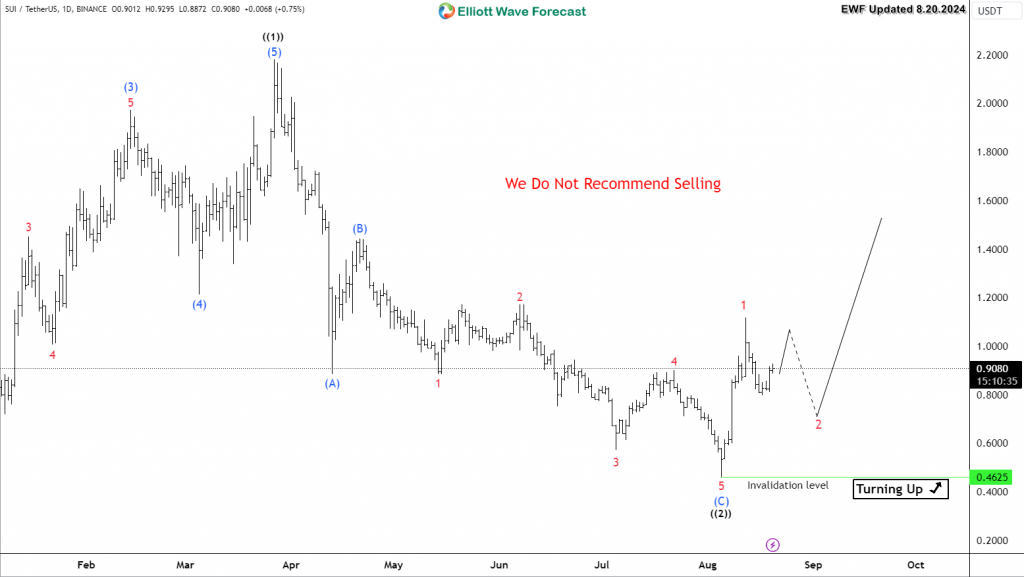
SUI lost 78% of it’s value since March 2024. The coin declined 4 months in a row until it found a bottom on 5Th of August 2024. The move from the peak unfolded within 3 waves and it formed a corrective Elliott Wave structure called ZigZag. This type of correction is followed by a reversal in trend and SUI in this case is proposed to have ended a wave ((2)) pullback therefore it’s expected to resume the rally to the upside within a wave ((3)).
The recent +140% rally from August low confirmed that correction has ended. Consequently, SUI either started the new cycle to the upside or at least it will be looking for a larger 3 waves bounce against $2.18$ peak. As long as the short term pullbacks stays above $0.4625 then the coin is expected to see further upside within it’s daily cycle. Traders are recommended to look for a short term bullish sequence then they can start buying pullbacks in 3 , 7 or 11 swings.
Elliott Wave ZigZag Structure
SUI Daily Chart 8.20.2024
Explore a variety of Crypto investing ideas by trying out our services 14 days and learning how to trade our blue boxes using the 3, 7 or 11 swings sequence. You will get access to our 78 instruments updated in 4 different time frames, Live Trading & Analysis Session done by our Expert Analysts every day, 24-hour chat room support and much more.


