Silver’s Intrinsic Monetary Value
Silver is a unique metal which belongs to the category of Precious Metal. Along with Gold, Silver has been used as money for thousands of years. It was the Roman Empire in 330 BCE who first used gold and silver in a widespread currency system. Under the Roman currency system, denarius is the name of a small silver coin and became the main coin of the Roman Empire. Historians say 1 denarius is the daily wage for an unskilled laborer and common soldier or about $28 in bread. Silver and gold continue to be accepted and recognized for what they are, money, until modern times. In July 23, 1965, The Coinage Act of 1965 eliminated silver from circulating United States dime and quarter coins. Then in 1971, President Nixon removed US dollar peg to the gold, effectively ending the gold standard until today.
Silver’s Industrial Application
Unlike Gold which is recognized only for their intrinsic monetary value ,Silver has widespread industrial application in electronics, healthcare, and the more recent photovoltaic for solar energy. The photovoltaic application for solar energy in particular is forecasted to boost the overall physical silver demand in the next several years. According to London-based Capital Economic’s analyst Simona Gambarini, although solar industry only accounts for just 6% of overall physical silver demand, global solar capacity is growing at an average rate of 53% in the last decade, underscoring future growth potential.
Silver’s Demand and Supply Imbalance
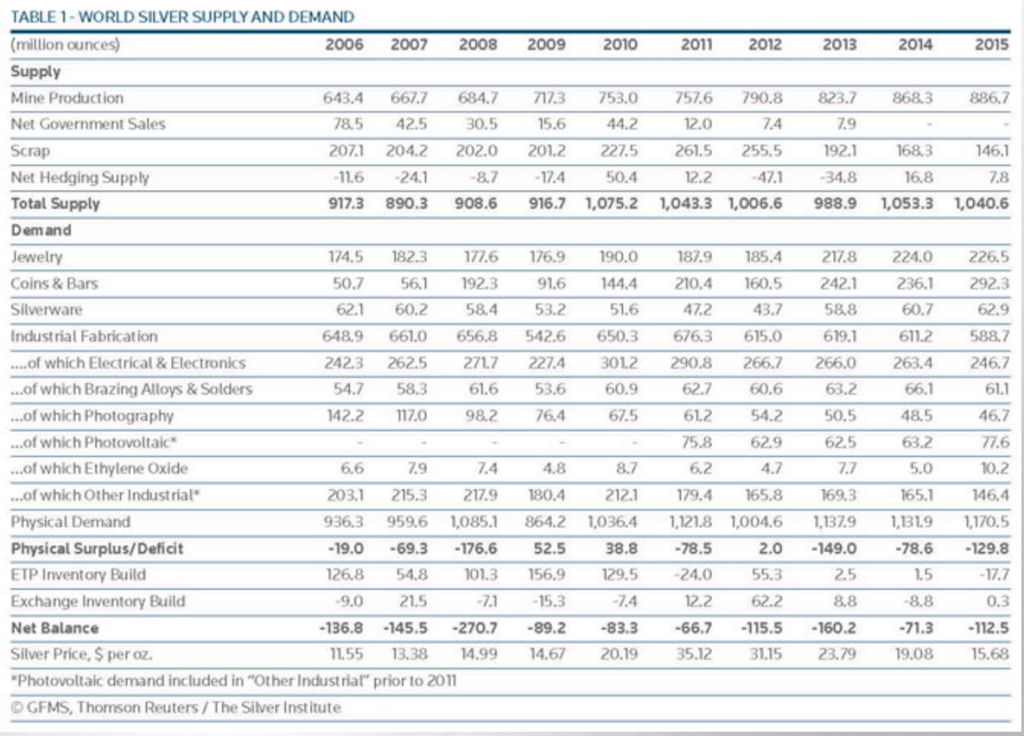
Other than the industrial demand for silver, there are also silver demands for jewelry, coins / bars, and silverware. The Silver Institute and Thomson Reuters GMFS issues an annual report on the supply and demand for silver. Latest report below shows there’s 129 million ounce silver shortage in 2015.
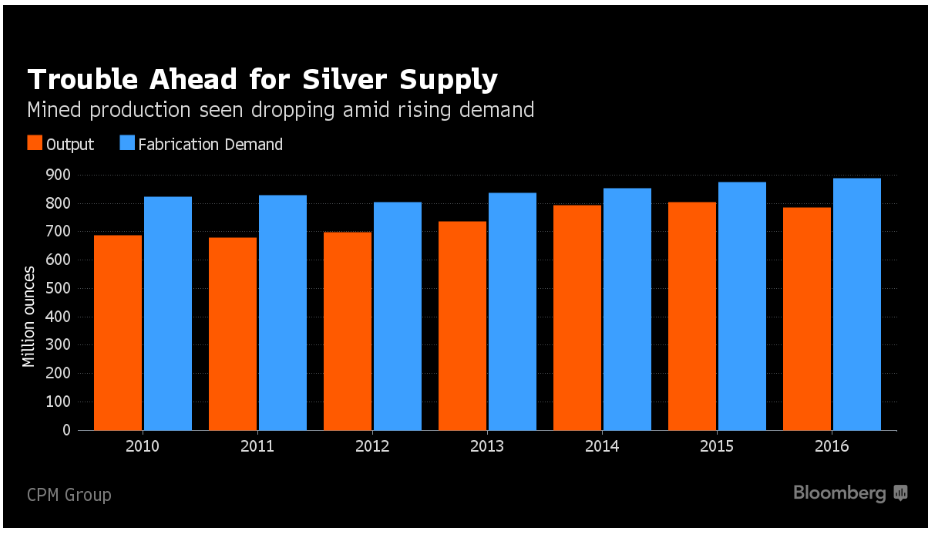
New York-based researcher CPM also said in its “Silver Yearbook 2016” that production of silver output is seen to continue dropping in 2016 due to the depressed silver price while demand keeps rising, as chart below shows:
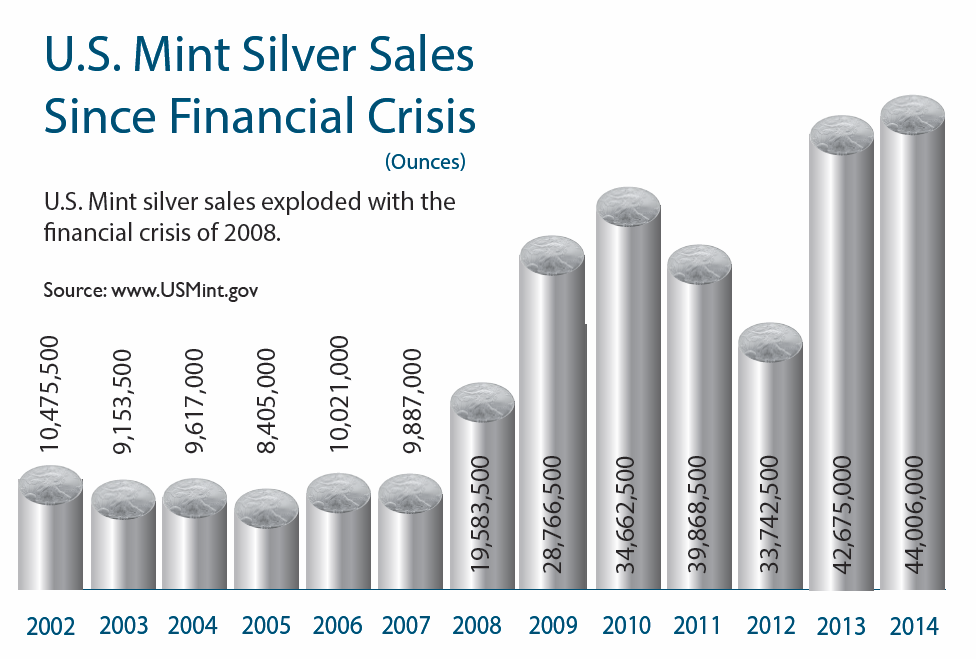
US mints, as just one segment representing the demand for silver, has seen its sales exploding since 2008 financial crisis as the chart below shows:
Silver’s Paper vs Physical Market
With demand outstripping supply for the last few years, how is it possible that silver’s price continue to languish in the past 4 years after reaching $49.8 peak in 2011? One circulating theory is that physical price for silver is controlled by paper-based exchange such as LBMA and Comex with the use of derivatives and contracts. Opinions by some analysts suggest that the Bullion Banks (market maker such as JP Morgan, Scotia Bank) may have tried to contain and control the price of silver by issuing unlimited supply of derivatives which only needs a small percentage of the real underlying physical metal as the collateral. With very little physical silver delivered, the price “discovered” is in fact the price of the derivative itself, not the actual physical metal. This theory looks to have been vindicated as early this year, Deutsche Bank admitted to rigging silver and gold price and settled a lawsuit.
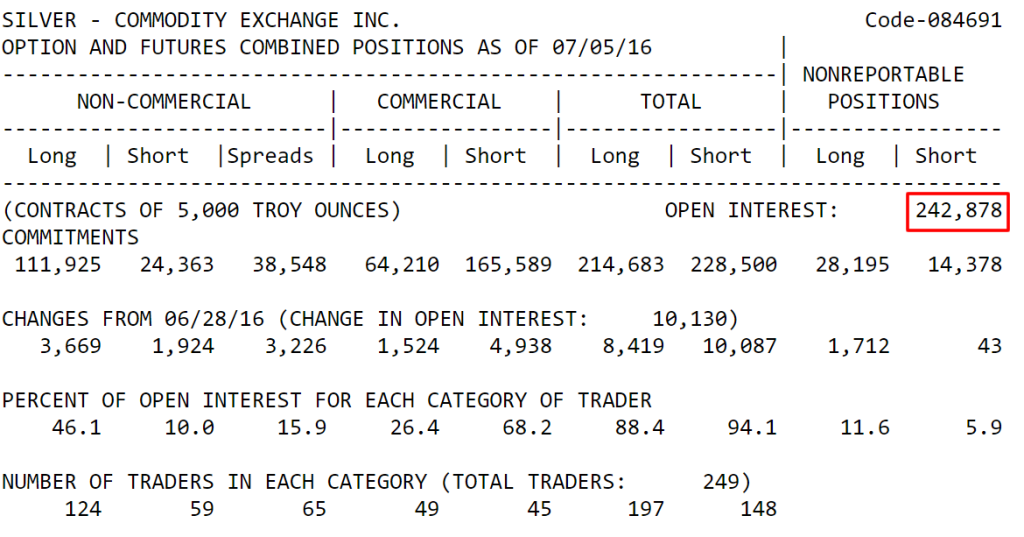
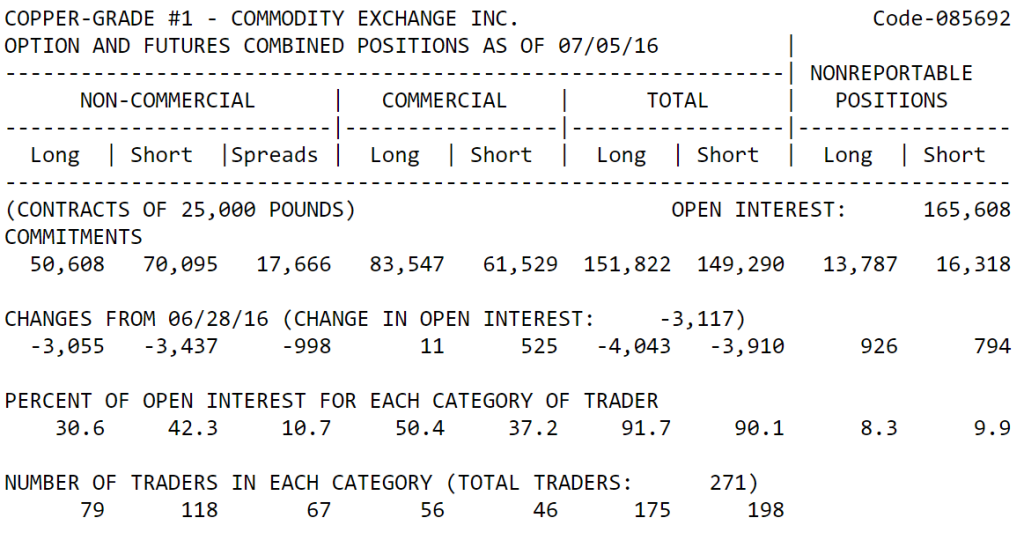
In the exercise below, we will take a look at CME COT (Commitment of Trader) report for silver and copper. Each contract in COT is essentially an agreement between buyer and seller to buy / sell with little actual physical delivery. The total Open Interest then represents the total contract obligation to buy / sell . We will compare the COT Open Interest in silver and copper to draw some interesting observation:
From Silver’s COT above, we see that every Comex contract is a contract to buy / deliver 5000 troy ounces of silver. With Open Interest at 242,878, Comex has an obligation to deliver 242,878 contracts x 5,000 oz / contract which is 1.2 billion ounces of silver. As the report by Silver Institute and Thomson Reuters GFMS earlier above shows, the annual silver supply in 2015 is about 1 billion ounces. This means that the Comex silver open interest represents 120% of total mine supply.
Let’s compare Silver’s Open Interest to another base metal Copper’s Open Interest to see the problem in Silver’s Comex paper market
Total Comex copper open interest is 165,608 contracts. Each contract represents 25,000 pounds of copper, which suggests a Comex delivery obligation of a little more than 4 billion pounds of copper. The world produces around 41 billion pounds of copper annually, so the Copper open interest represents only about 10% of total mine supply.
A comparison between the open interest in the two metals above suggest there may be an underlying problem in the Silver’s paper market, and should the Bullion Banks unable to keep issuing new contracts to control the price due to the lack of physical silver as collateral and should they be forced to unwound the short positions, we may see silver’s price continue to rise.
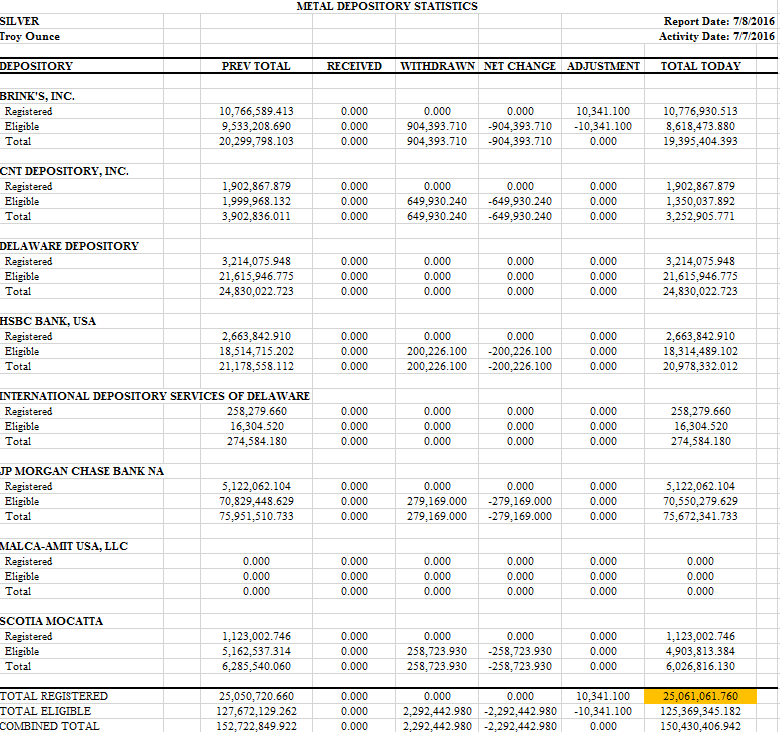
Let’s take a look at Comex silver vault below as of July 8, 2016 to see the physical silver they have as collateral:
The latest Comex silver stock report above is showing only 25 million registered silver (shaded in orange). The Registered category in silver means the silver is fully available for delivery. The eligible category means the silver meets exchange requirements but it’s not available for delivery to contracts. The emphasis on Comex should be the Registered category as this is the only silver that is available for delivery, but in reality the Combined inventory is what matters as the owners of the Eligible category can be forced into converting it into Registered category if it becomes necessary.
We can calculate the leverage that the Bullion Banks takes when issuing paper contracts in Comex against the underlying physical inventory. As shown above, as of July 5th, the COT report shows a total Open Interest of 242,878 contract or approximately 1 billion ounces of silver. If we take 25 million as the actual quantity available for delivery, the leverage is 1 billion / 25 million or 40x leverage. If we take the Combined total inventory as the amount of silver available to delivery, assuming all the Eligible owners are willing to convert their physical silver to Registered Category, then it’s 1 billion / 150 million or 6.7x leverage.
Silver vs Other Metals and Commodities
Looking at silver’s historical price and comparing it to other metals and commodites, silver is perhaps the only commodity which still trades below its 1980’s price. All other metals and commodities have traded above their 1980’s price. See chart below for comparisons:
As can be seen above, Silver remains below 1980 high price of $49.45 (Hunt brother’s cornering of market), while all the other metals and oil have traded above their 1980’s price. We can also see that when the other metals broke above the 1980’s price, they all at least double in price.
In the future, if Silver is able to break above the 1980’s high price of $49.45, are we going to see it at least double in price to $100 as well? Only time will tell.
Take our FREE 14 Day Trial or join our Live Trading Room if you are interested to learn more and find inflection area to trade $XAGUSD, $XAUUSD or other forex, indices, and commodities using Elliottwave technique. We provide Elliott Wave chart in 4 different time frames, up to 4 times a day update in 1 hour chart, two live sessions by our expert analysts, 24 hour chat room moderated by our expert analysts, market overview, and much more!
Back
