Last week, China and the U.S. have agreed to resume face-to-face talk in Washington in early October. It’s however still unclear if both sides can make substantial, even if temporary, agreement to solve their disputes. Nonetheless, the news is a welcome relief to the market with the year-long conflict dampening 2020 growth forecasts. Prior to this progress, there’s a mounting fear that trade wars and other factors such as Brexit can push the global economy into recession.
The trade war escalated last month with the U.S and China both increasing the tariff. By December, almost all of China’s export worth $520 billion will incur a tariff of around 22% on average. Meanwhile, U.S. exports to China will incur an average tariff of 20%. The recent U.S. data has started to show the economic deterioration. For example, the recent ISM purchasing manager index (PMI) fell below 50, signalling a contraction.
Precious metal traders took the opportunity of the good news by taking profit in Gold and Silver. The precious metals have been on a tear this year even after the recent pullback. A combination of factors including slowing economy, geopolitical tension, and negative yielding bonds drive the speculative demand of precious metals up. Below is a Year-to-Date (YTD) Return on different asset categories as of September 9, 2019
| YTD Return | |
| S&P 500 | 20.26% |
| DAX | 16.30% |
| Nikkei | 7.08% |
| Gold | 17.70% |
| Silver | 16.74% |
| 10 Year Notes | 8.10% |
| Dollar Index | 2.37% |
All asset classes is doing well at the time of this writing. Gold and Silver are among the top performers this year even after the recent pullback. Trade war however is not the only driver for Gold and Silver in the long run. Arguably, trade war is not the major driver although it can certainly contribute to the recent rally. In our view, the major driver for the rally in Gold and Silver is the $17 trillion worth of negative yielding bonds.
Negative yielding bonds are recent phenomenon happening only in the past few years after the unprecedented money printing by the central banks. Bonds used to be a risk-free asset category which will perform well when stock market drops. As owning Gold doesn’t give dividends or interest, many investors argue that investing money in banks or bonds is a better alternative to reduce risk as they can get yields. However, with banks around the world offering near zero interest rate and negative yielding bonds, holding Gold now becomes much more attractive. Bond market is also currently arguably in a bubble territory with yields going negative. We have never faced this situation where the risk-free asset category is actually in a bubble. When it finally reverses, then there’s a lack of suitable risk-free asset alternative. Physical Gold can fill this role perfectly as an alternative risk-free asset.
Gold Long Term Elliott Wave Outlook
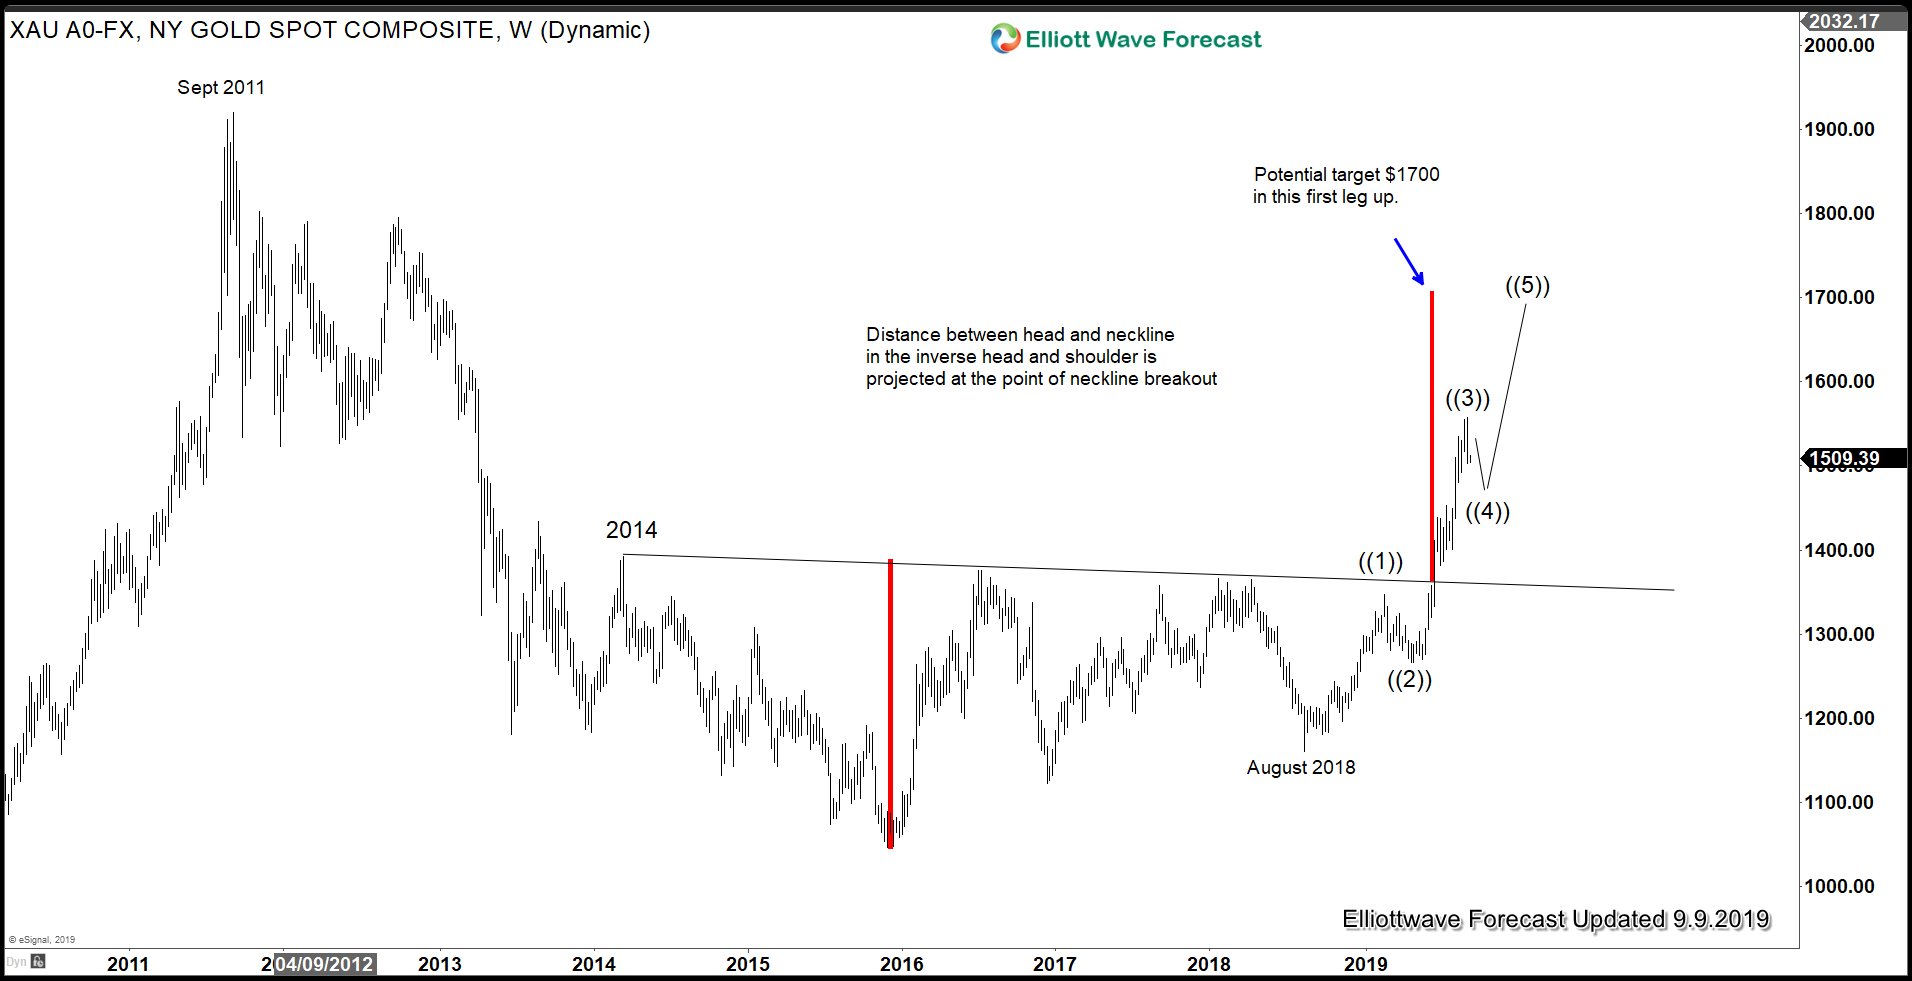
Since breaking above the neckline of the inverse head and shoulders from 2014, Gold has continued to rally sharply. An orthodox target for the move up is calculated by measuring the head of the inverse head and shoulder to the neckline. Then the distance is projected from the point of the breakout of the neckline to get an orthodox target of $1700. The rally from August 2018 low is unfolding as a 5 waves impulse Elliott Wave structure, and the recent pullback is a temporary setback in wave ((4)). Once this pullback is over, the yellow metal should resume higher again.
Gold Elliott Wave Path
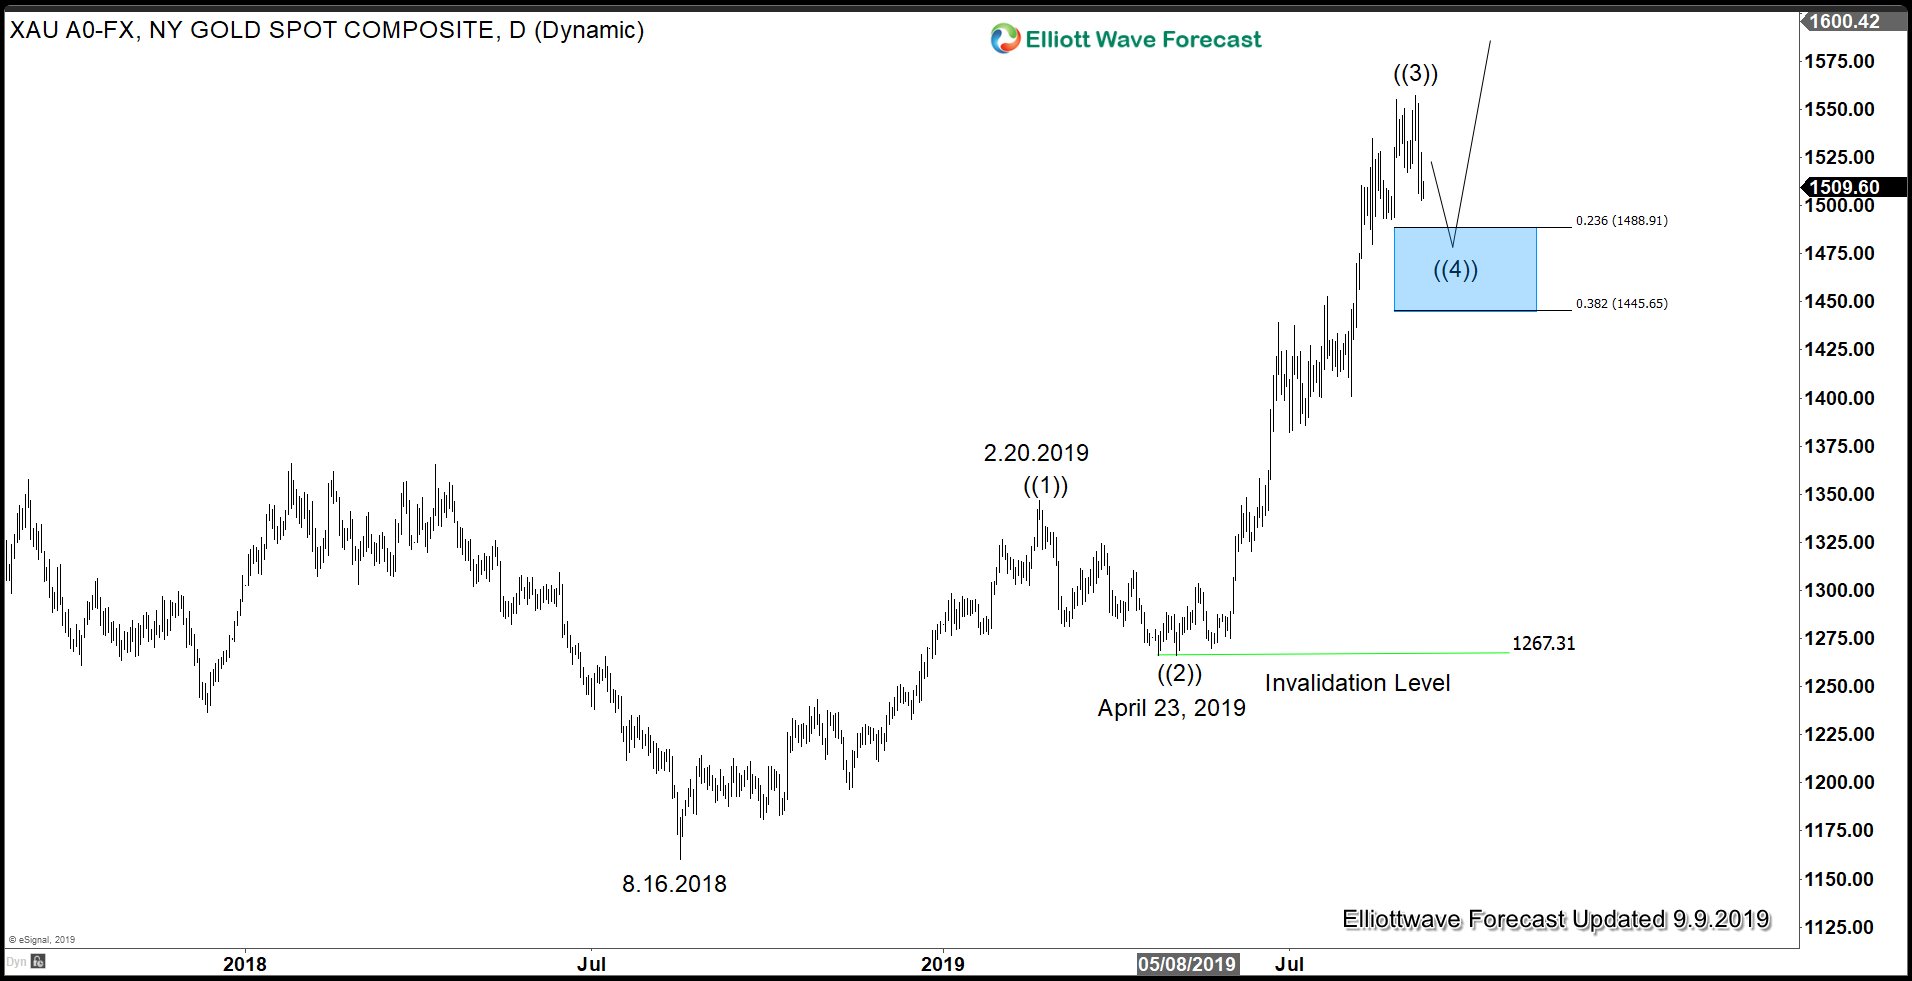
If the current pullback is a wave ((4)), then typically it can end around 23.6 – 38.2% Fibonacci retracement of wave ((3)) which should come at $1445 – $1489. From here, the yellow metal can resume higher again or bounce in 3 waves at least. Please note that we can’t rule out a few weeks / months consolidation in wave ((4)) as wave ((2)) took 2 months to form.
Gold-to-Silver Ratio (GSR) has ended cycle from 2011 low
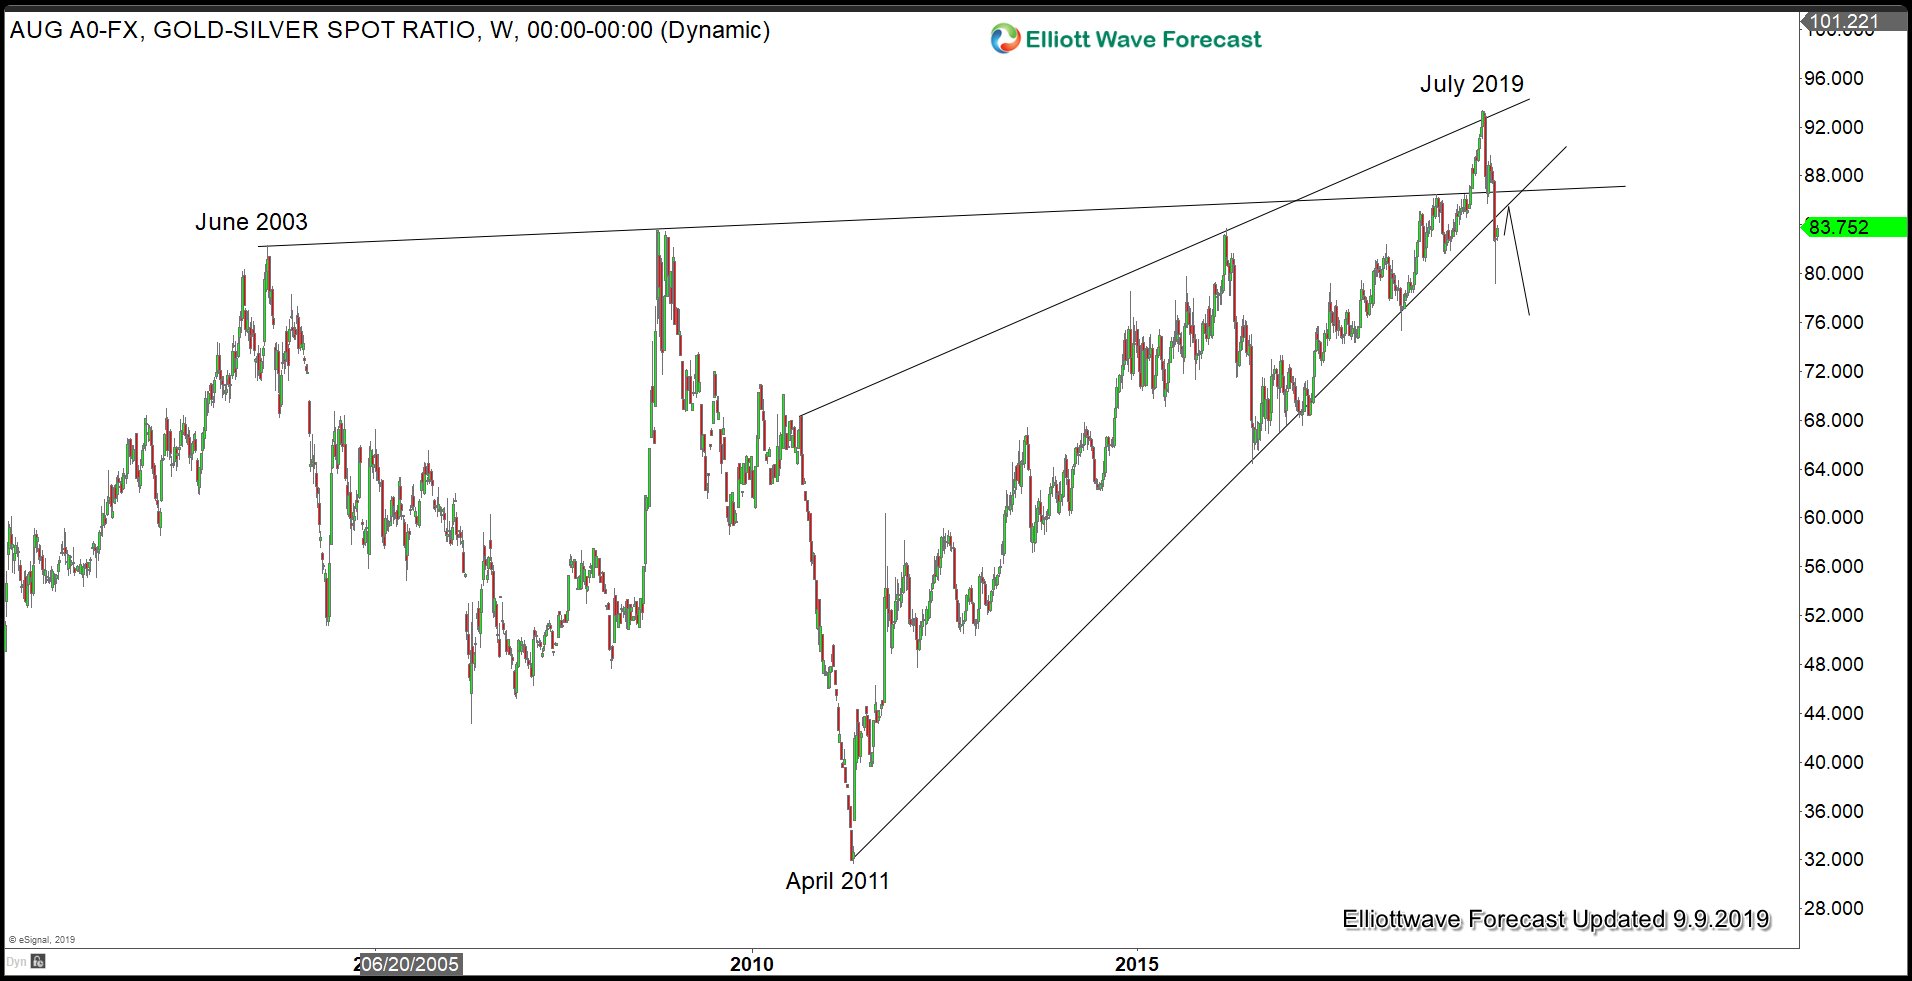
Gold-to-Silver Ratio (GSR) trades inversely with the underlying precious metals (Gold and Silver). When the ratio rises, the price of the underlying metals go down and vice versa. In the above chart, it has decisively broken and closed below April 2011 low trend line and thus the cycle is already over. Now GSR may retest the broken trend line, but it should get rejection and the GSR should continue to extend lower again, further supporting the precious metals.
To see the next update in 78 instrument covering precious metals, forex, indices, commodities, join our 14 days FREE trial.
Back


