
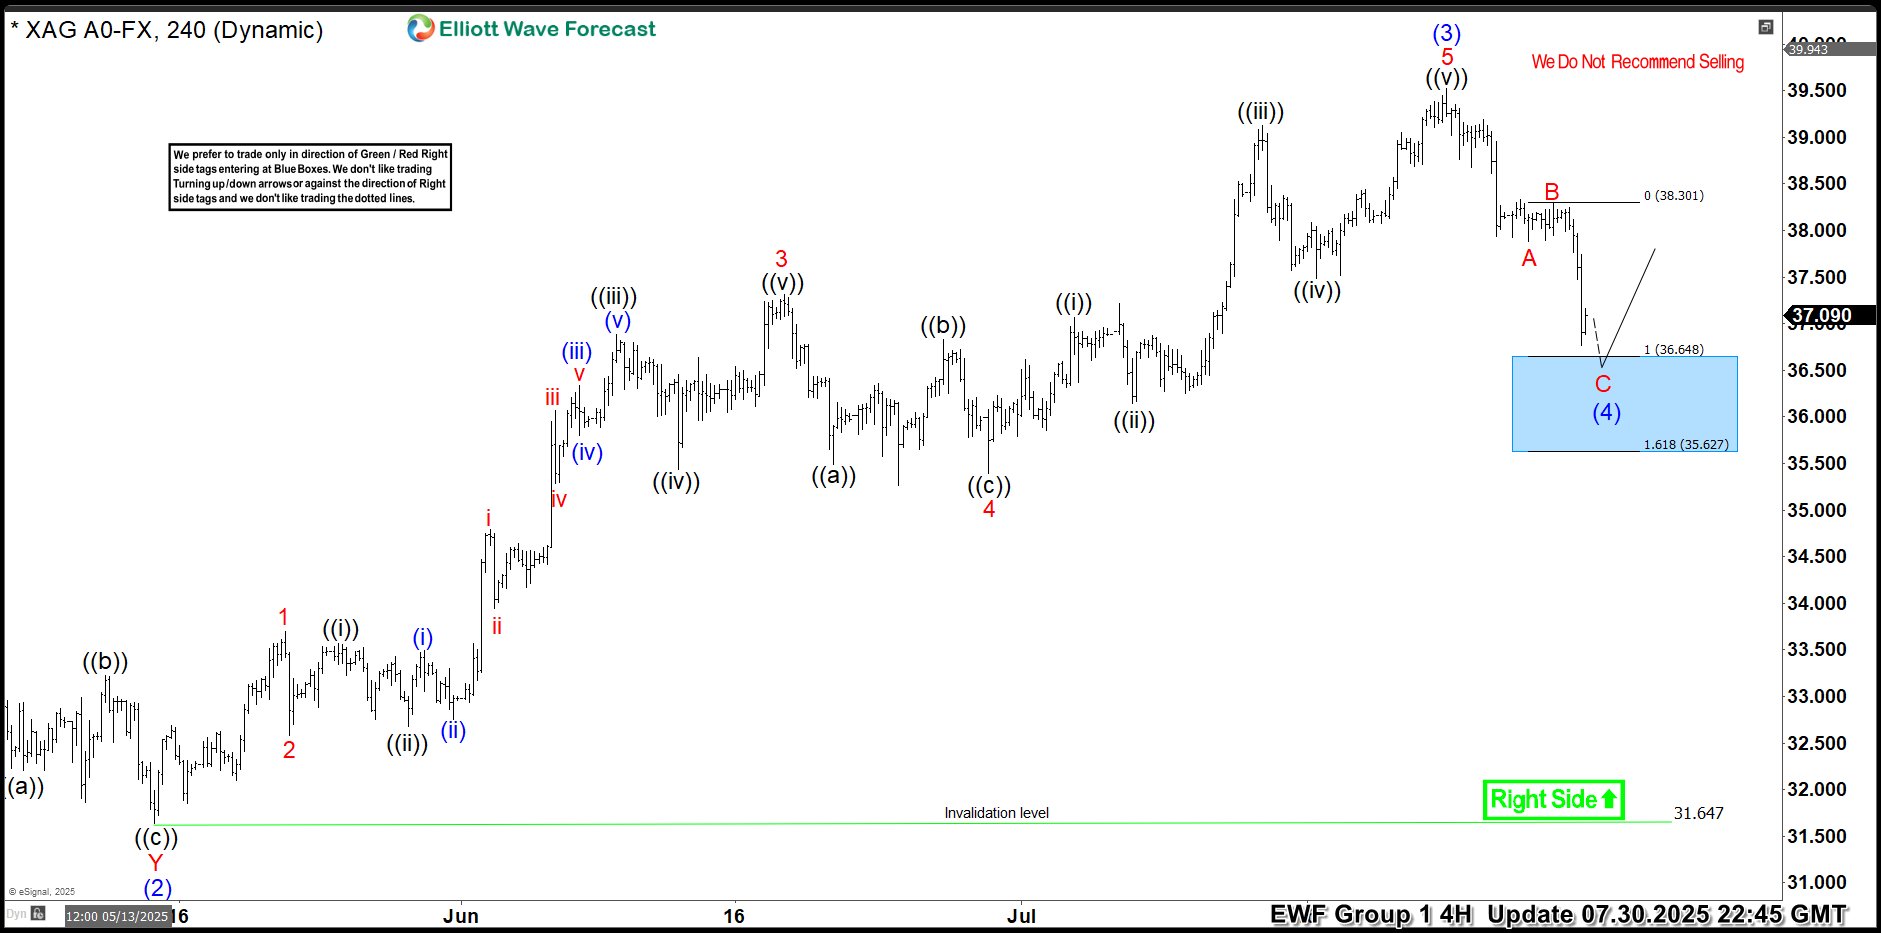
Hello traders. As our members know, we have had many profitable trading setups recently. In this technical article, we are going to talk about another Elliott Wave trading setup we got in Silver (XAGUSD). The commodity has completed its correction exactly at the Equal Legs zone, also known as the Blue Box Area. In this […]
-
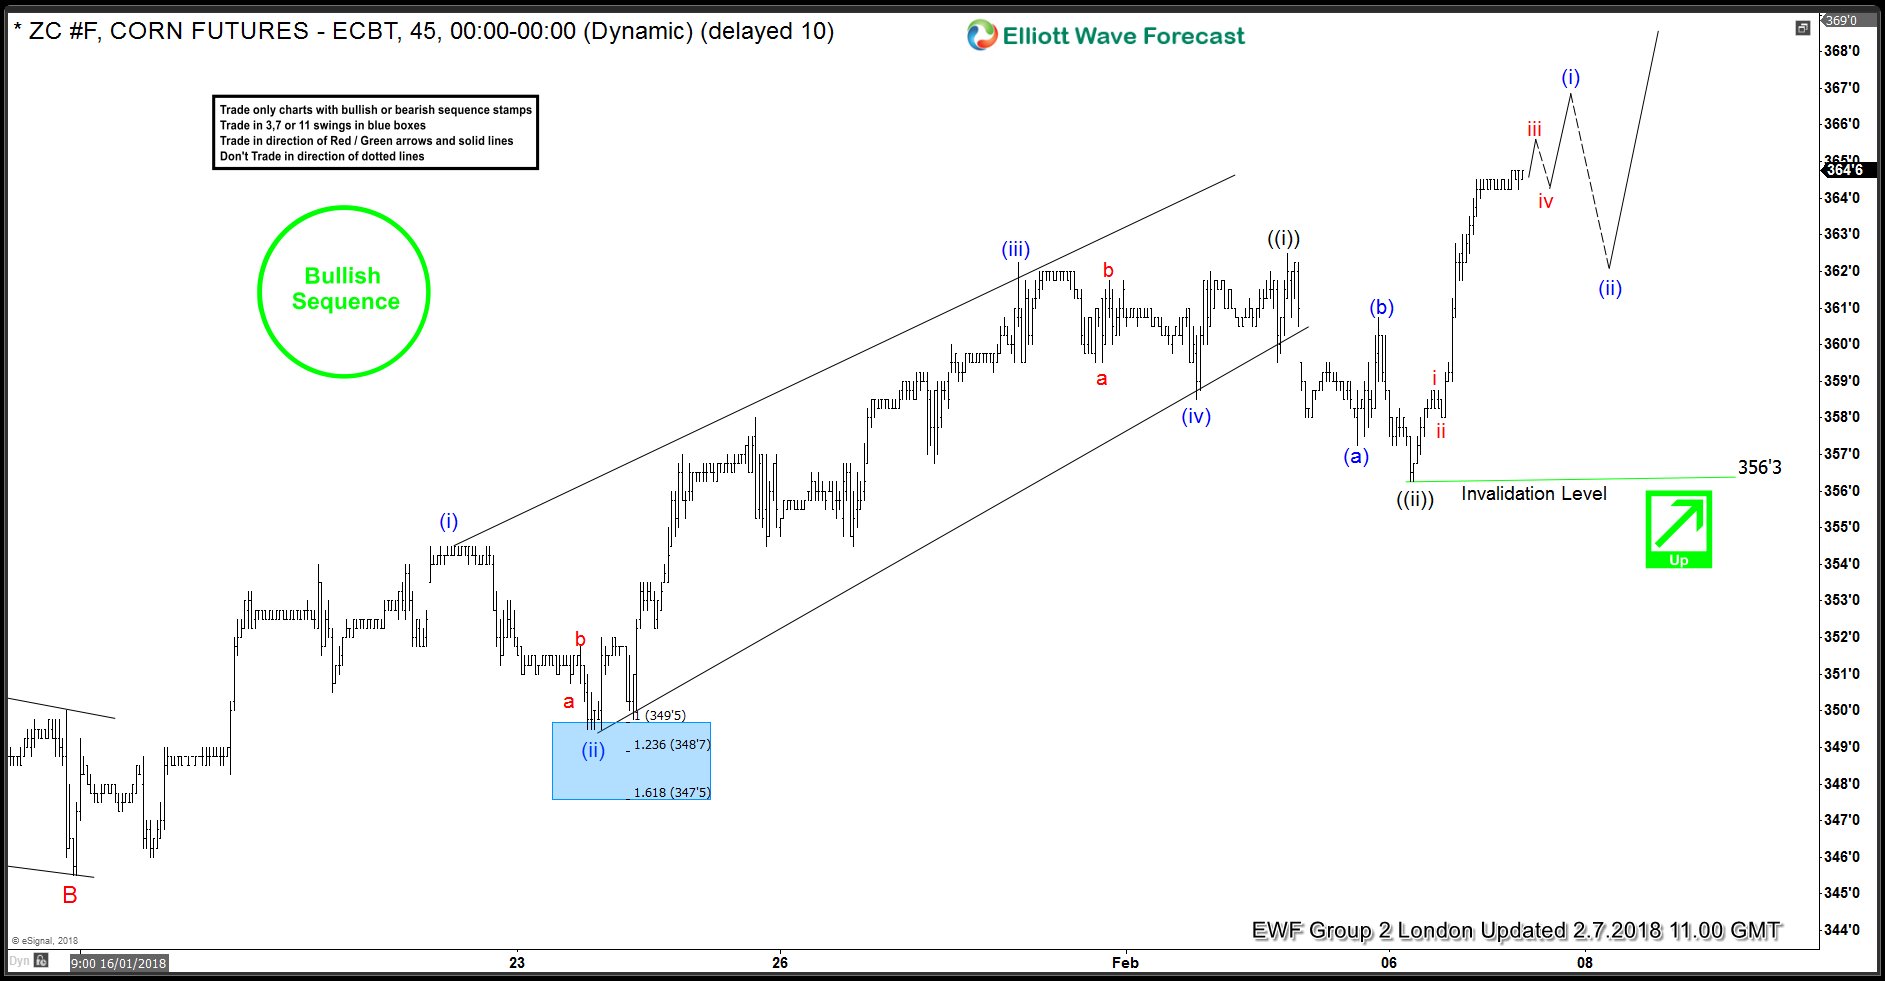
CORN (ZC #F) Futures Impulsive Elliott Wave Rally
Read MoreHello fellow traders, another trade setup we have advised to members recently is Corn Futures.In this technical blog we’re going to take a quick look at the past Elliott Wave charts of ZC #F published in members area of www.elliottwave-forecast.com , explain the forecast and trading setup. As our members know, Corn have had incomplete bullish […]
-
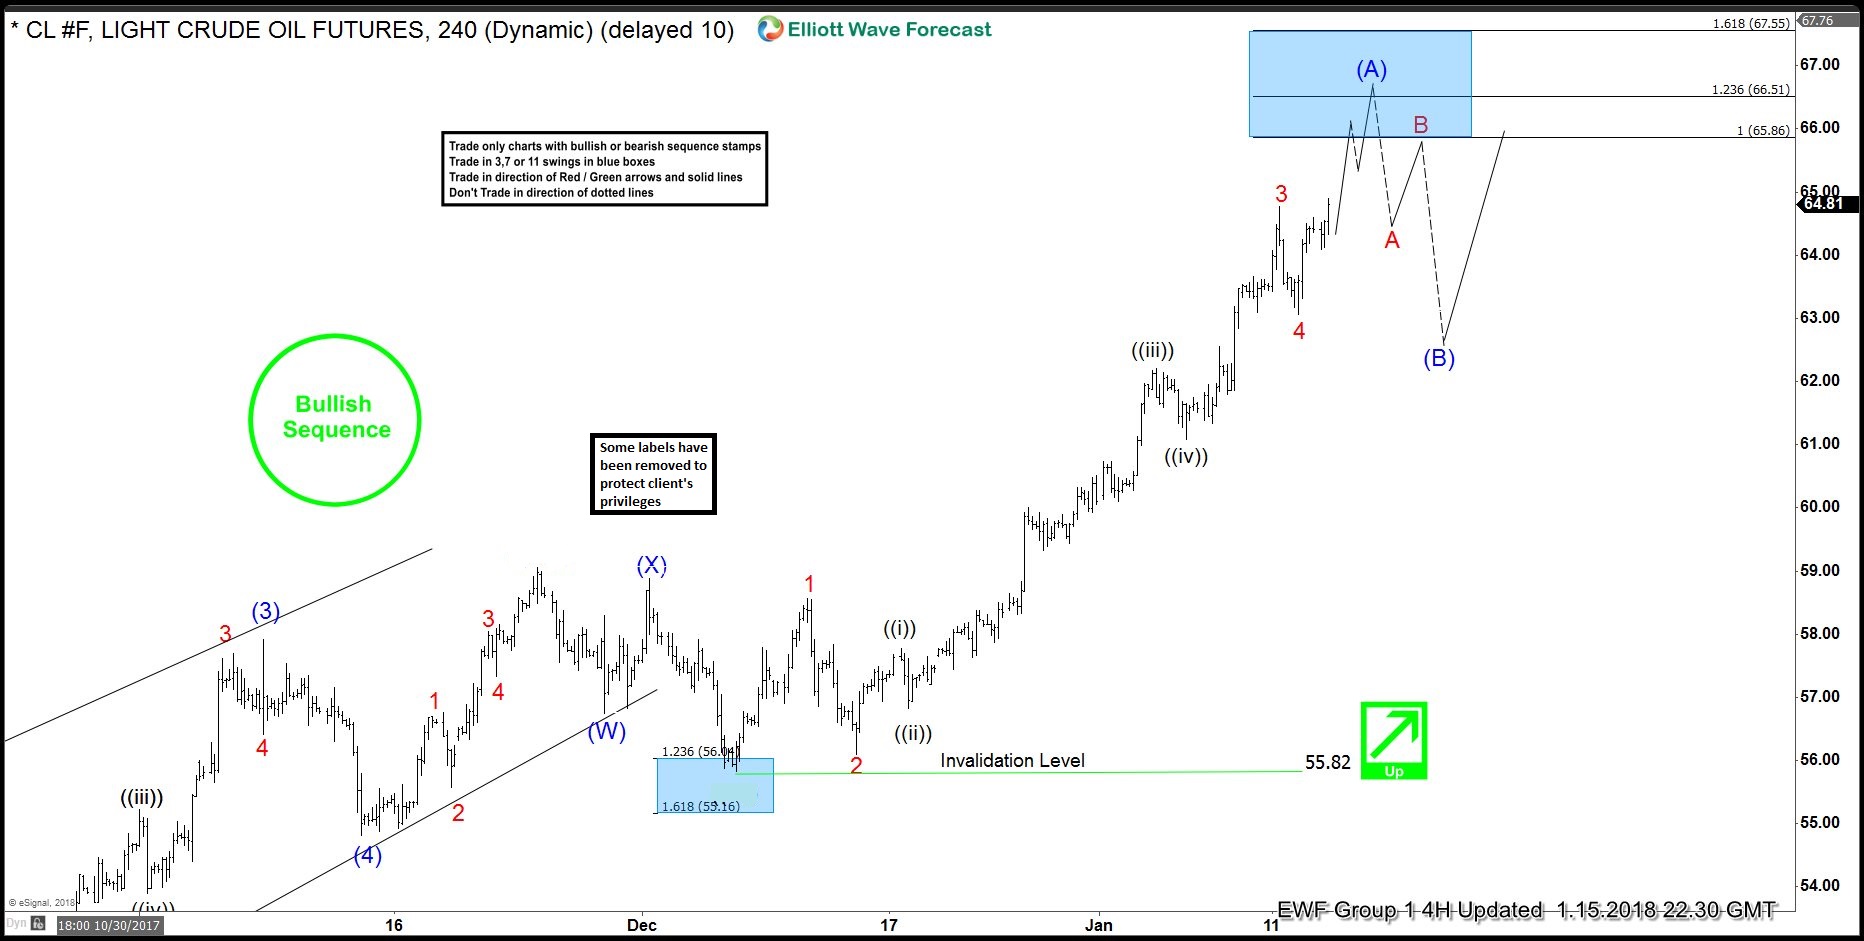
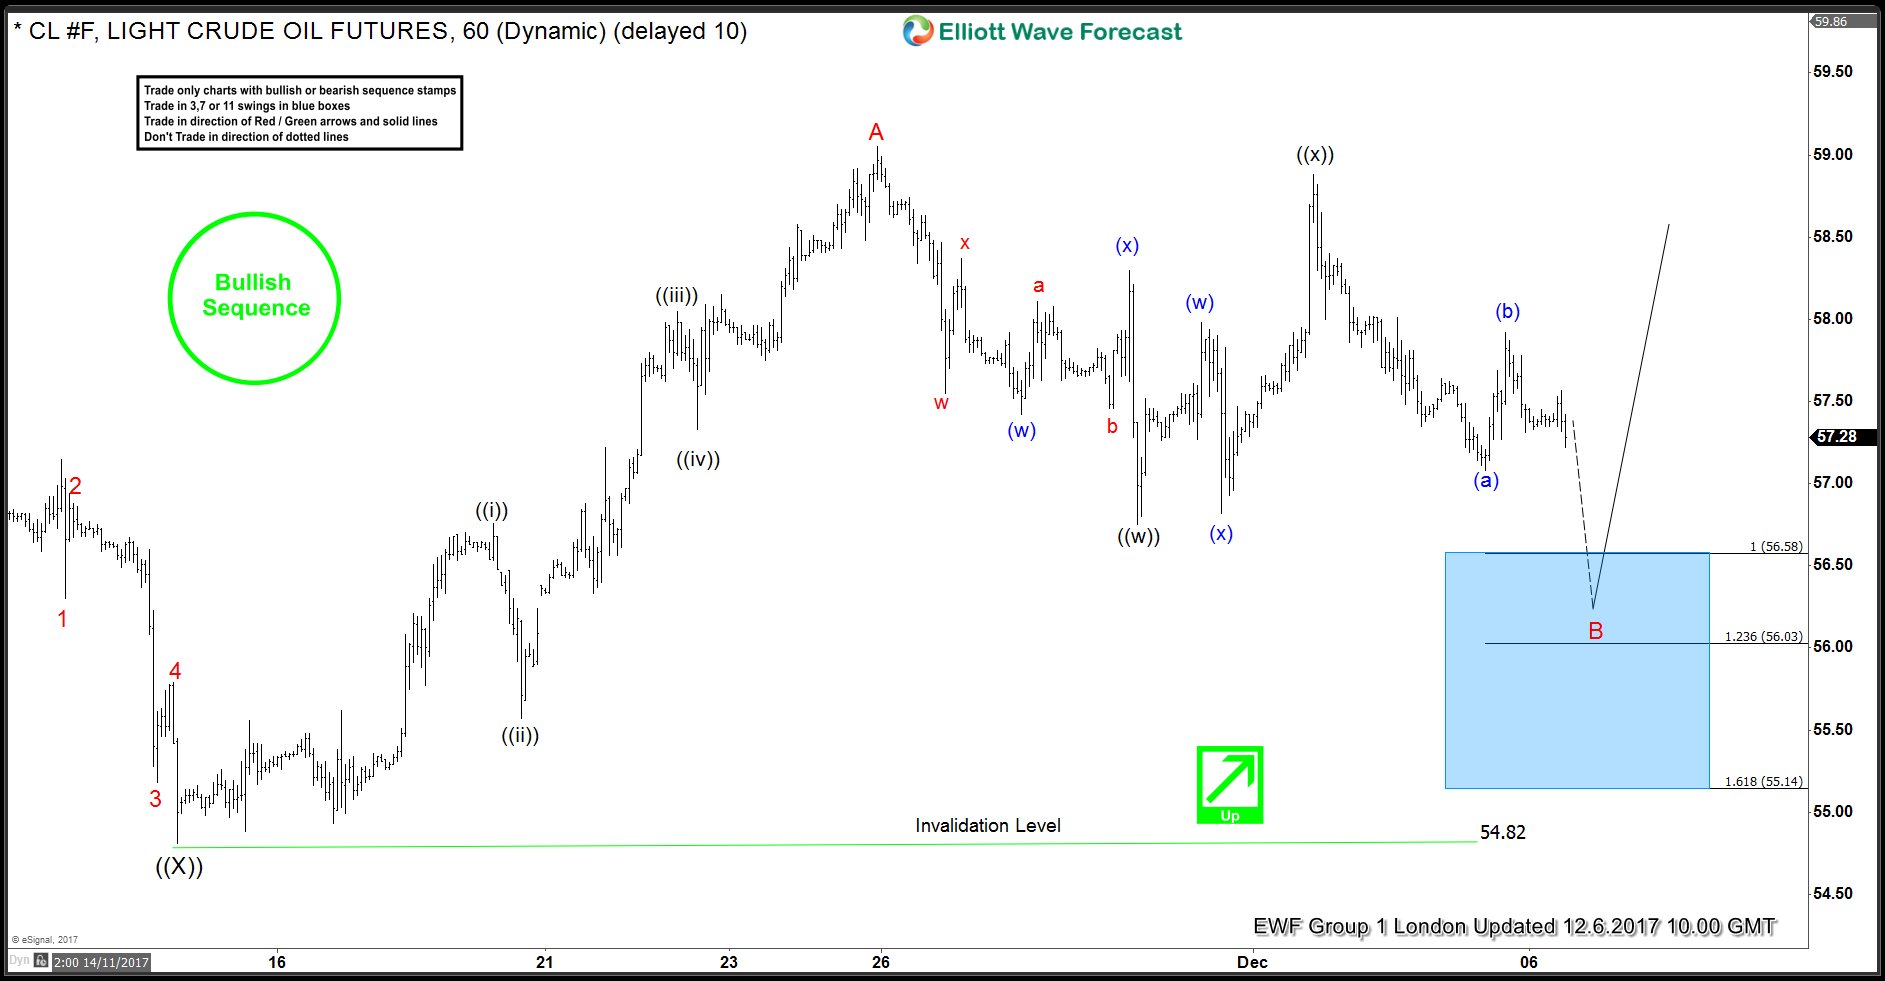
OIL (CL #F) Showing Impulsive Sequence
Read MoreOIL (CL #F) Short-term Elliott Wave view suggests that the rally from 55.82 December 07 low is unfolding as an impulse Elliott Wave structure with extension in 3rd swing higher, where each leg has internal oscillations of 5 waves thus favoring it to be an impulse. These 5 waves move higher should end the Intermediate wave (A) higher in an Impulse sequence. Afterwards, the […]
-
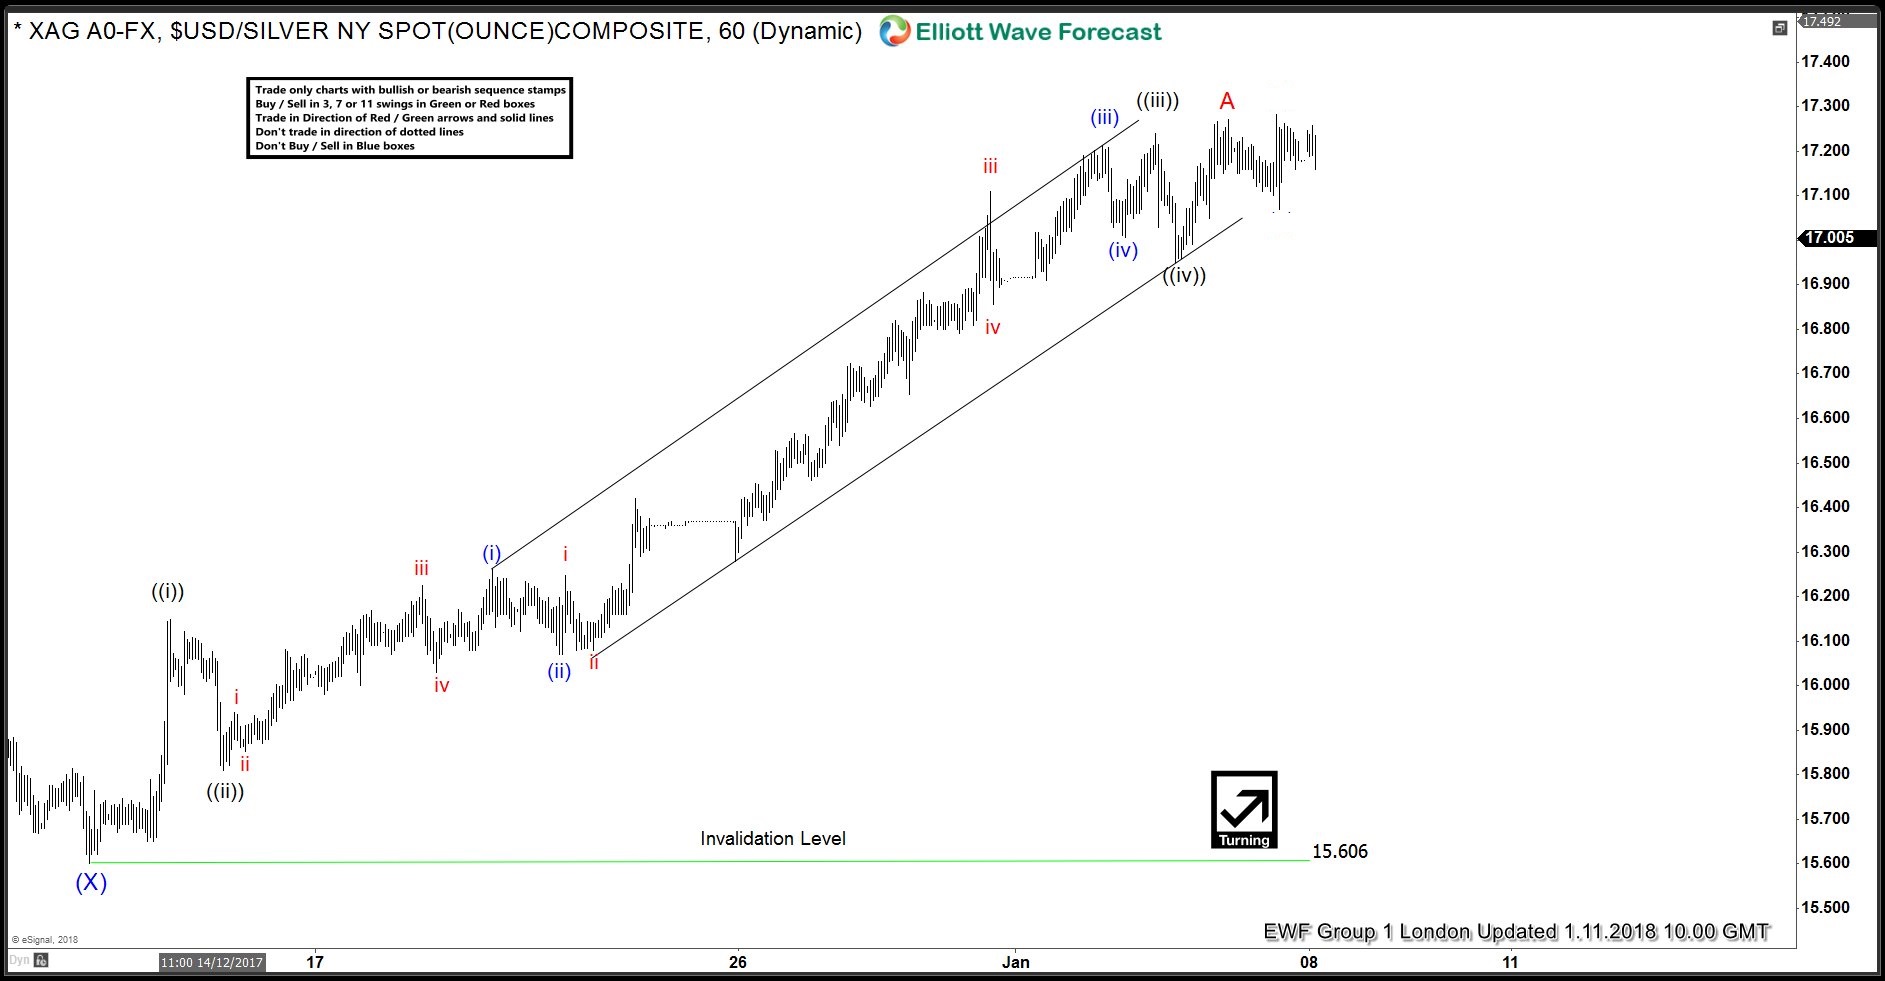
Silver: Impulsive Elliott Wave Rally
Read MoreSilver Short term Elliott Wave view suggests that the decline to December 12.2017 low 15.60 ended Intermediate wave (X). A rally from there is unfolding as an impulse Elliott Wave structure with extension in 3rd swing higher, where each leg has internal oscillations of 5 waves thus favoring it to be an impulse. These 5 waves move higher, either ended Minor wave A in […]
-
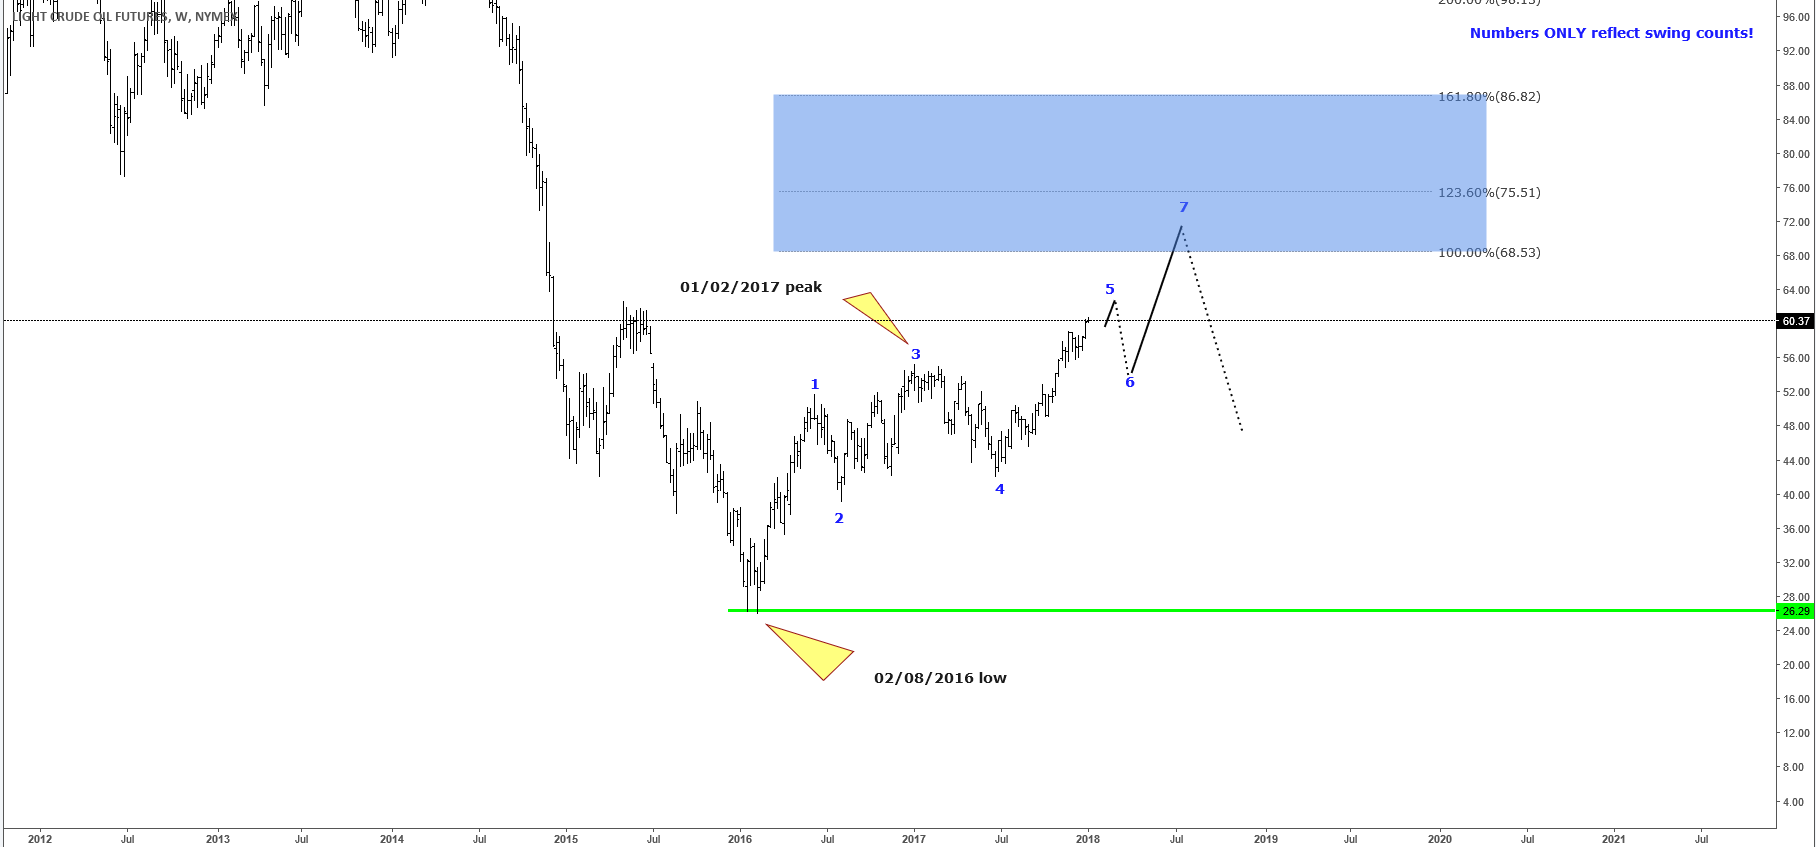
Why Oil Should Be Supported in Weekly Chart
Read MoreHello fellow traders, in this blog post, we will discuss oil in a more bigger picture. In the chart below, you can see crude oil futures on the weekly chart. From the 02/08/2016 low, we can clearly see that the market has a potential 5 swing incomplete bullish sequence. It seems like that it is still […]
-
Gold is Ready for New Rally
Read MoreGold closed above $1,300 per ounce for the first time in 5 years as the U.S. dollar saw it’s worst decline over the past 14 years. Despite a strong start in 2017, XAUUSD spent most of the year in a sideways range around $1250 area before the final bounce came by year end to allow the precious metal to […]
-
OIL (CL #F) Forecasting The Rally & Buying The Dips
Read MoreHello fellow traders. In this technical blog we’re going to take a quick look at the past Elliott Wave charts of OIL (CL #F) published in members area of www.elliottwave-forecast.com. We’re going to explain the Elliott Wave forecast and our trading strategy. As our members know , we were keep saying that OIL is trading within […]