
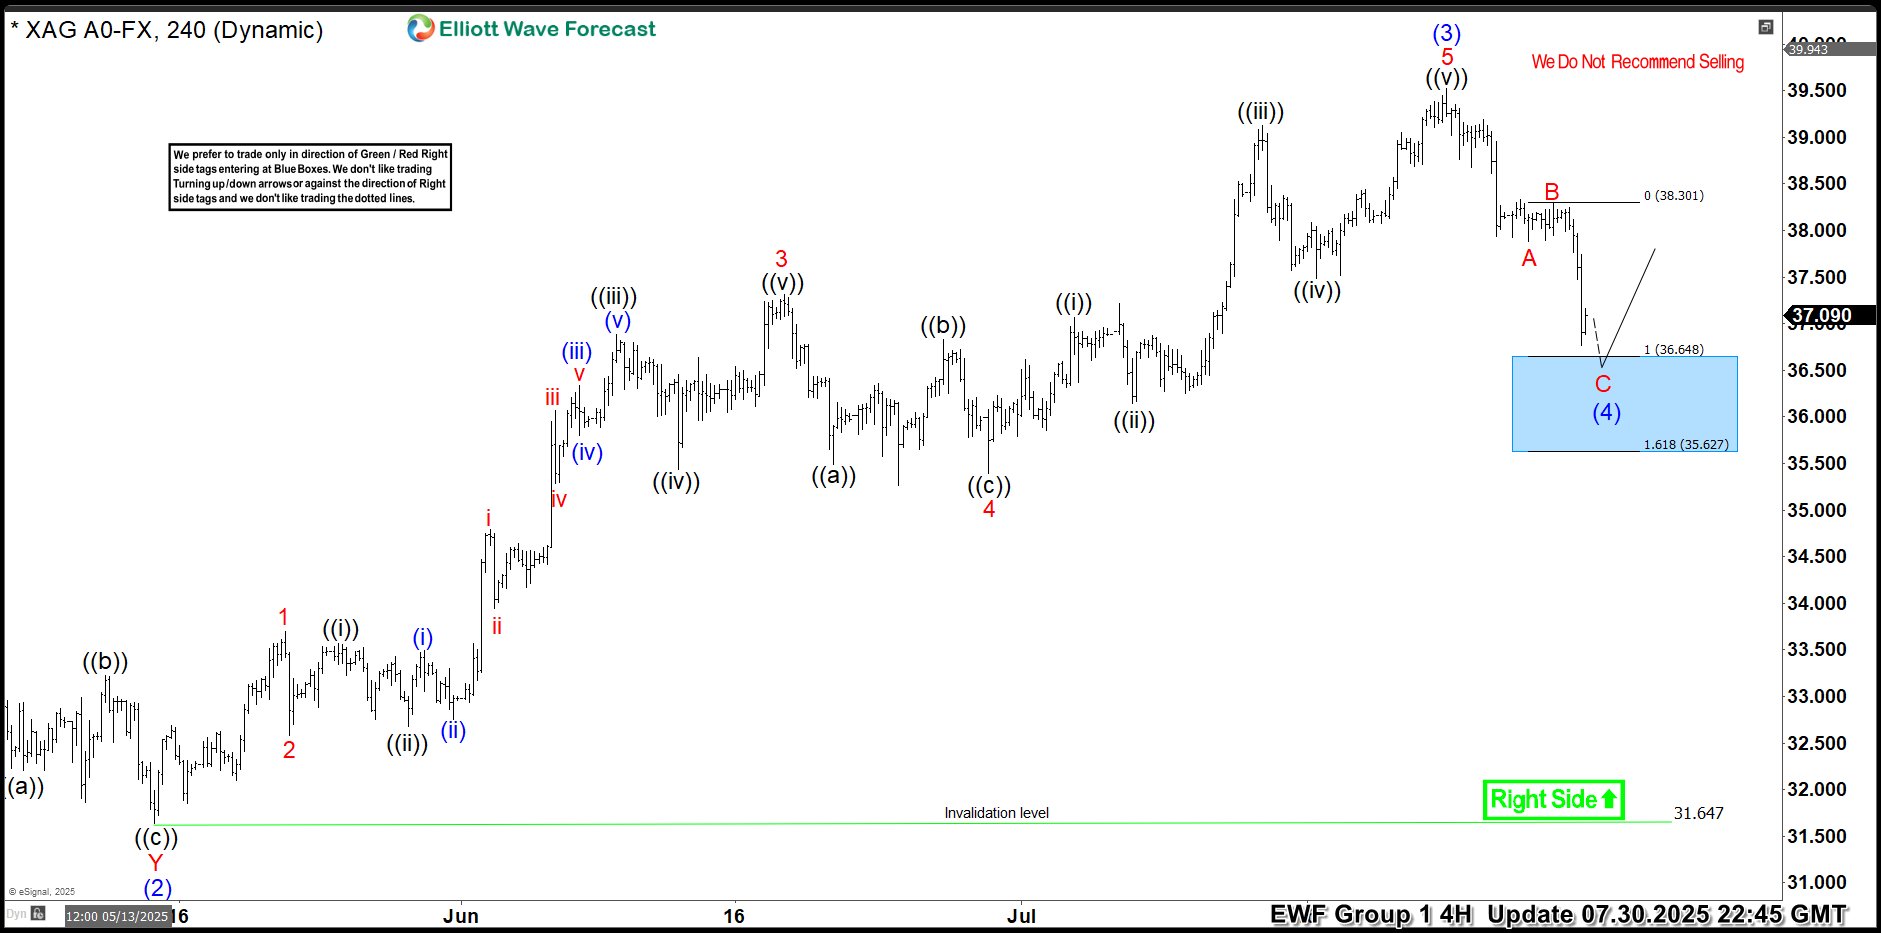
Hello traders. As our members know, we have had many profitable trading setups recently. In this technical article, we are going to talk about another Elliott Wave trading setup we got in Silver (XAGUSD). The commodity has completed its correction exactly at the Equal Legs zone, also known as the Blue Box Area. In this […]
-
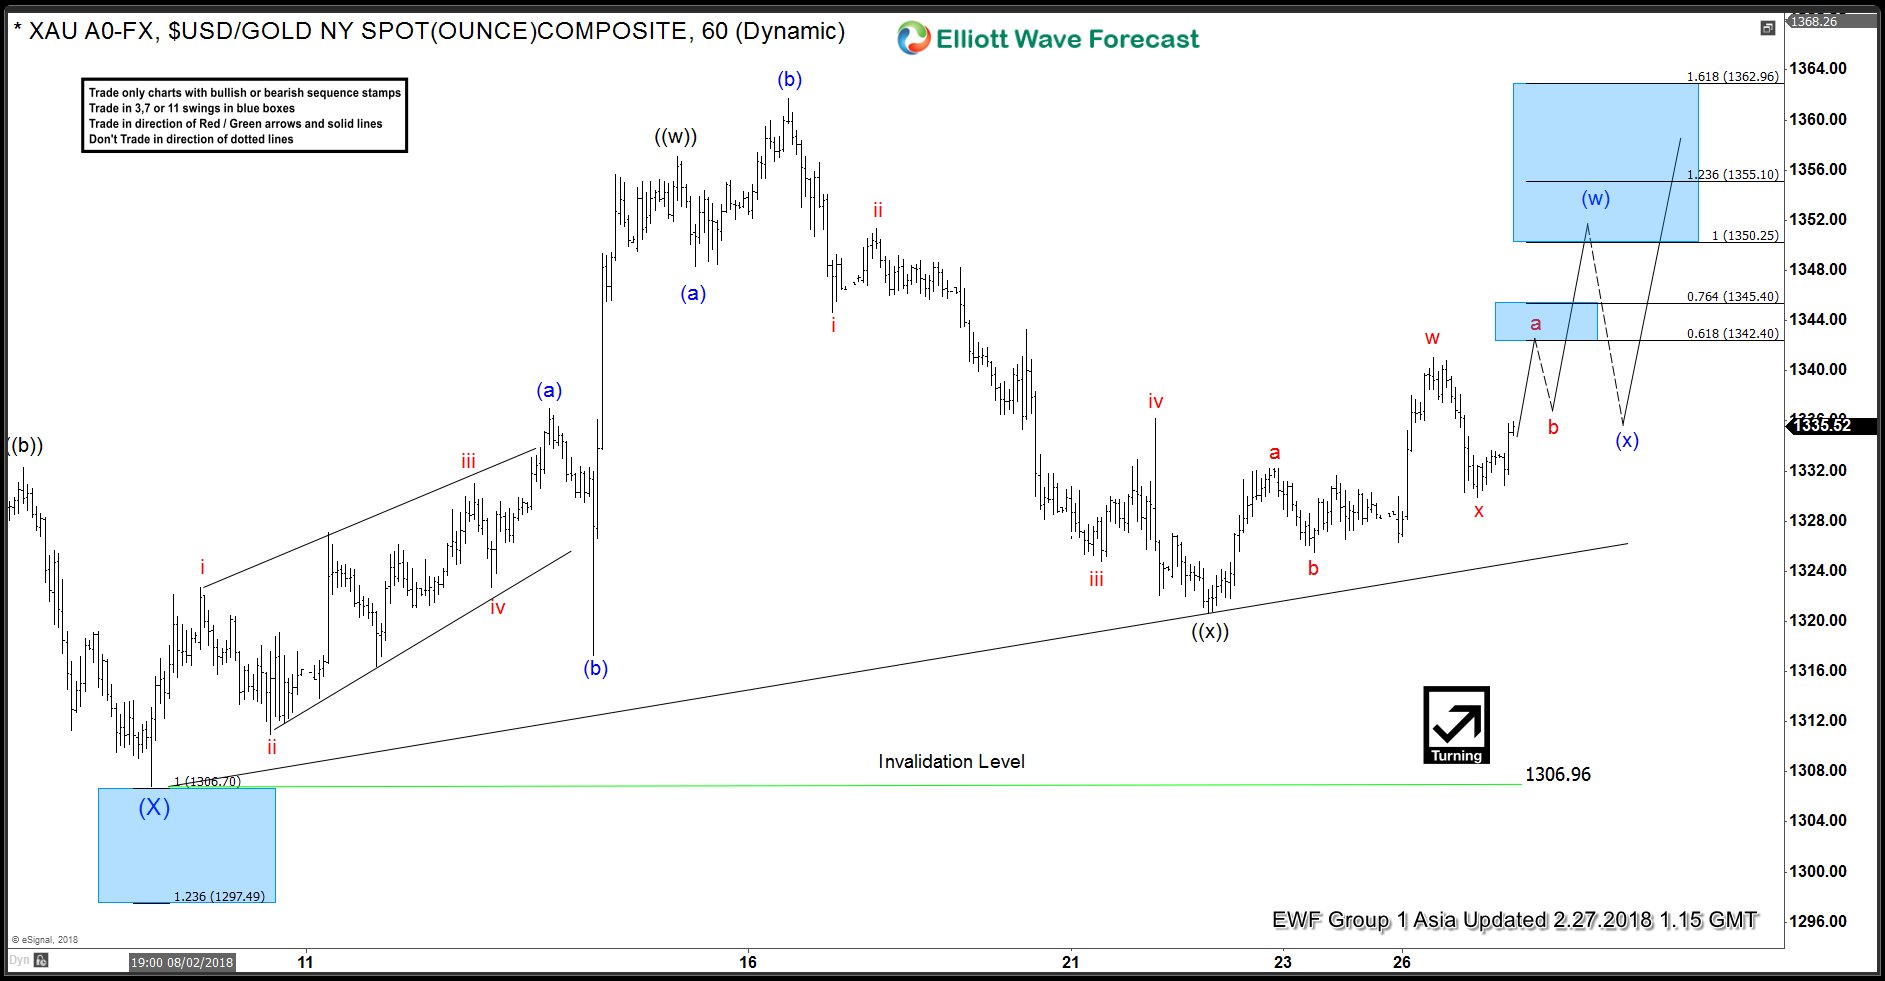
Gold Elliott Wave Analysis: 2.27.2018
Read MoreShort Term Elliott Wave view in Gold suggests the decline to $1306.8 ended Intermediate wave (X). However, the yellow metal needs to break above Intermediate wave (W) at $1366.06 to rule out the possibility of a double correction in wave (X). Up from $1306.8, the rally is proposed to be unfolding as a double three Elliott Wave […]
-
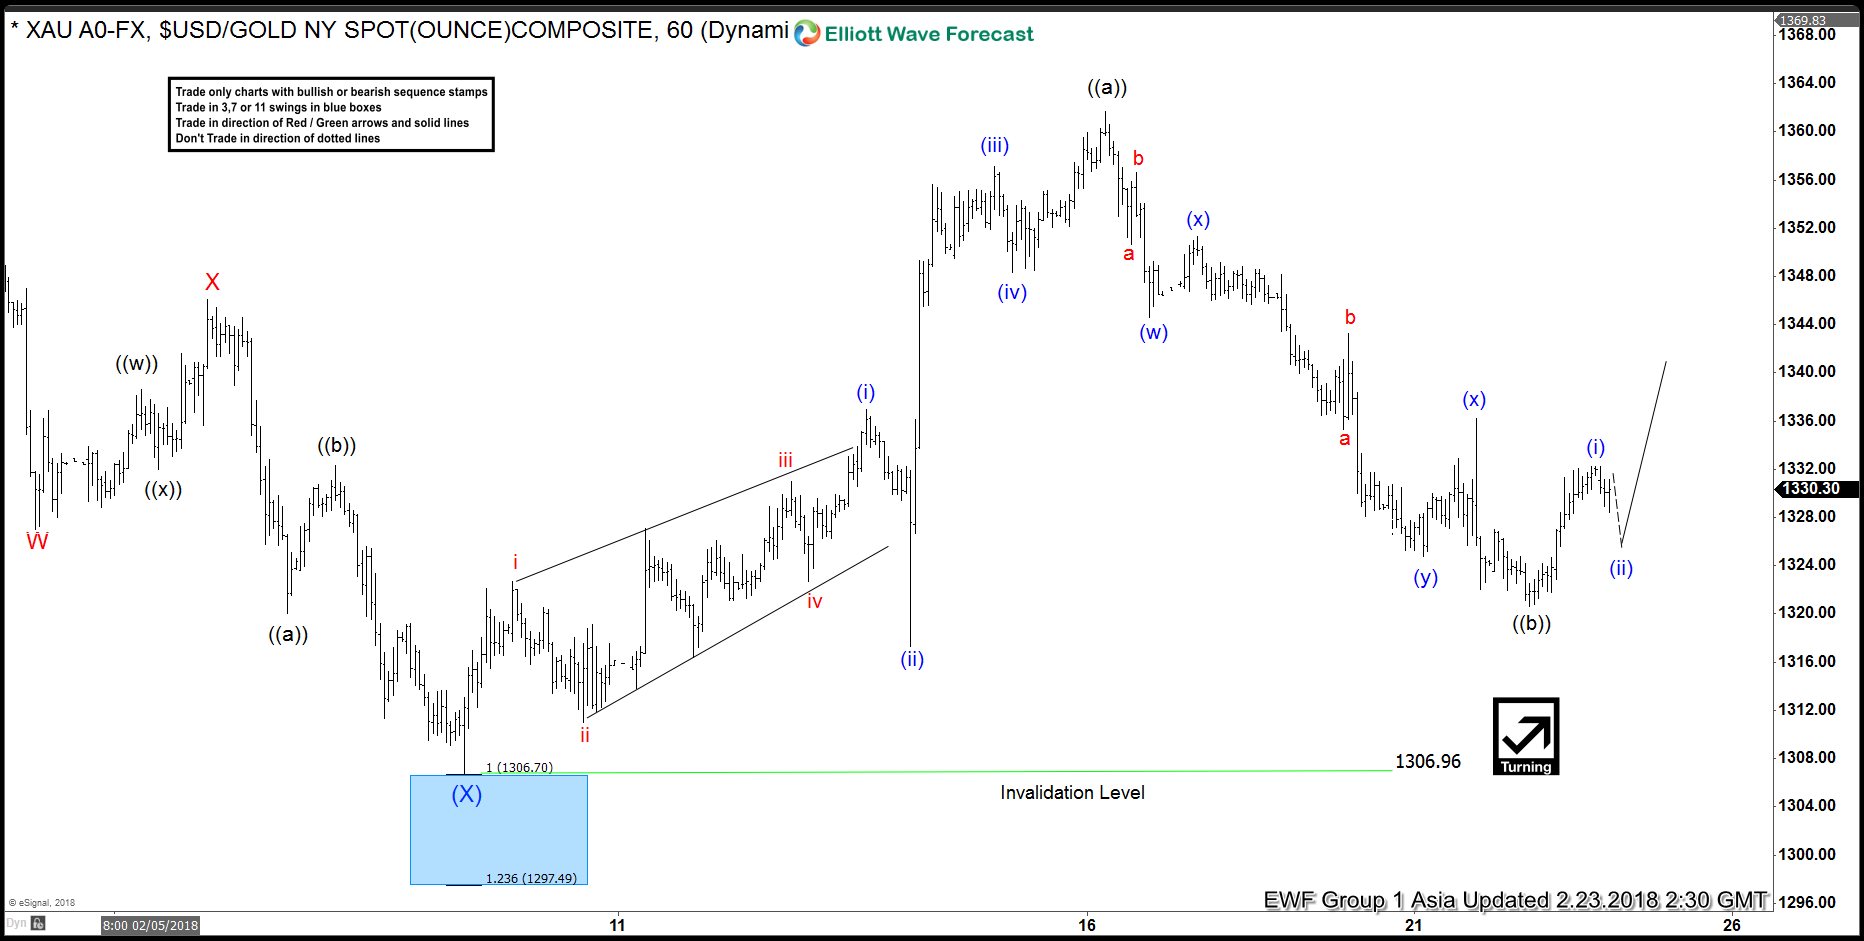
Elliott Wave Analysis: Gold Ended Correction
Read MoreWe revise our Gold Short Term Elliott Wave view to a more aggressive one and call the decline to 2.8.2018 at $1306.8 ending Intermediate wave (X). For this view to get validity however, the yellow metal needs to break above Intermediate wave (W) at $1366.06. Until then, the alternate view can’t be ruled out that the […]
-
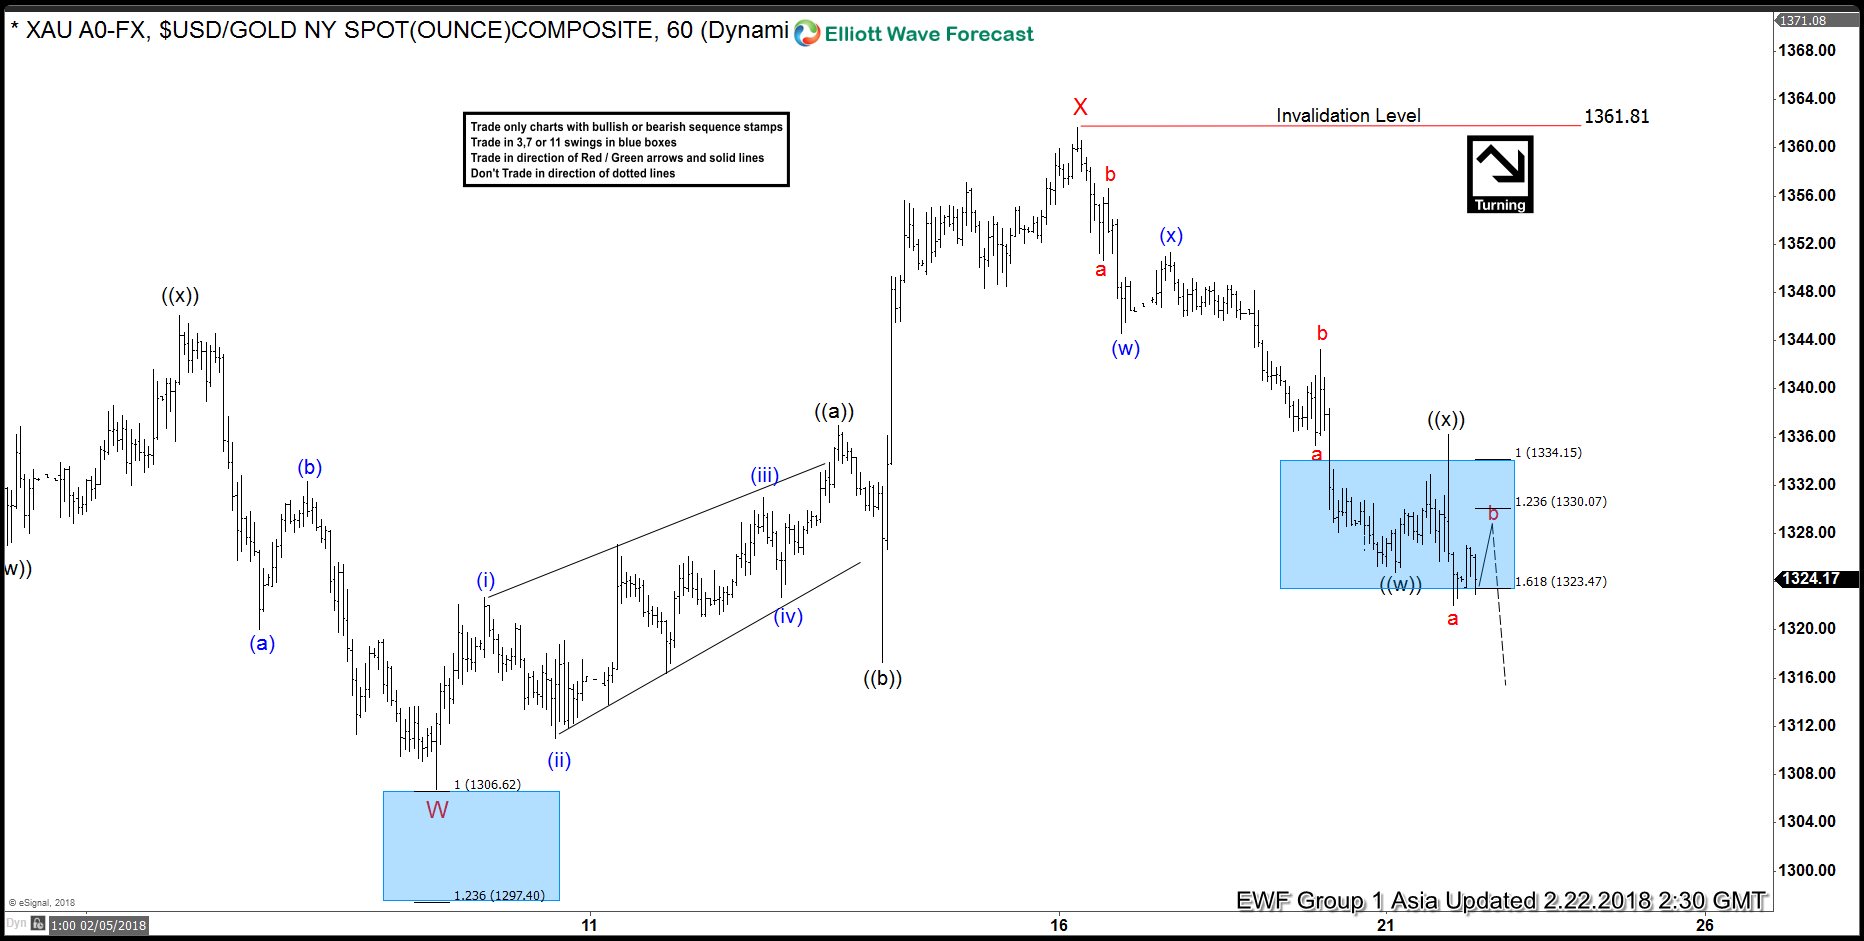
Elliott Wave Analysis: Gold Can do a Double Correction
Read MoreGold Short Term Elliott Wave view suggests that the yellow metal is still correcting cycle from 12.13.2017 low ($1236.30) as a double three Elliott Wave structure. Down from 1.25.2018 high ($1366.06), the decline is unfolding as a double three where Minor wave W ended at $1306.96 and Minor wave X bounce ended at $1361.81. Minor wave […]
-
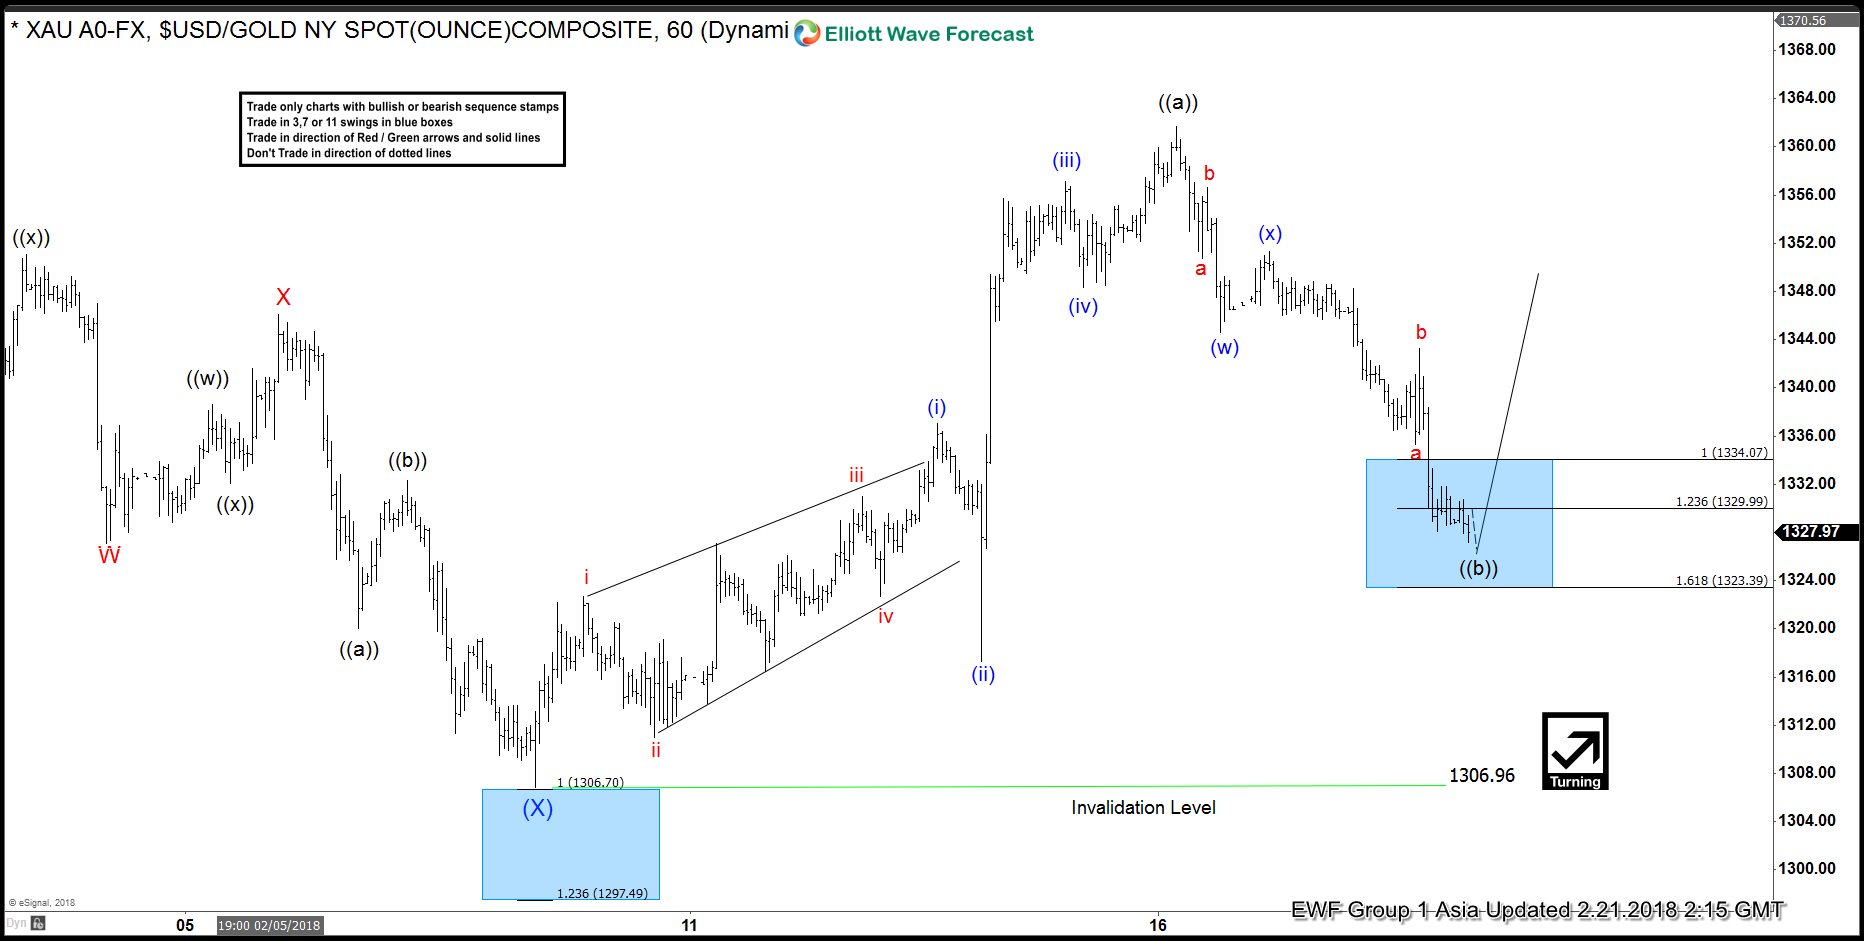
Elliott Wave Analysis: Gold Ending Correction
Read MoreGold Short Term Elliott Wave view suggests that the decline to 1306.96 ended Intermediate wave (X). The rally from there is unfolding in 5 waves impulse Elliott Wave structure. Minutte wave (i) ended at 1337, Minutte wave (ii) ended at 1317.27, Minutte wave (iii) ended at 1357.12, Minutte wave (iv) ended at 1348.30, and Minutte wave (v) […]
-
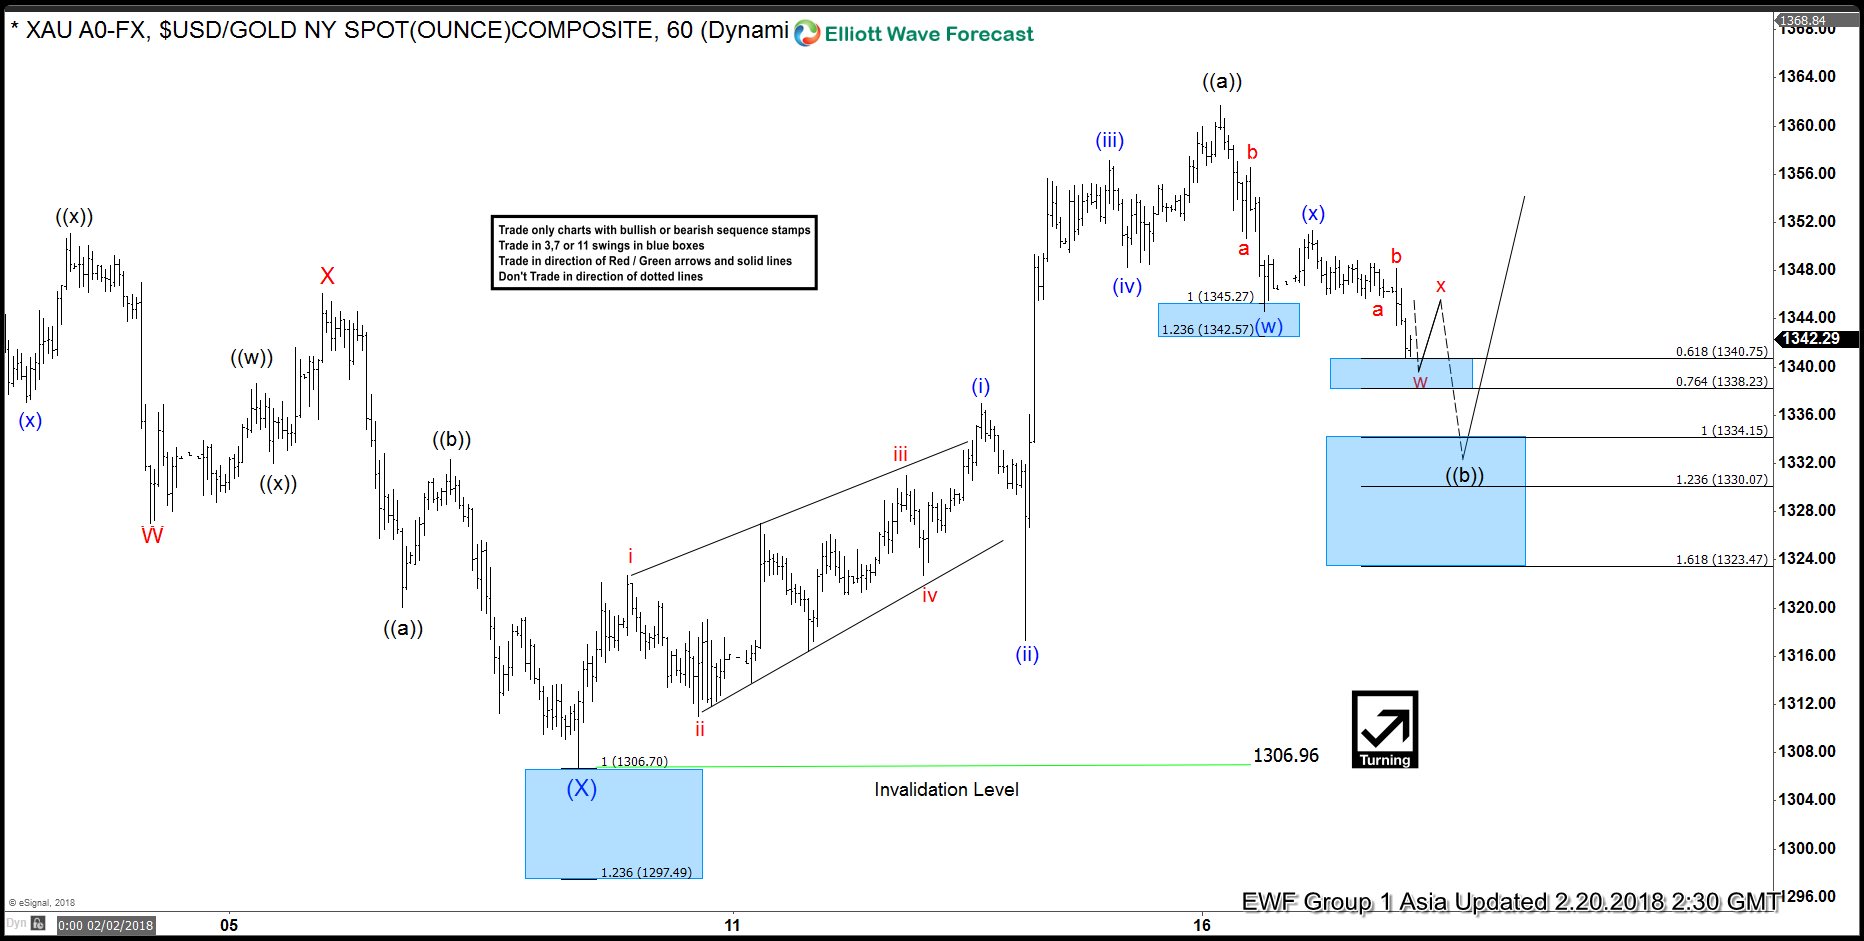
Elliott Wave Analysis: Gold Favored Higher Against 1306.96
Read MoreGold Short Term Elliott Wave view suggests that Intermediate wave (X) ended with the decline to 1306.96. Up from there, the yellow metal is rallying in 5 waves impulse Elliott Wave structure where Minutte wave (i) ended at 1337, Minutte wave (ii) ended at 1317.27, Minutte wave (iii) ended at 1357.12, Minutte wave (iv) ended at […]
-
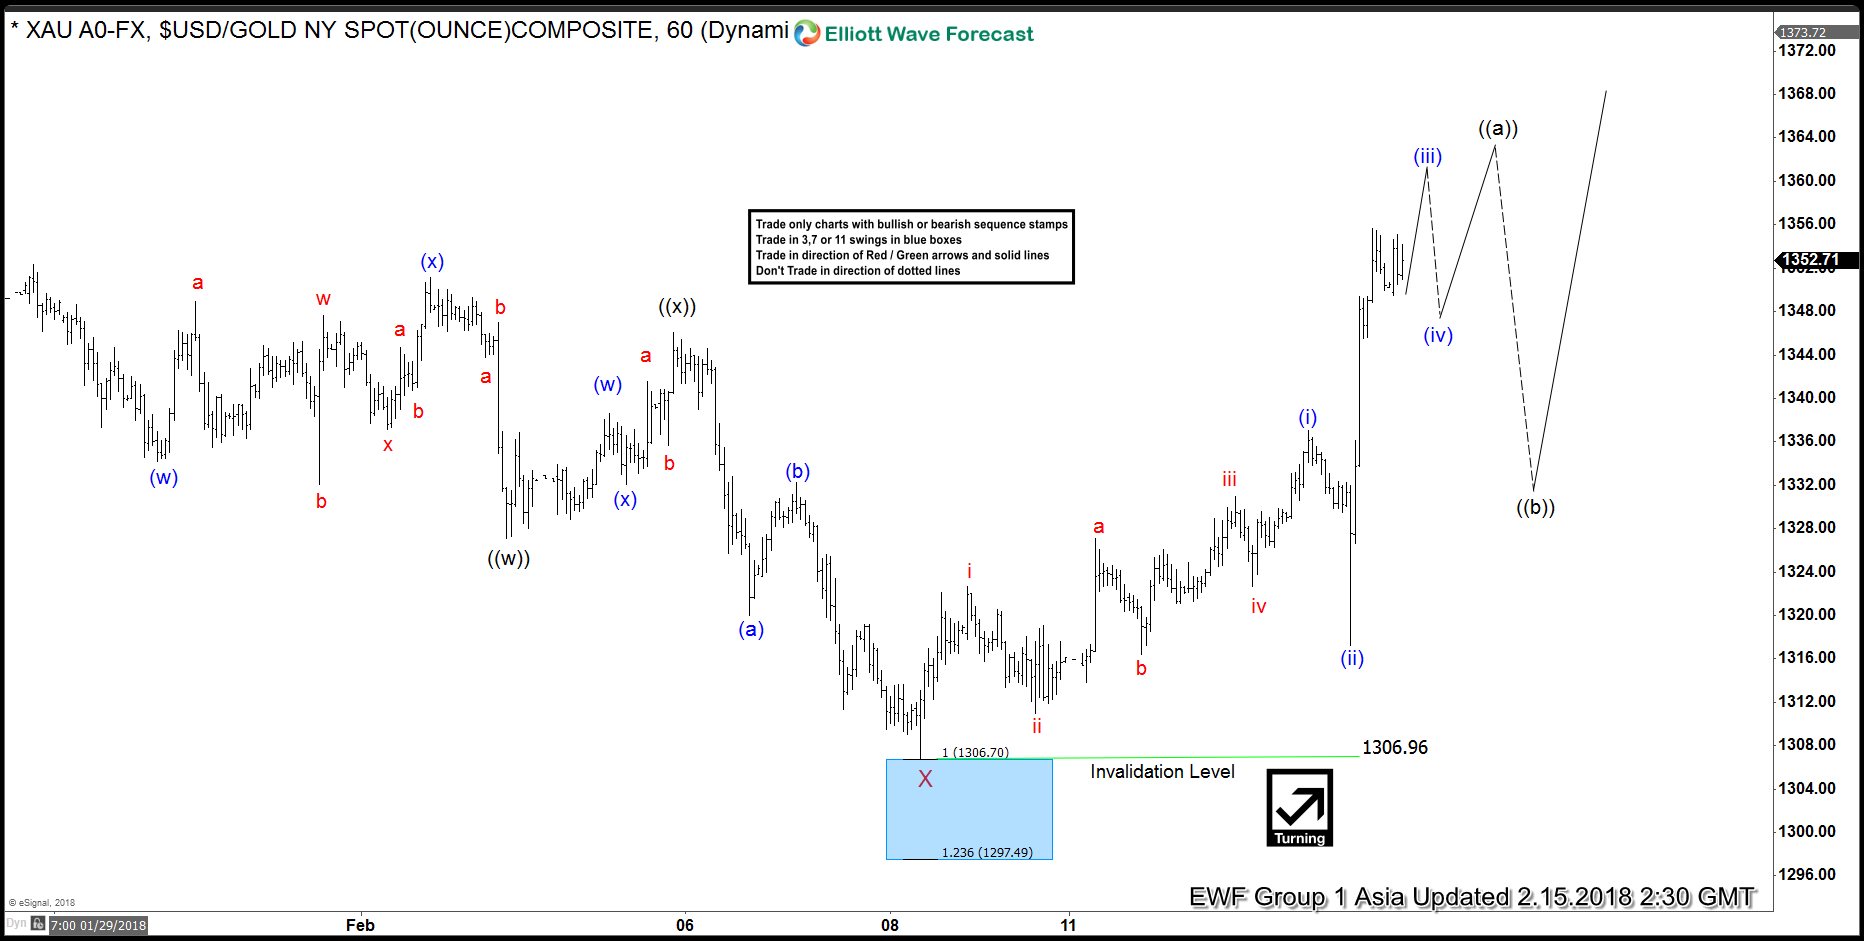
Elliott wave Analysis: Gold renews the Path to $1450
Read MoreGold Short-term Elliott Wave view suggests that the decline from January 25.2017 high (1365.96) to February 08.2018 low ended Minor wave X at 1306.96 low. After reaching the 100%-123.6% Fibonacci extension area of ((w))-((x)) at 1306.70-1297.49 area. When internals in Minor wave X unfolded as Elliott Wave Double Three Structure, where each leg had an internal distribution of 3-3-3 […]