
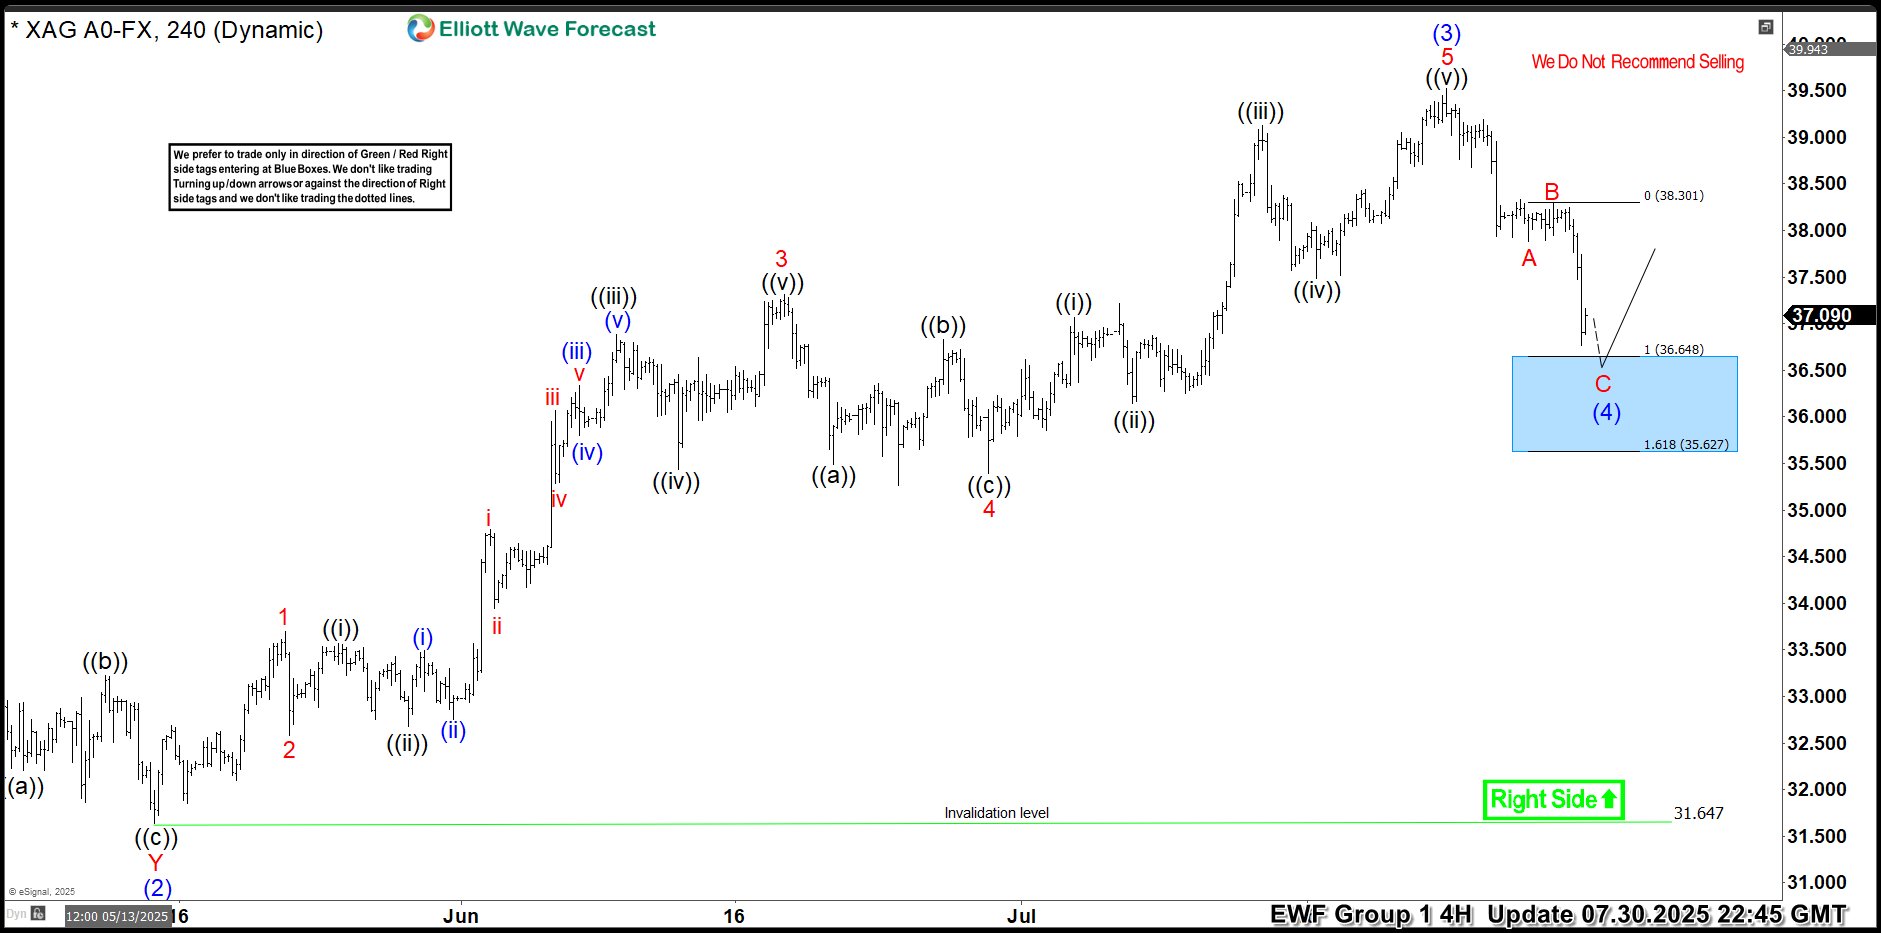
Hello traders. As our members know, we have had many profitable trading setups recently. In this technical article, we are going to talk about another Elliott Wave trading setup we got in Silver (XAGUSD). The commodity has completed its correction exactly at the Equal Legs zone, also known as the Blue Box Area. In this […]
-
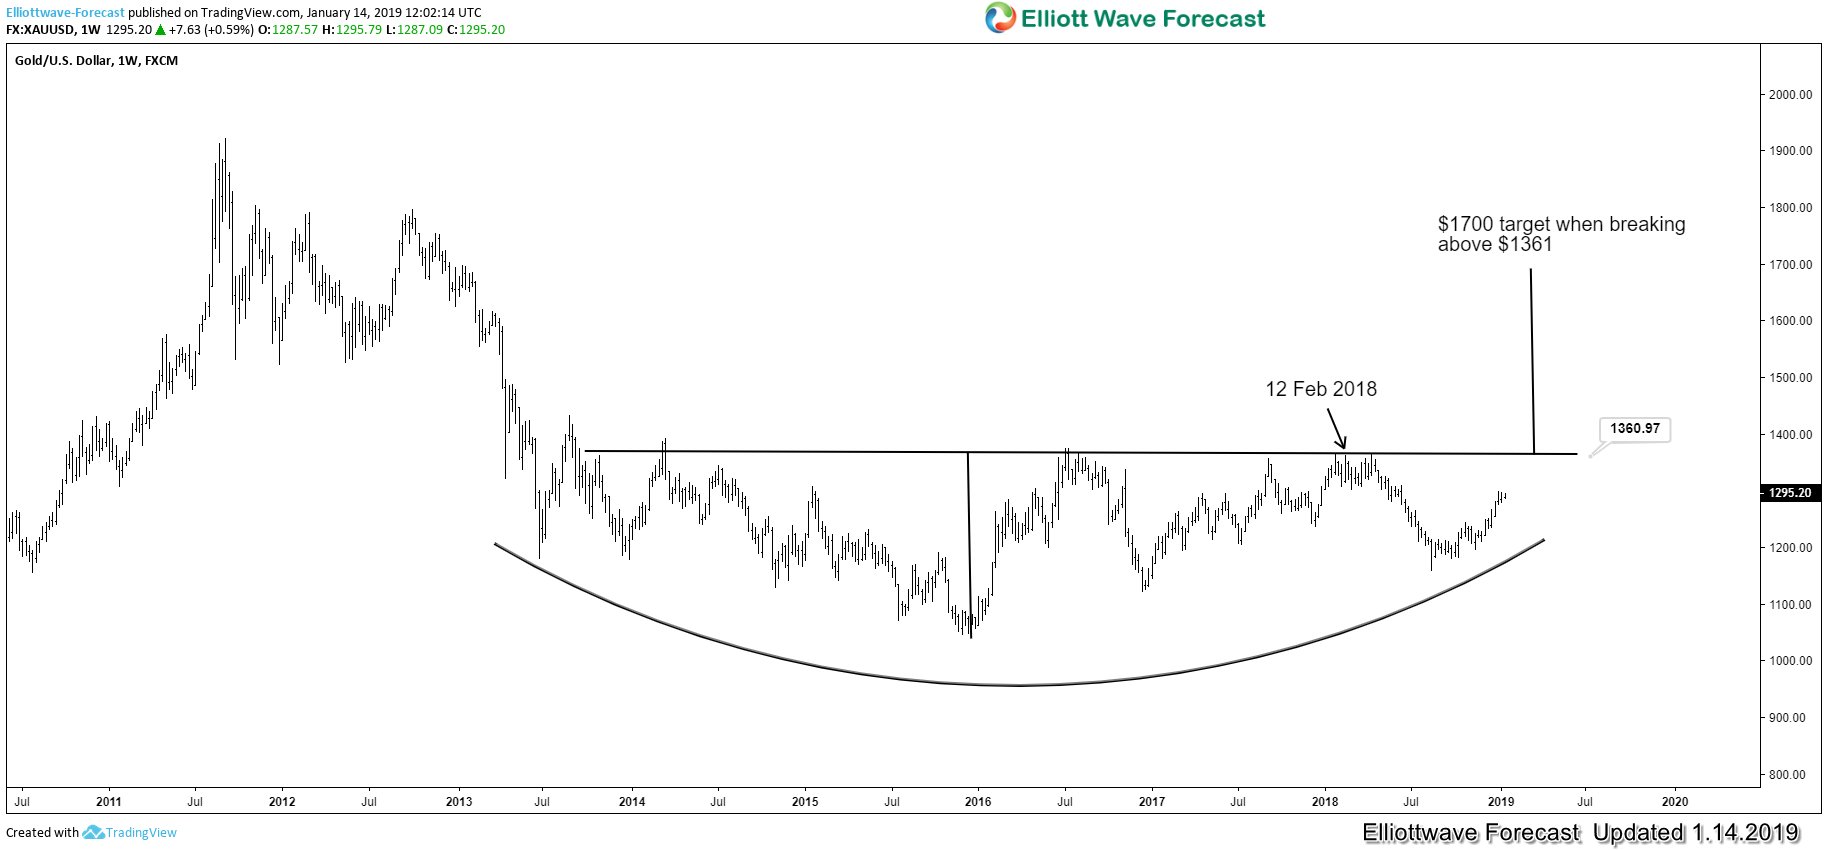
Has the Next Bull Market in Gold Started?
Read MoreGold has been used as the currency of choice throughout history, despite what the central banks of the world say. Ben Bernanke, then the Fed Chairman, famously said that Gold is not money in 2011 during congressional hearing with Senator Ron Paul. Since President Nixon removed Gold’s peg from the US Dollar in 1971, the […]
-
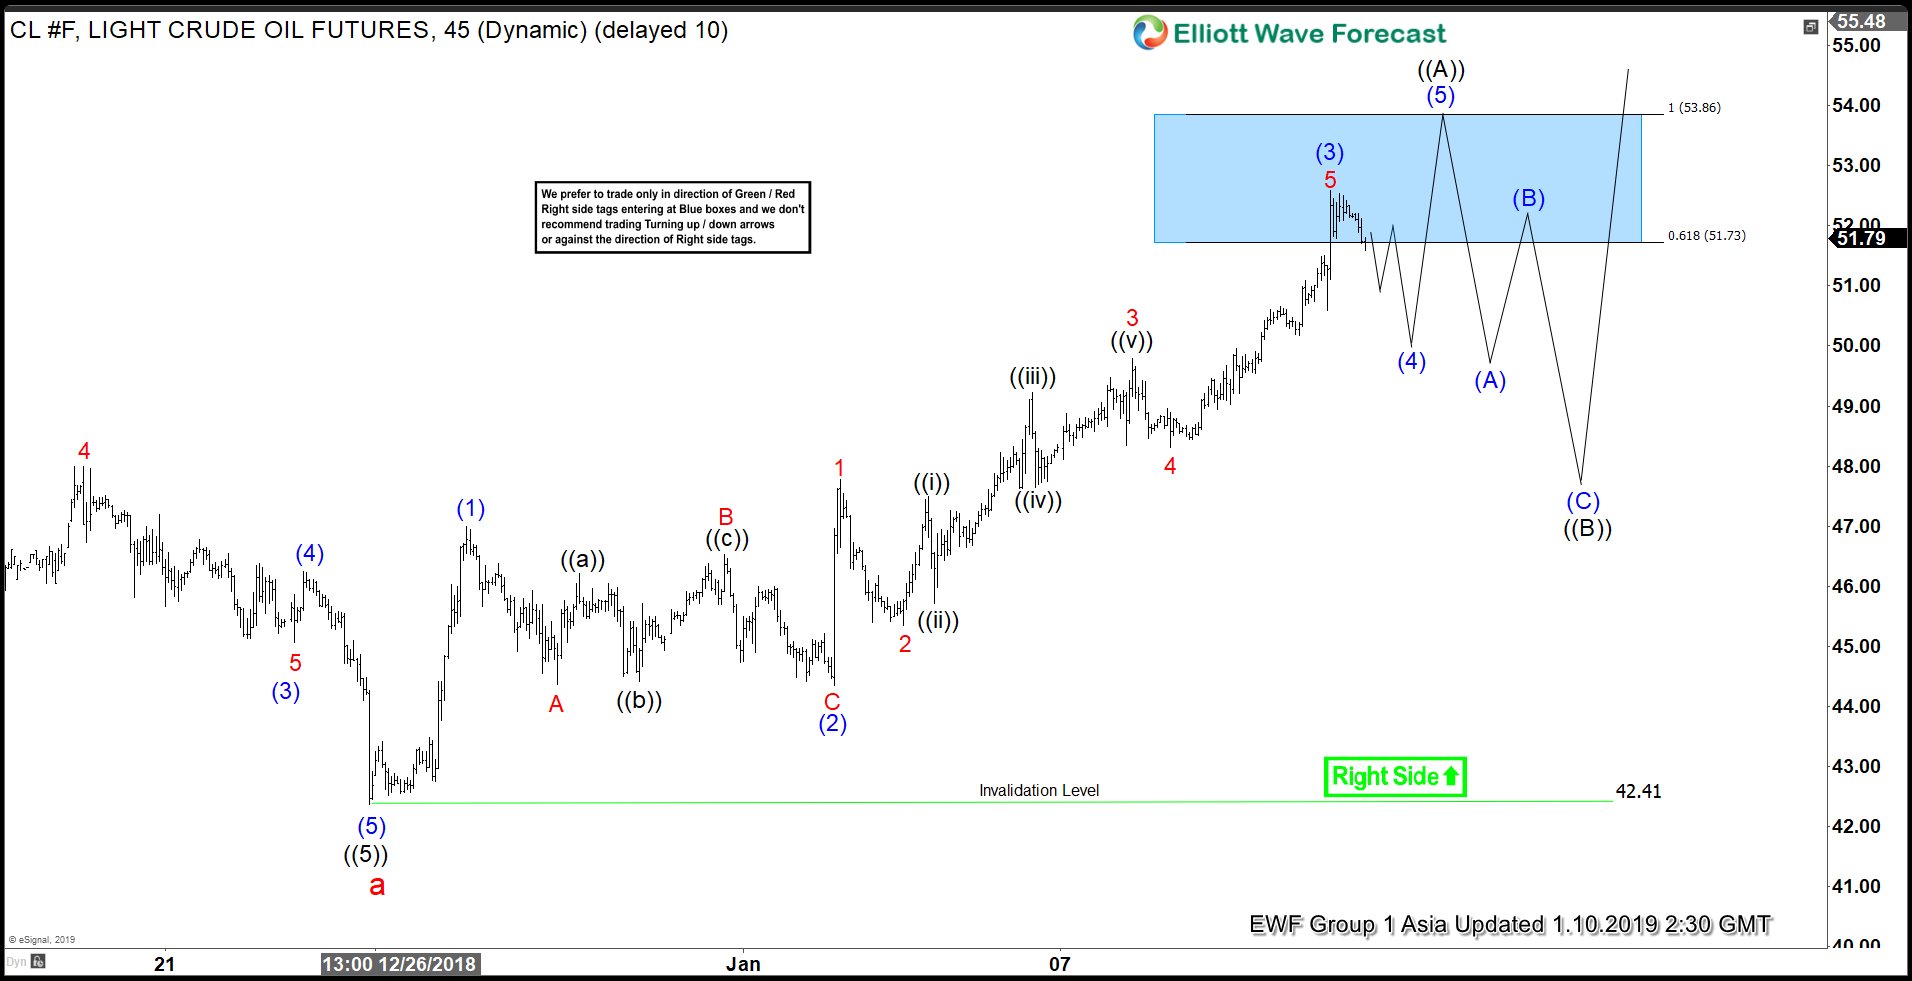
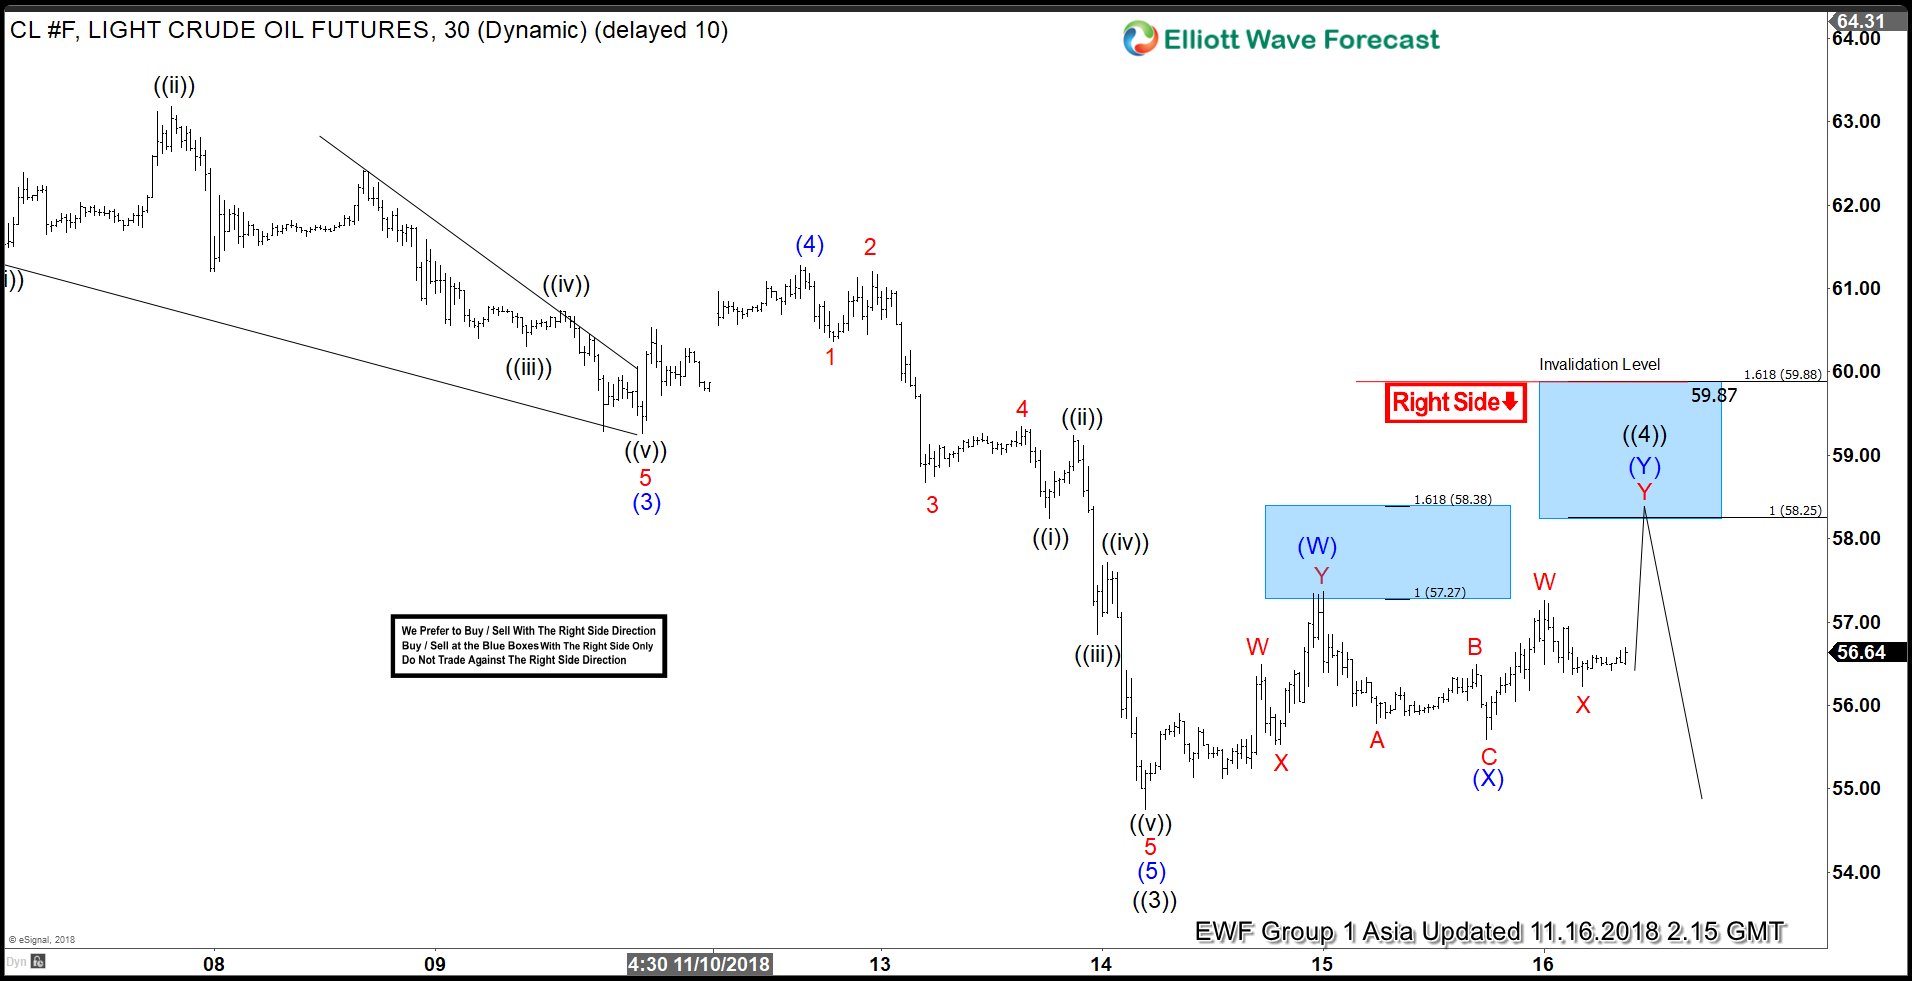
Short Term Elliott Wave View in Oil Favoring More Upside
Read MorePreferred Elliott Wave view suggests Oil has completed the cycle from 10/3/2018 peak and is now bouncing. Rally from $42.41 low appears impulsive and in this article we take a look at Elliott wave structure of the rally from $42.41 low and what we are expecting next.
-
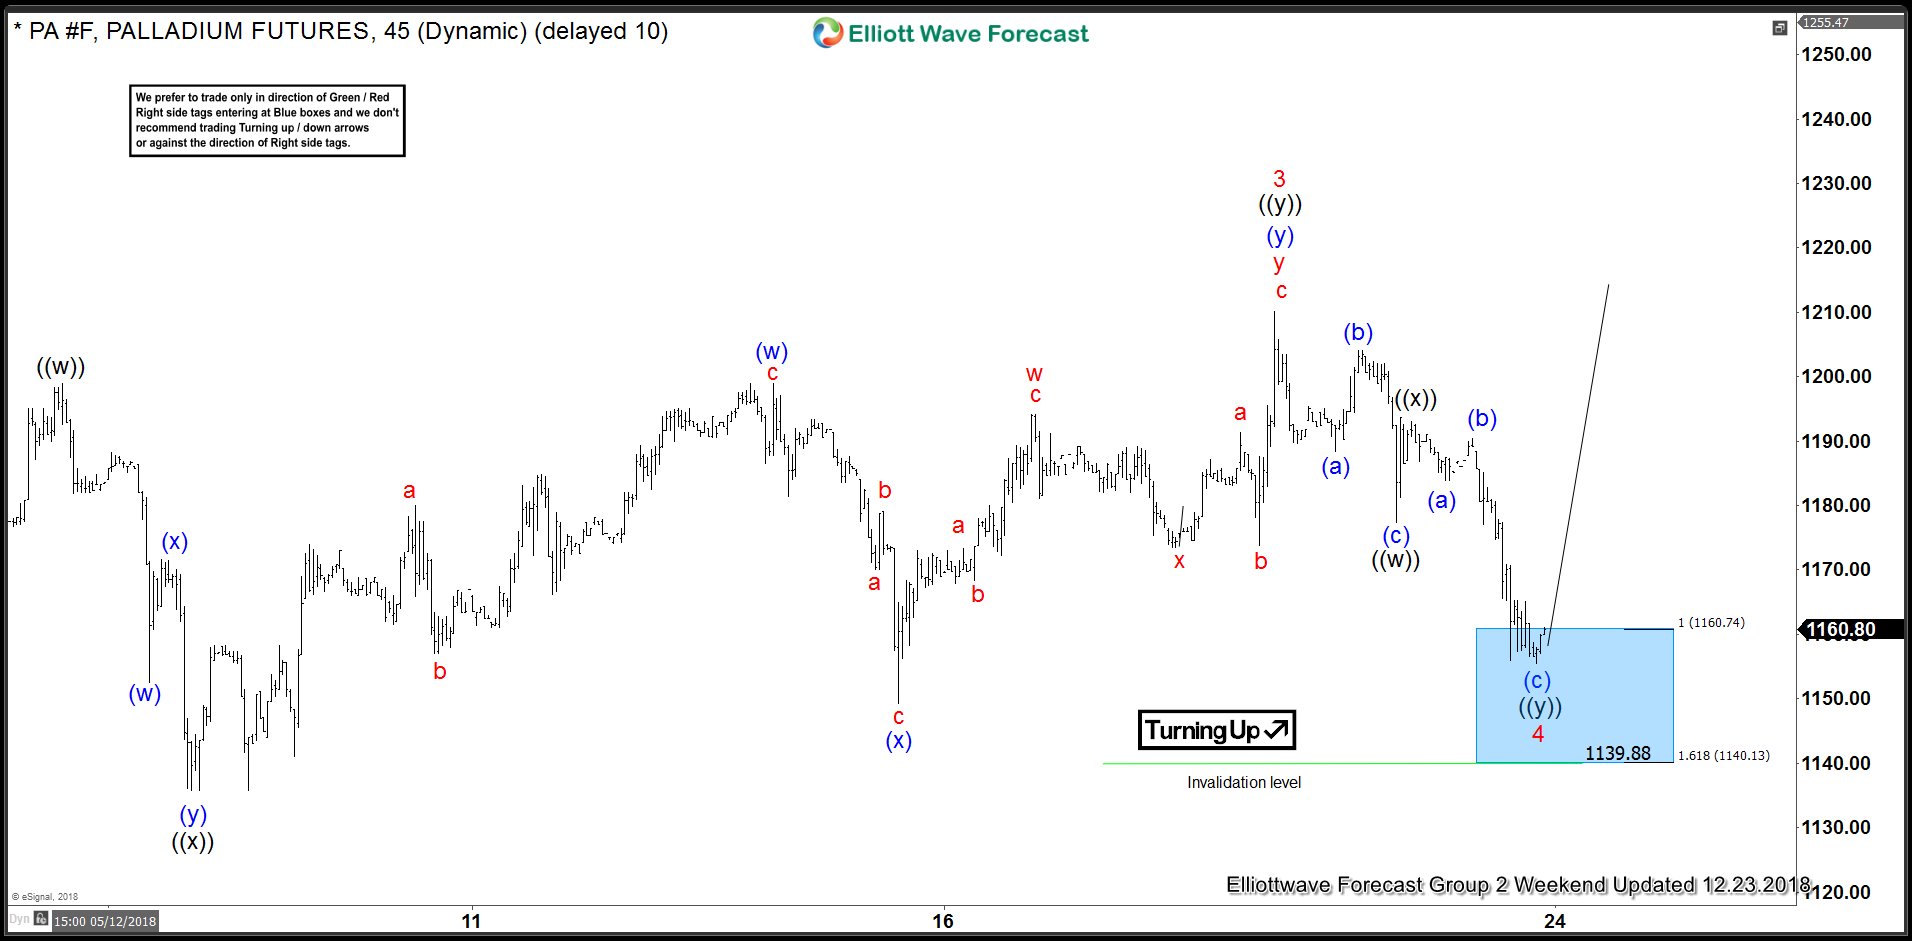
Elliott Wave Analysis: Palladium’s Target Area Reaction
Read MoreWelcome traders, today we will look at a couple of Palladium futures (PA #F) charts. The metal reached one of our blue target areas and react perfectly to our expectations. This will show you how profitable and efficient it can be to trade with our philosophy and basic Elliott Wave analysis. First of all, we start […]
-
OIL Elliott Wave Forecasting The Decline
Read MoreHello fellow traders. In this technical blog we’re going to take a quick look at the charts of OIL published in members area of the website. As our members know, we were calling for decline in OIL from November 2018. As of right now the commodity is correcting the cycle from the 26.18 low. Proposed […]
-
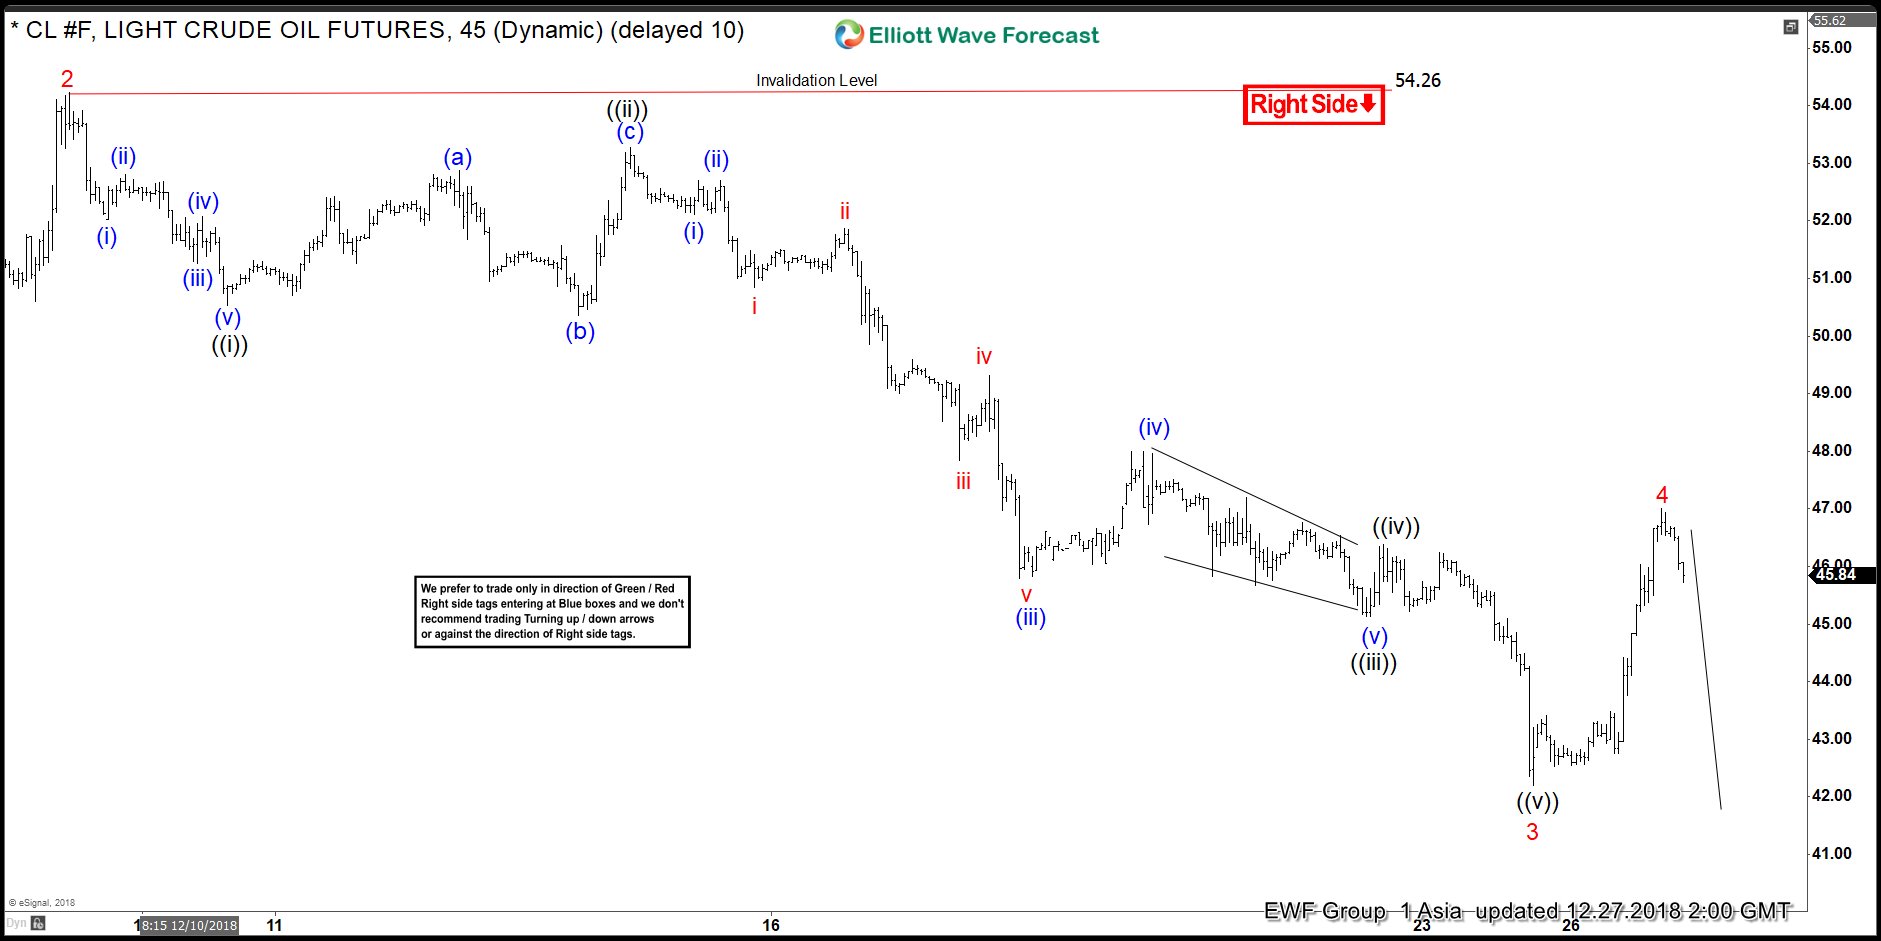
Oil: Impulsive Elliott Wave Structure In Play
Read MoreElliott Wave outlook in Oil (CL_F) suggests that the move lower from 10/3 high ($76.9) remains in progress as a 5 waves impulsive Elliott Wave structure. Down from $76.9, Primary wave ((1)) ended at $65.74, Primary wave ((2)) ended at $67.95, and Primary wave ((3)) remains in play. Internal of Primary wave ((3)) also unfolded […]
-

OIL Elliott Wave Analysis: Calling For More Weakness
Read MoreOIL Elliott wave analysis suggests that a decline from October 3, 2018 peak ($76.9) is unfolding as impulse Elliott wave structure. Down from $76.9 peak, the primary wave ((1)) ended at $68.47 low. A primary wave ((2)) bounce ended at $69.65 high. Then a decline to $54.75 low ended primary wave ((3)). Primary wave ((4)) […]