
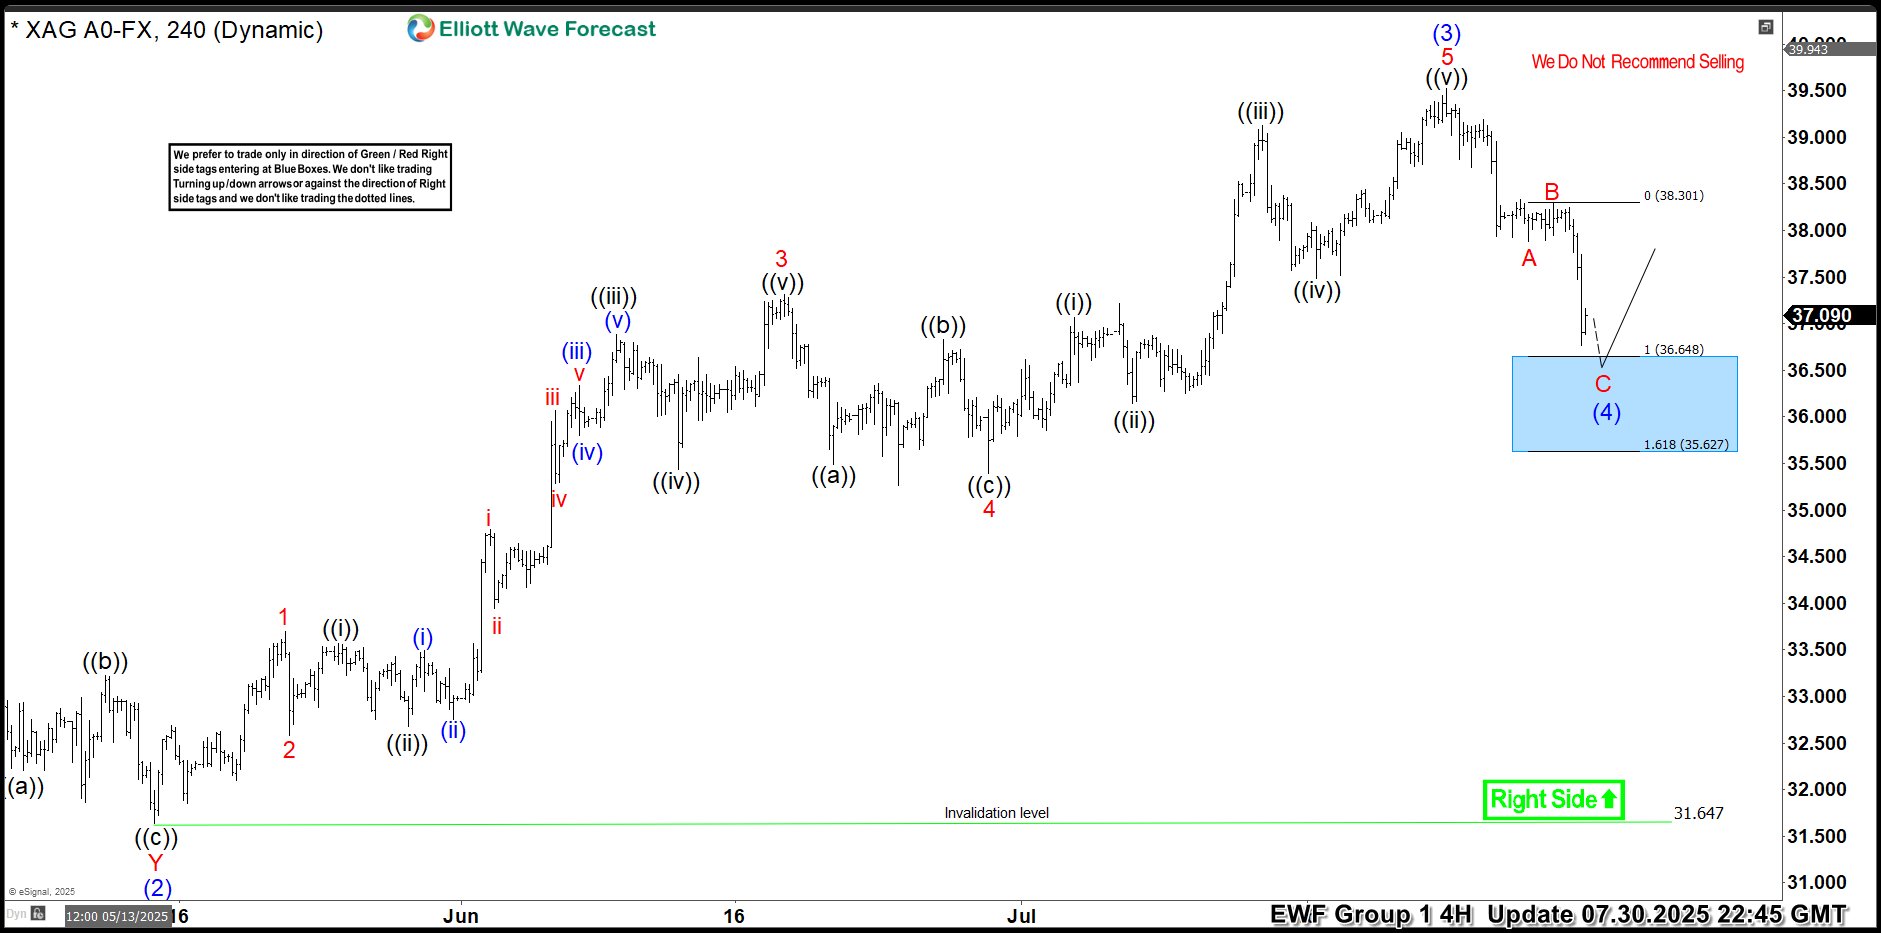
Hello traders. As our members know, we have had many profitable trading setups recently. In this technical article, we are going to talk about another Elliott Wave trading setup we got in Silver (XAGUSD). The commodity has completed its correction exactly at the Equal Legs zone, also known as the Blue Box Area. In this […]
-
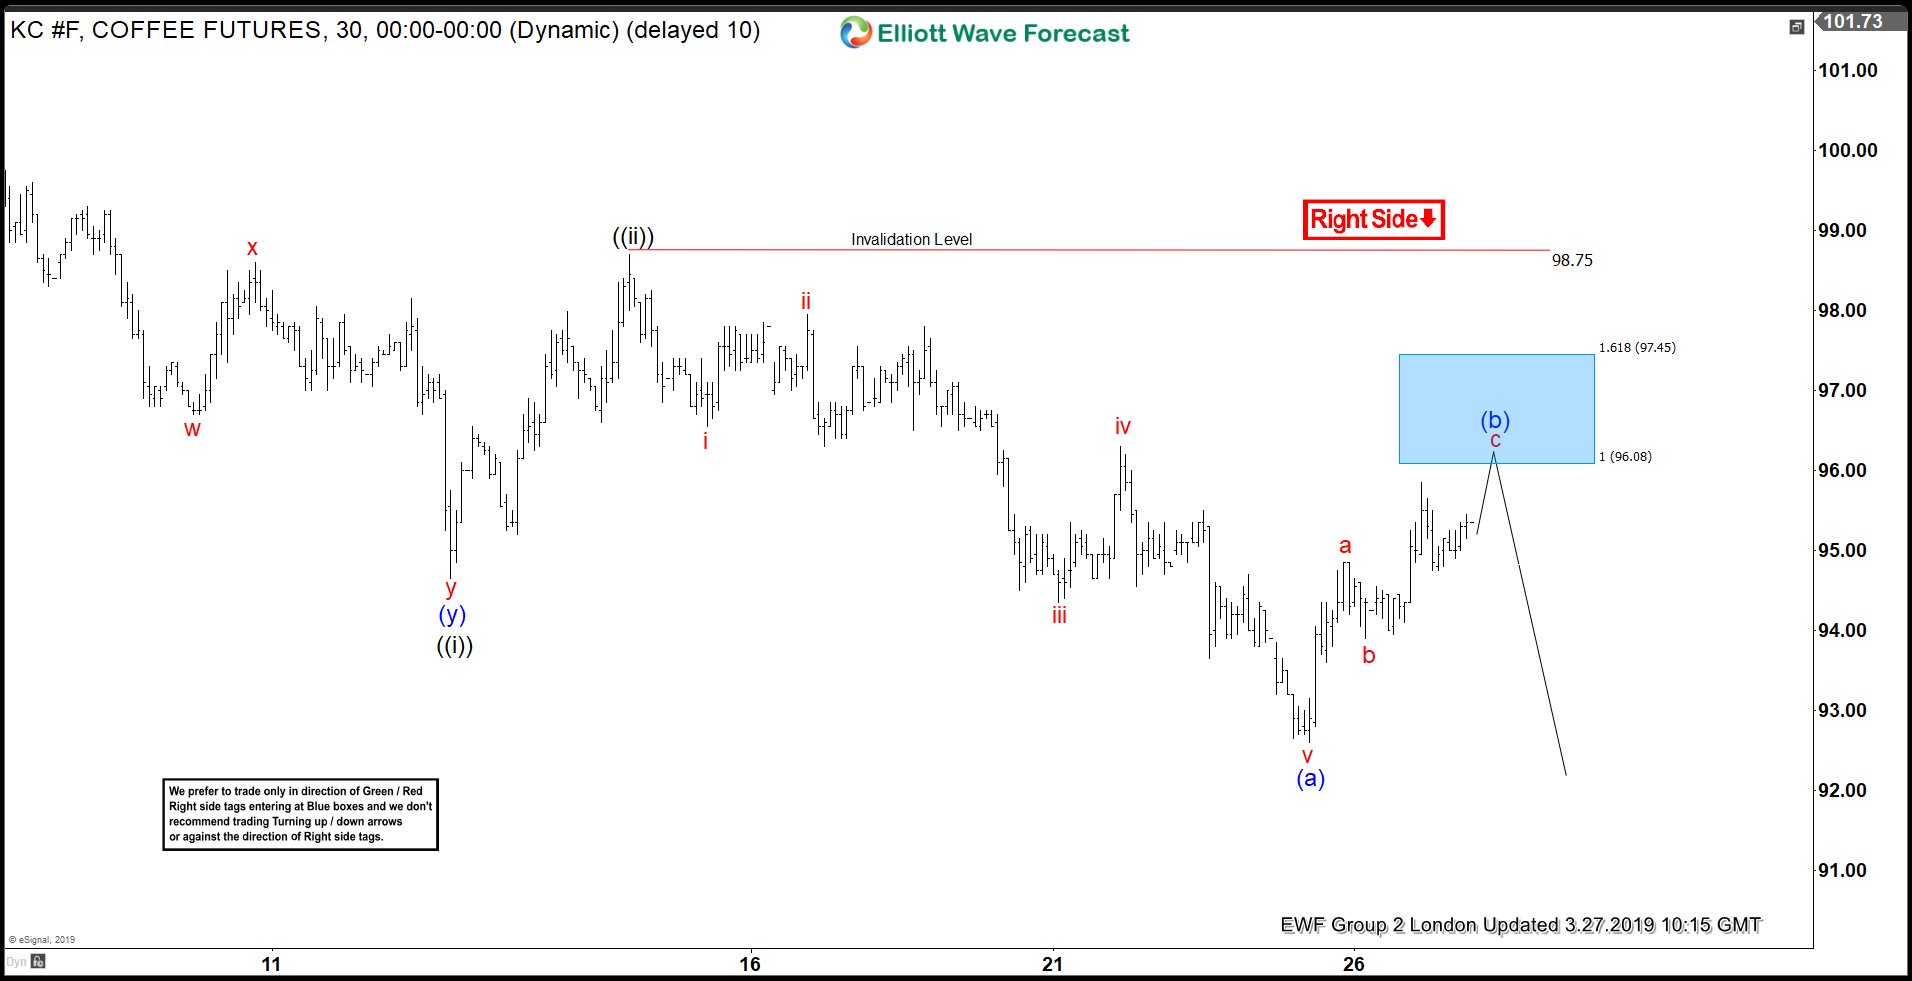
Elliott Wave Analysis: Selling Coffee Rally in Blue Box
Read MoreWelcome traders, today we look at a couple of 30-min Coffee futures (KC_F) charts and its price action within hours. The following analysis will show how profitable and efficient it can be to trade with our philosophy and basic Elliott Wave analysis. First of all, we start on March 27th with a 30-minute chart presented to […]
-
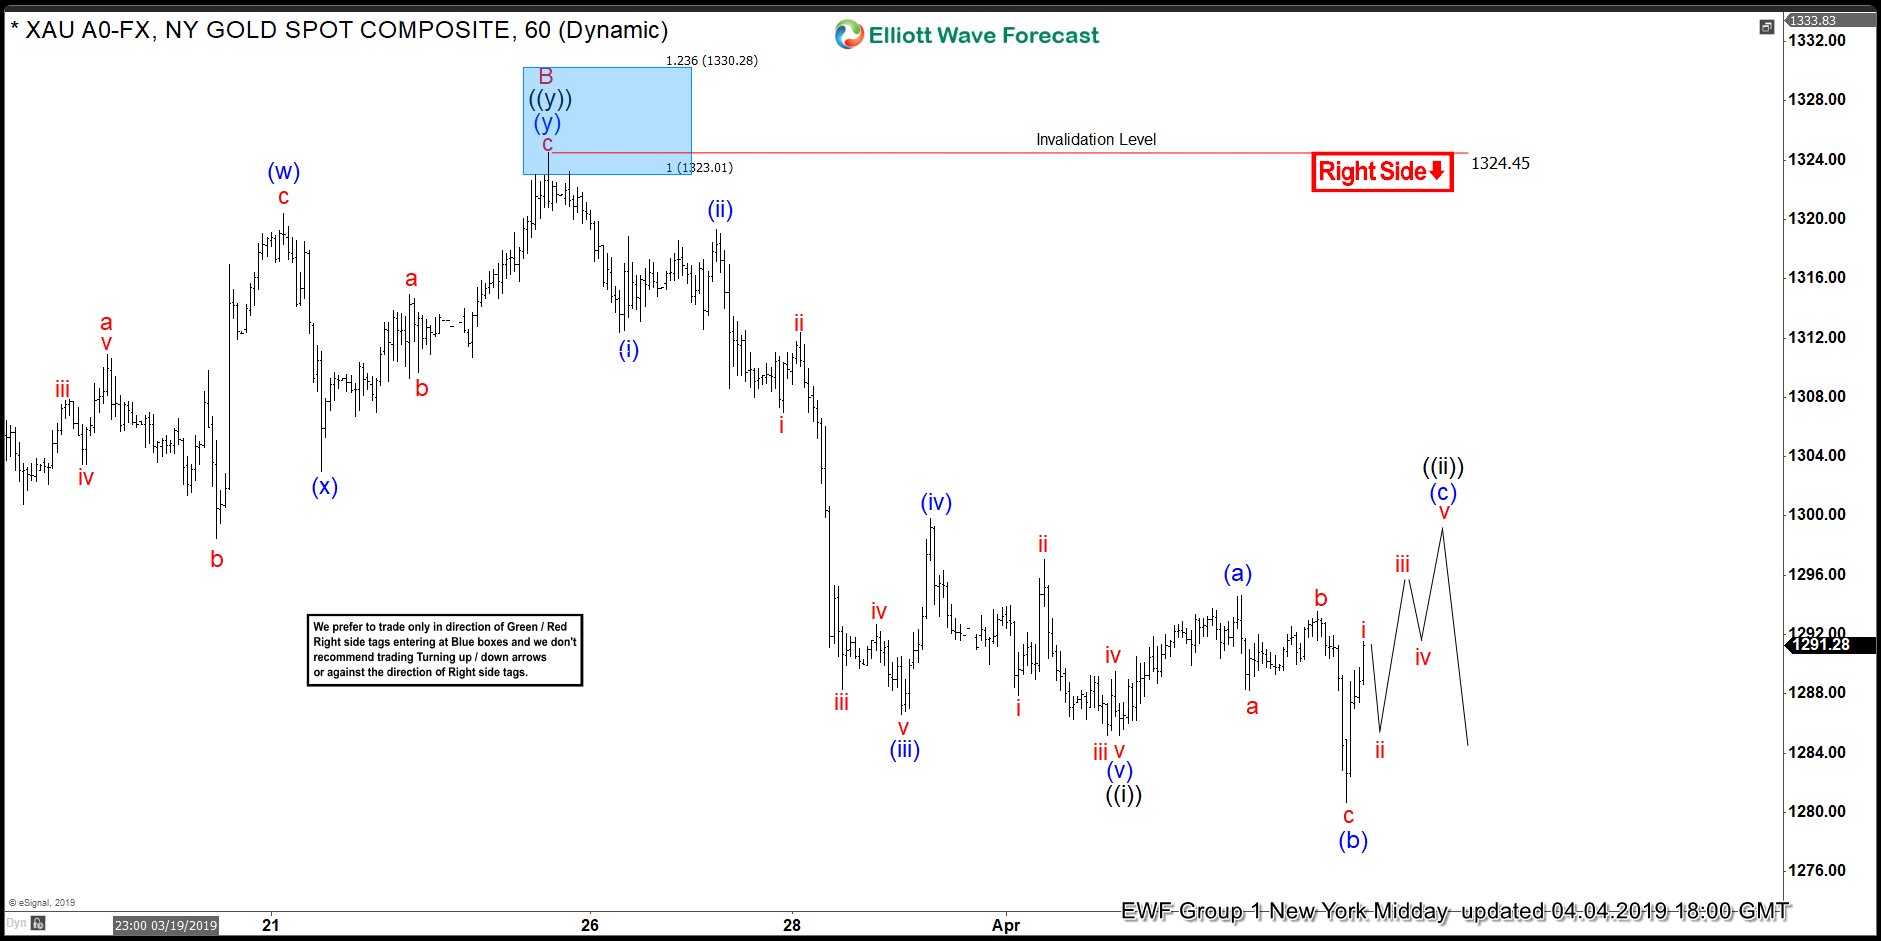
Elliott Wave View Looking for Further Correction in Gold
Read MoreGold is correcting cycle from August 2018 low as a zigzag. This article and video talk about the Elliott Wave path and projected turning area for Gold.
-
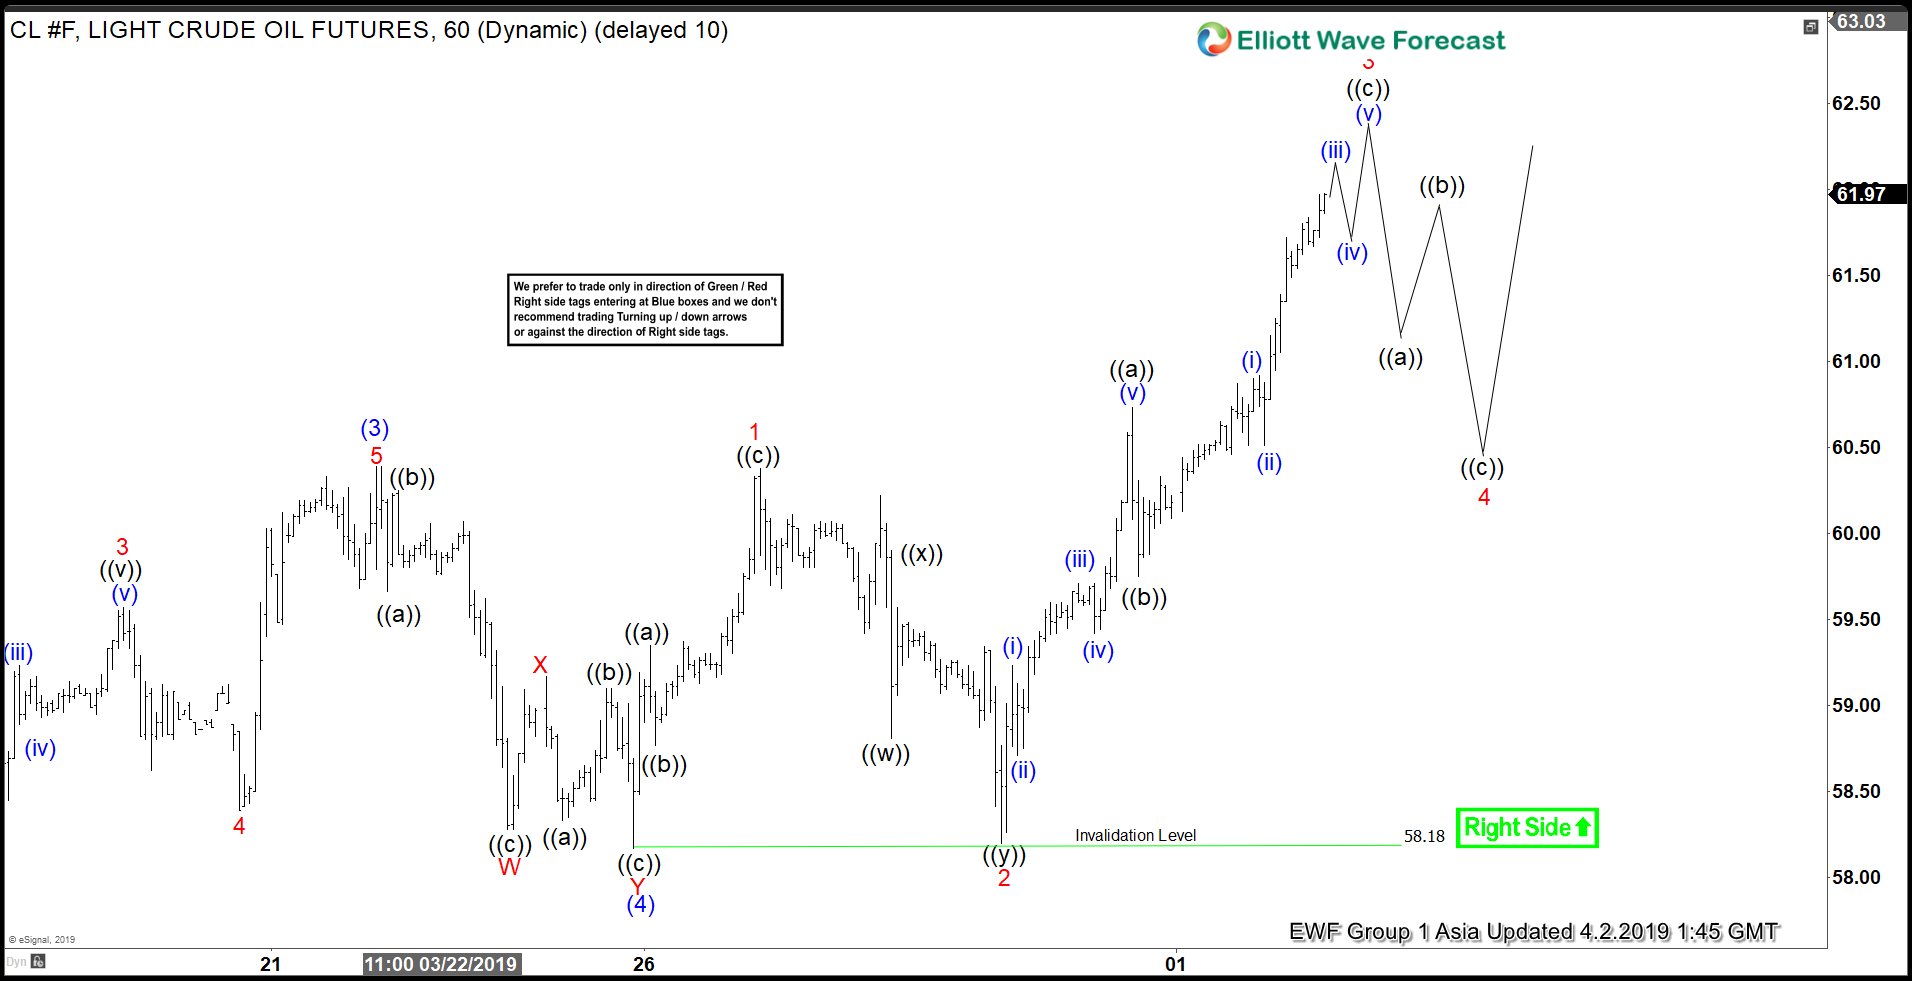
Elliott Wave View: Oil Can see Profit Taking Soon
Read MoreOil is close to reaching the minimum target to end cycle from Dec 2018 low. This article explains the Elliott Wave path and target.
-
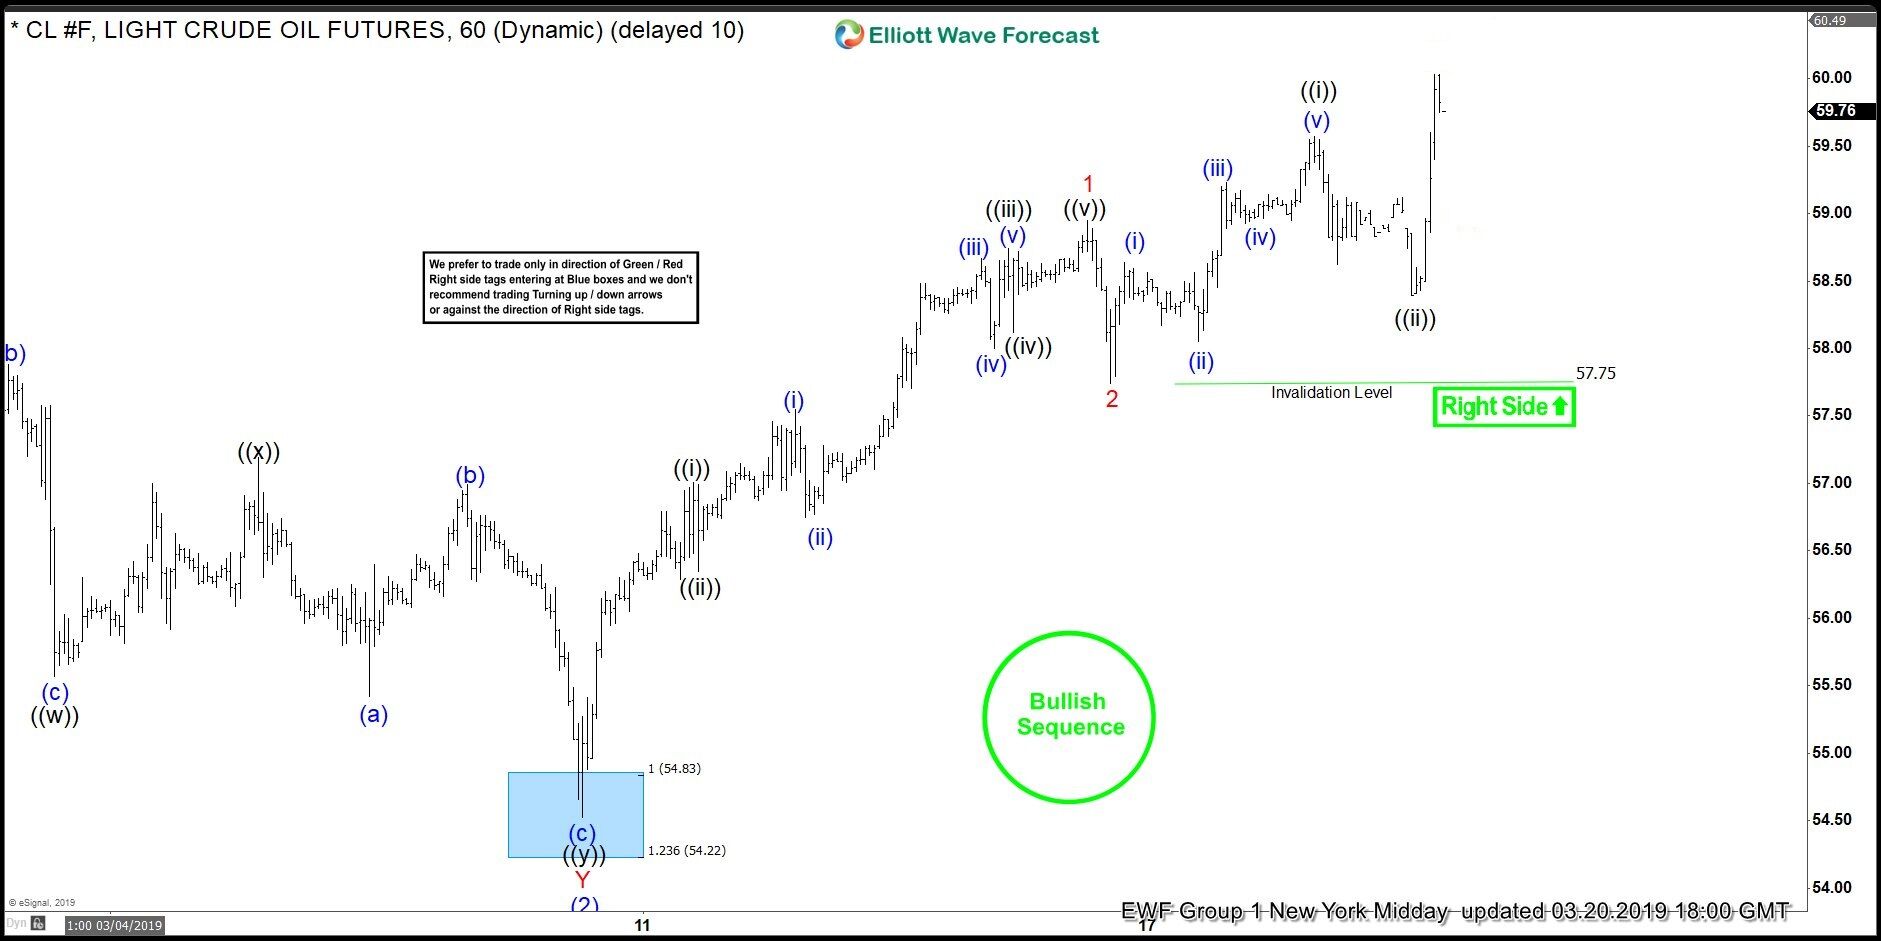
Elliott Wave Analysis: Bullish Sequence Pushing for Higher Prices in Oil
Read MoreWelcome traders, today we will look at a couple of Oil futures (CL_F) charts given to our members. The following short Elliott wave analysis will give you a brief understanding on how our bullish/bearish sequence stamps work and how we act on them. First of all, we start on March 18 where the right side of the markert favored […]
-
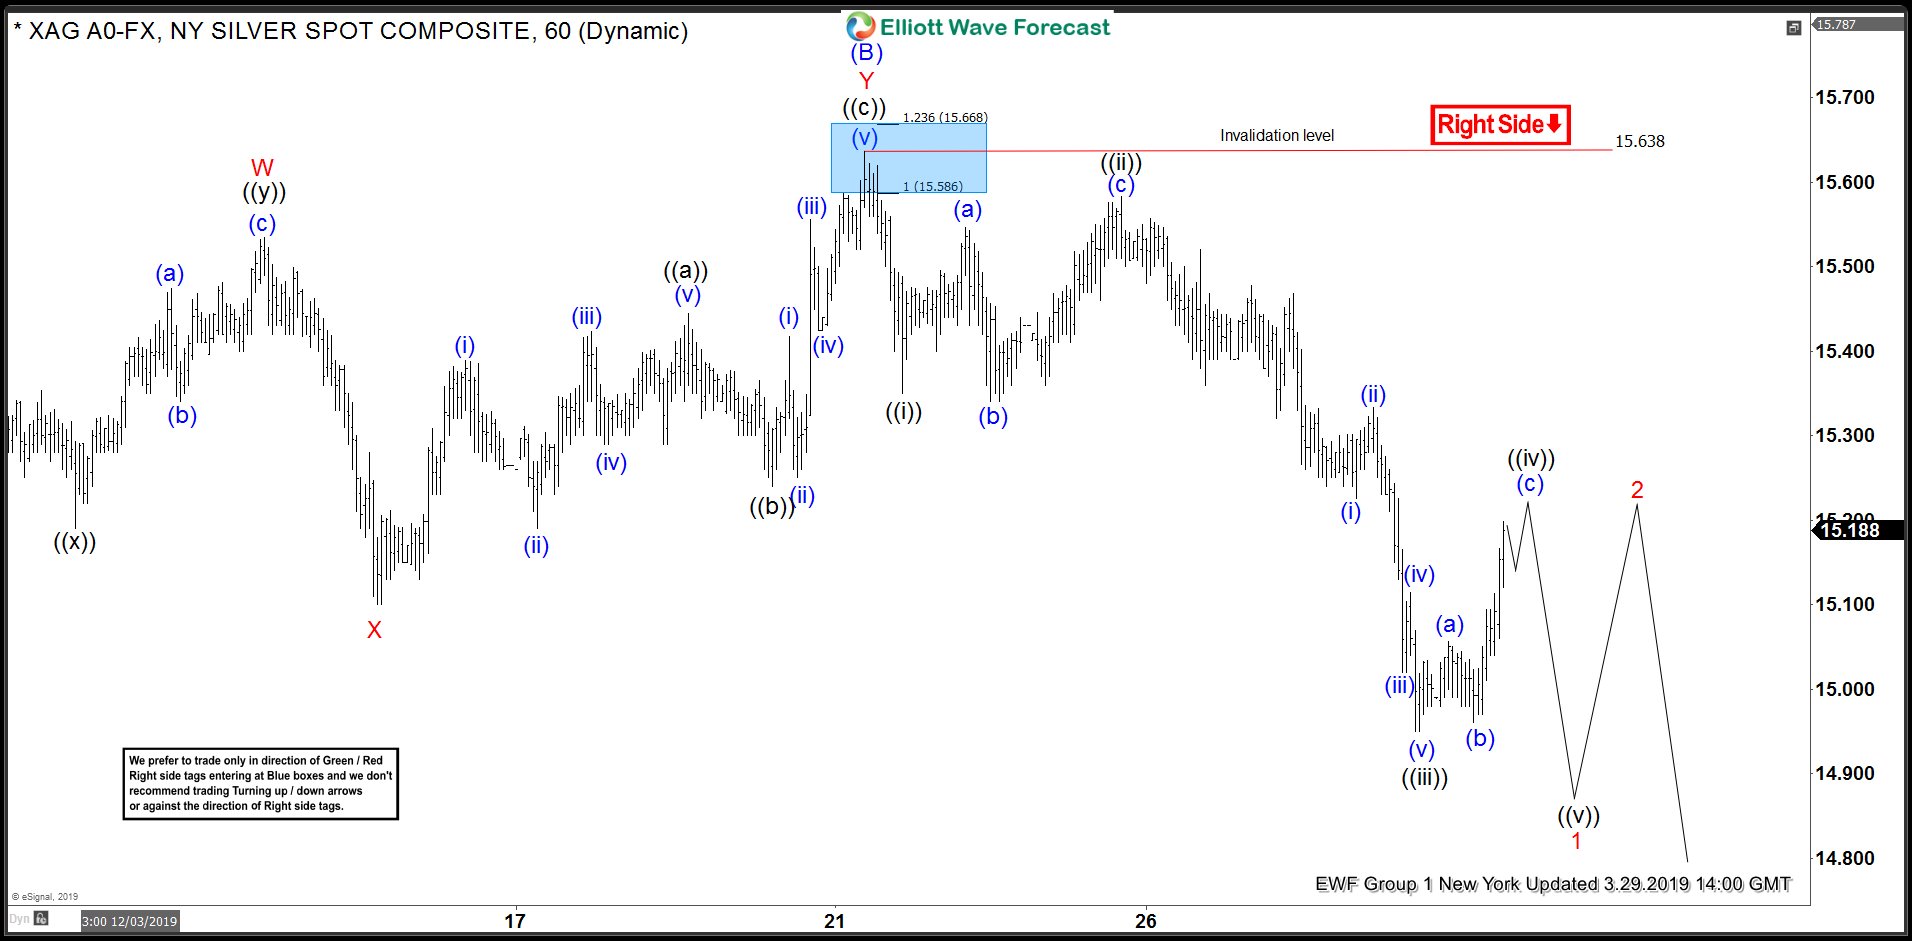
Elliott Wave View: Short Term Weakness in Silver
Read MoreSilver shows a sequence of lower low from Feb 21 peak, suggesting further weakness likely. This article & video describes the Elliott Wave path.
-
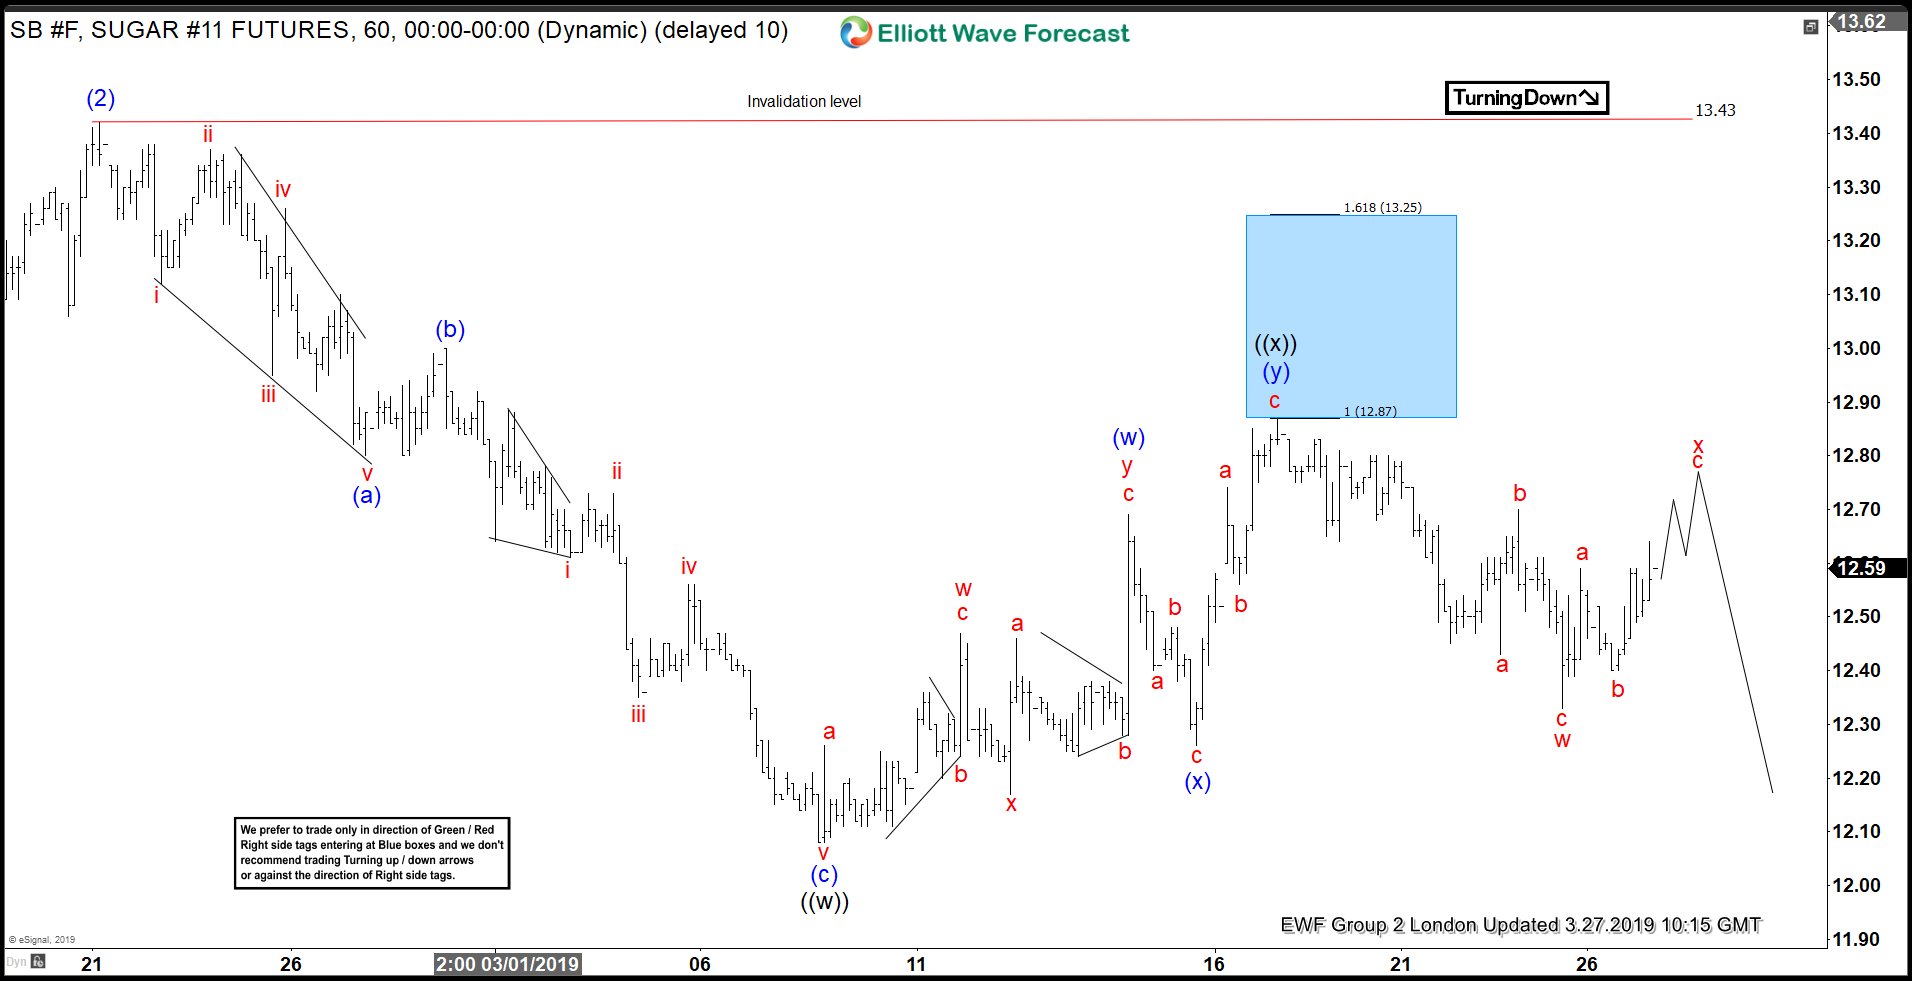
Sugar Elliott Wave Analysis: Calling The Reaction from Inflection Area
Read MoreI want to share with you Elliott Wave charts of Sugar which we presented to our members recently. You see the 1-hour updated chart presented to our clients on the 03/18/19. The higher degree trend of the pair is to the downside. So our members know that the right side is to the downside in the daily […]