
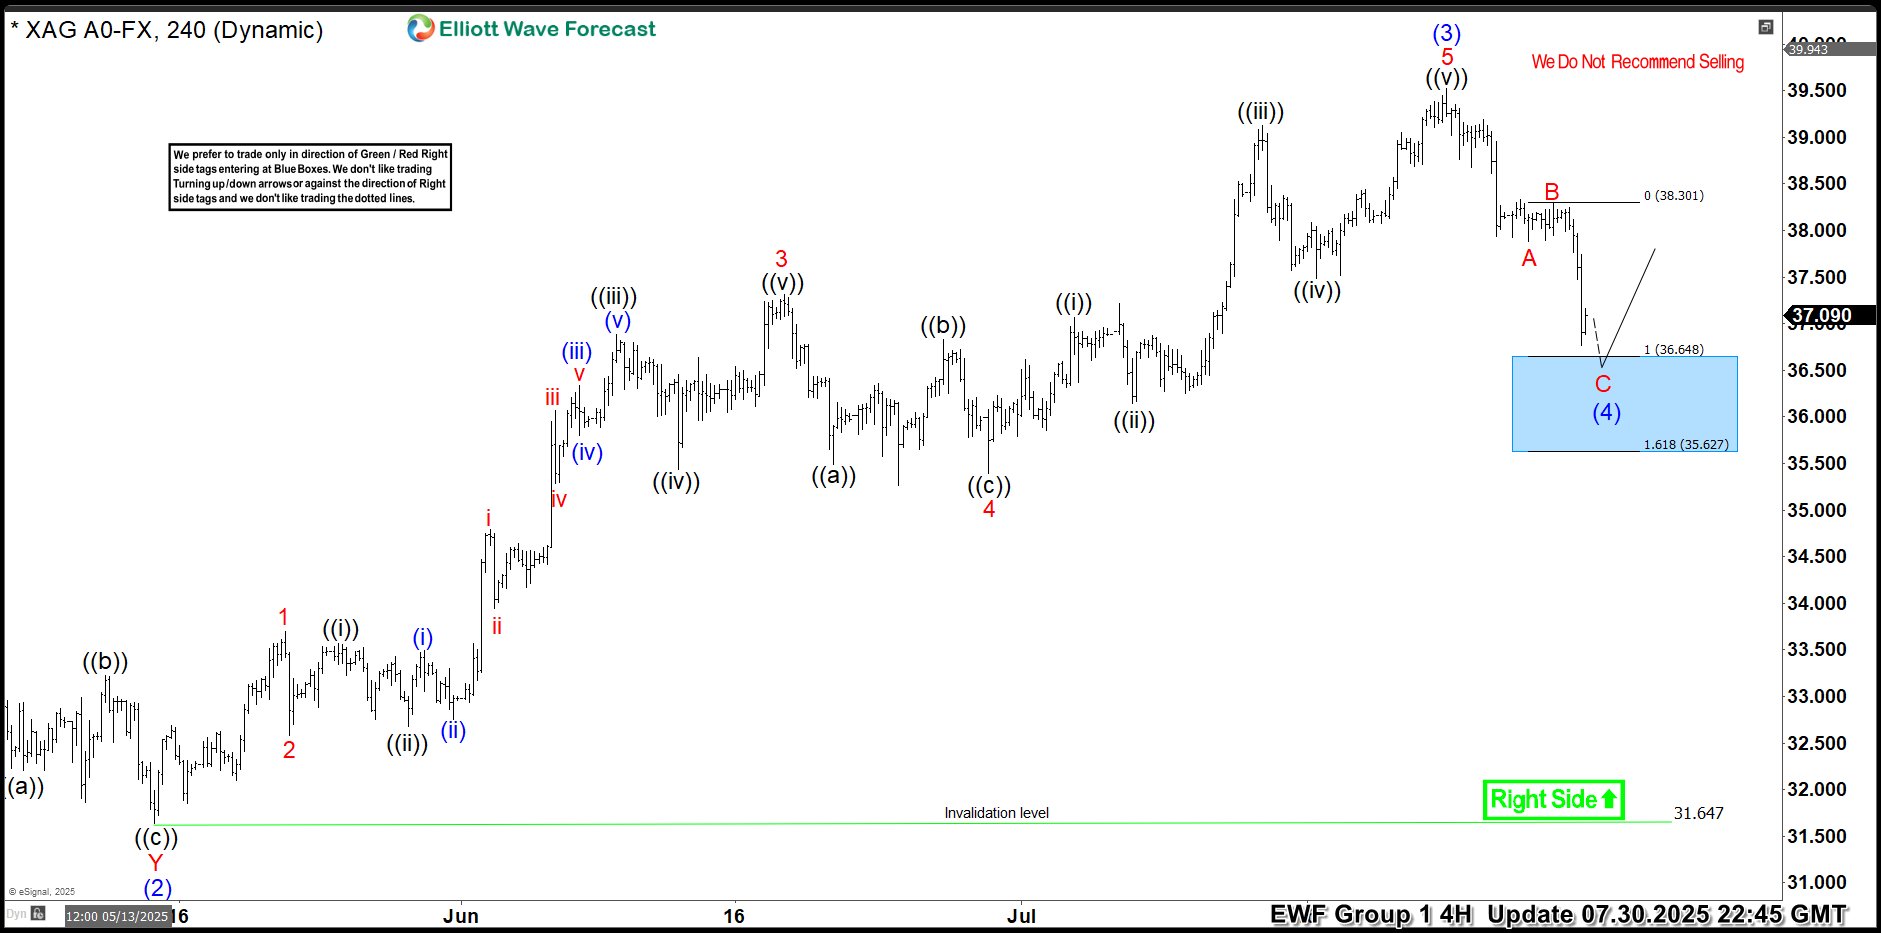
Hello traders. As our members know, we have had many profitable trading setups recently. In this technical article, we are going to talk about another Elliott Wave trading setup we got in Silver (XAGUSD). The commodity has completed its correction exactly at the Equal Legs zone, also known as the Blue Box Area. In this […]
-
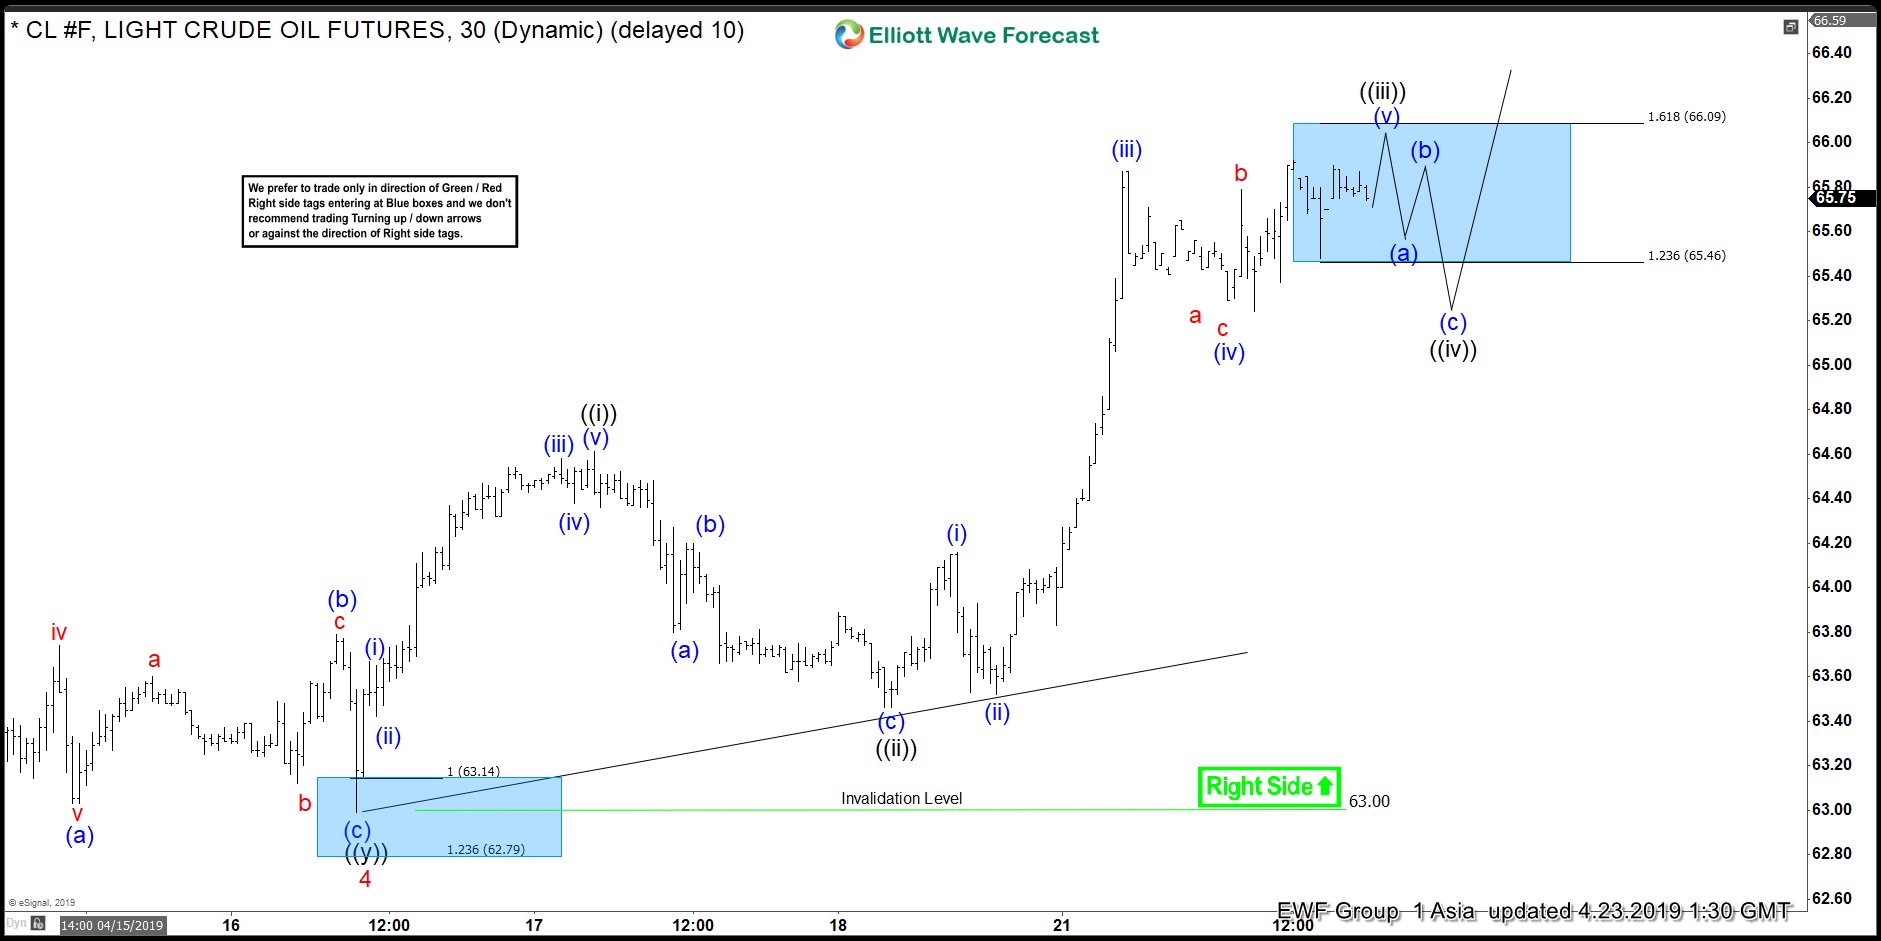
Elliott Wave View: Further Strength in Oil
Read MoreOil shows an impulsive structure from April 16 low with extended third swing. This video talks about the short term Elliott Wave path for the instrument.
-
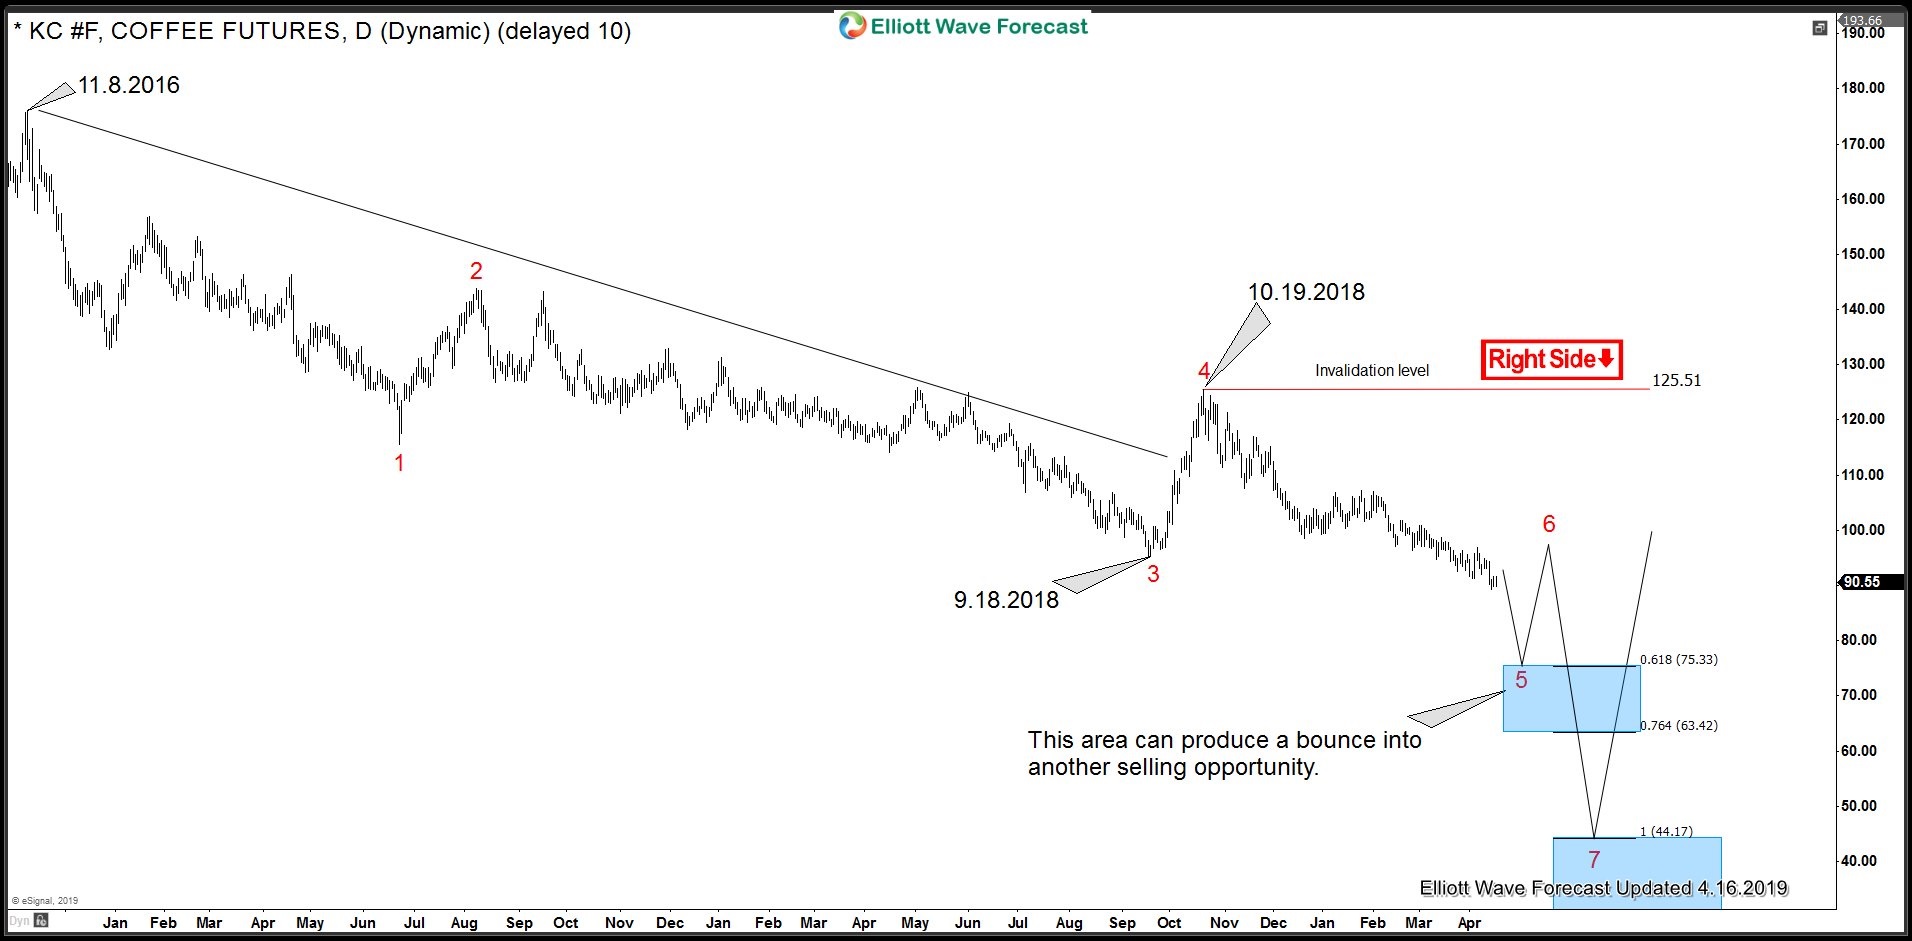
KC_F: Prices to Slide Further as Sellers Still in Control
Read MoreCoffee Futures (KC_F) formed a lower high in October 2018 and have been declining since then. In the last 6 months, KC_F lost approximately 27.8% dropping from a high of 125.51 to it’s current levels. In this blog, we look at the cycle from 11.8.2016 peak and explain whether prices could recover soon or any […]
-

Elliott Wave View: Further Correction in Gold Expected
Read MoreGold still shows incomplete sequence from Feb 20, 2019 peak. This article & video talks about the short term Elliott Wave path for the yellow metal.
-
Elliott Wave View: Silver Extending Lower
Read MoreSilver continues to show incomplete sequence from Feb 21. This article and video explains the short term Elliott Wave path for the metal.
-
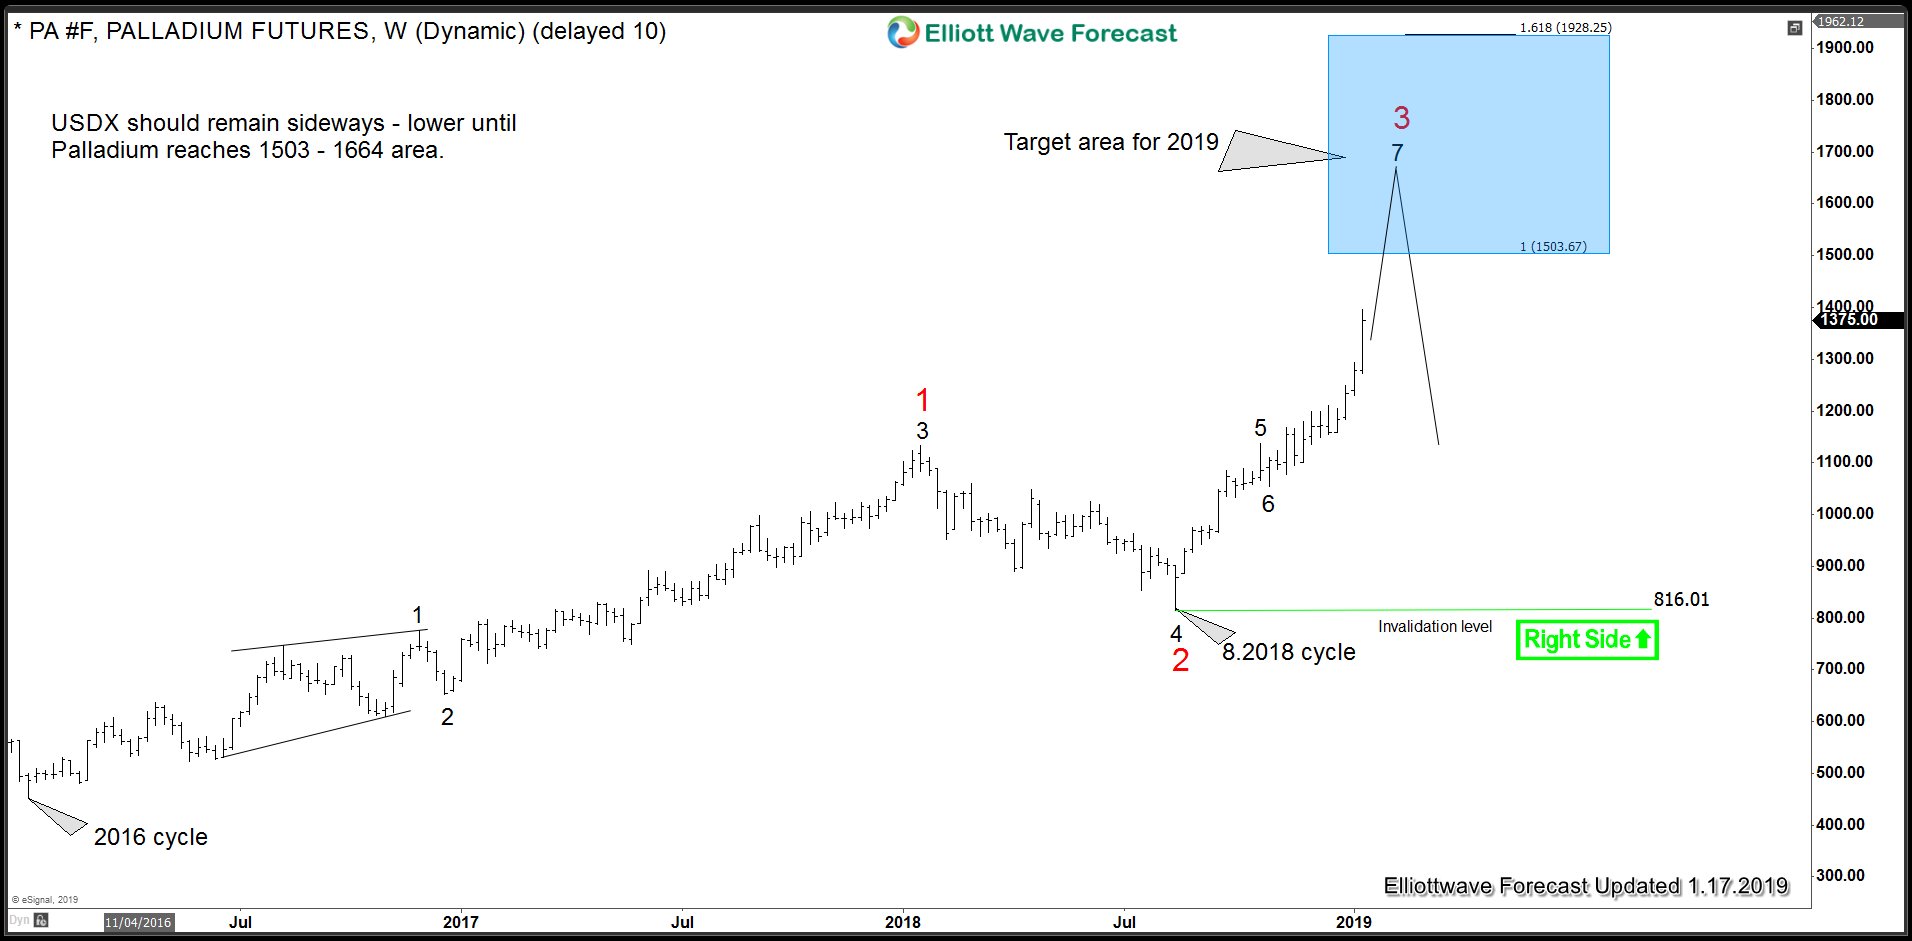
Palladium ( $PA_F) Forecasting The Path
Read MoreHello fellow traders. In this technical blog we’re going to take a quick look at the charts of Palladium Futures published in members area of the website. As of right now Palladium is giving us nice reaction from the Weekly Blue Box area. We’re calling August 2018 cycle completed at 1577 peak and now getting […]
-
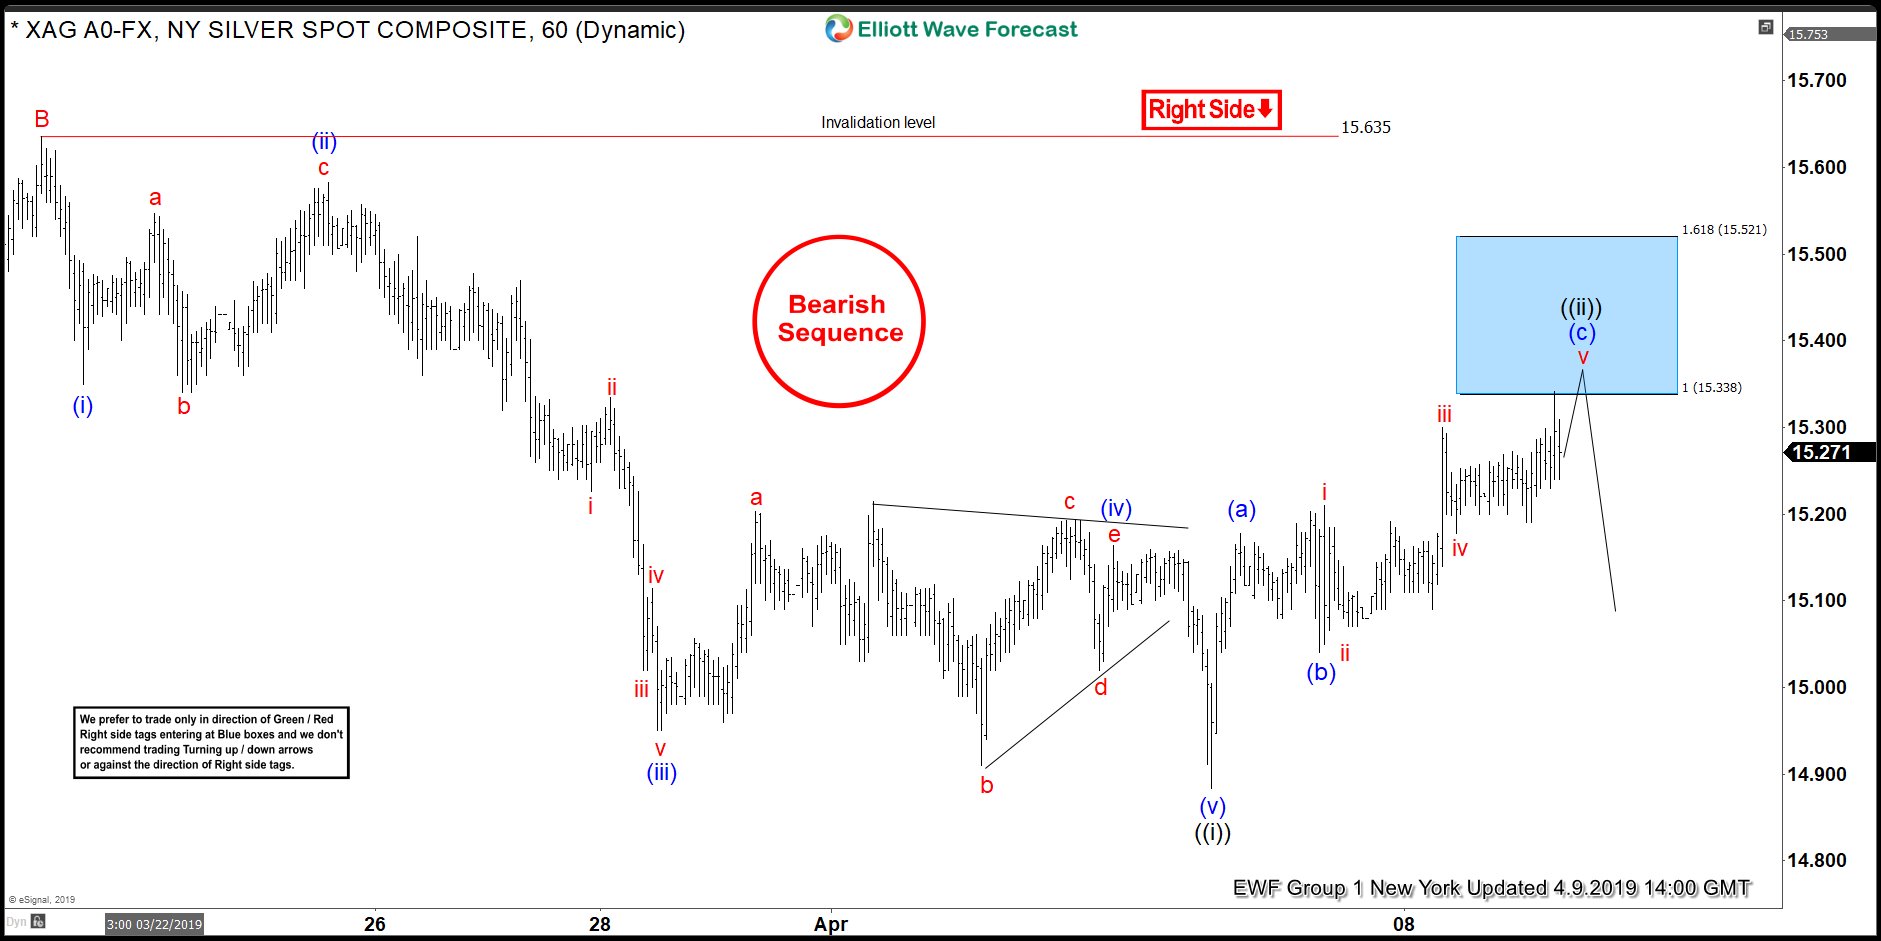
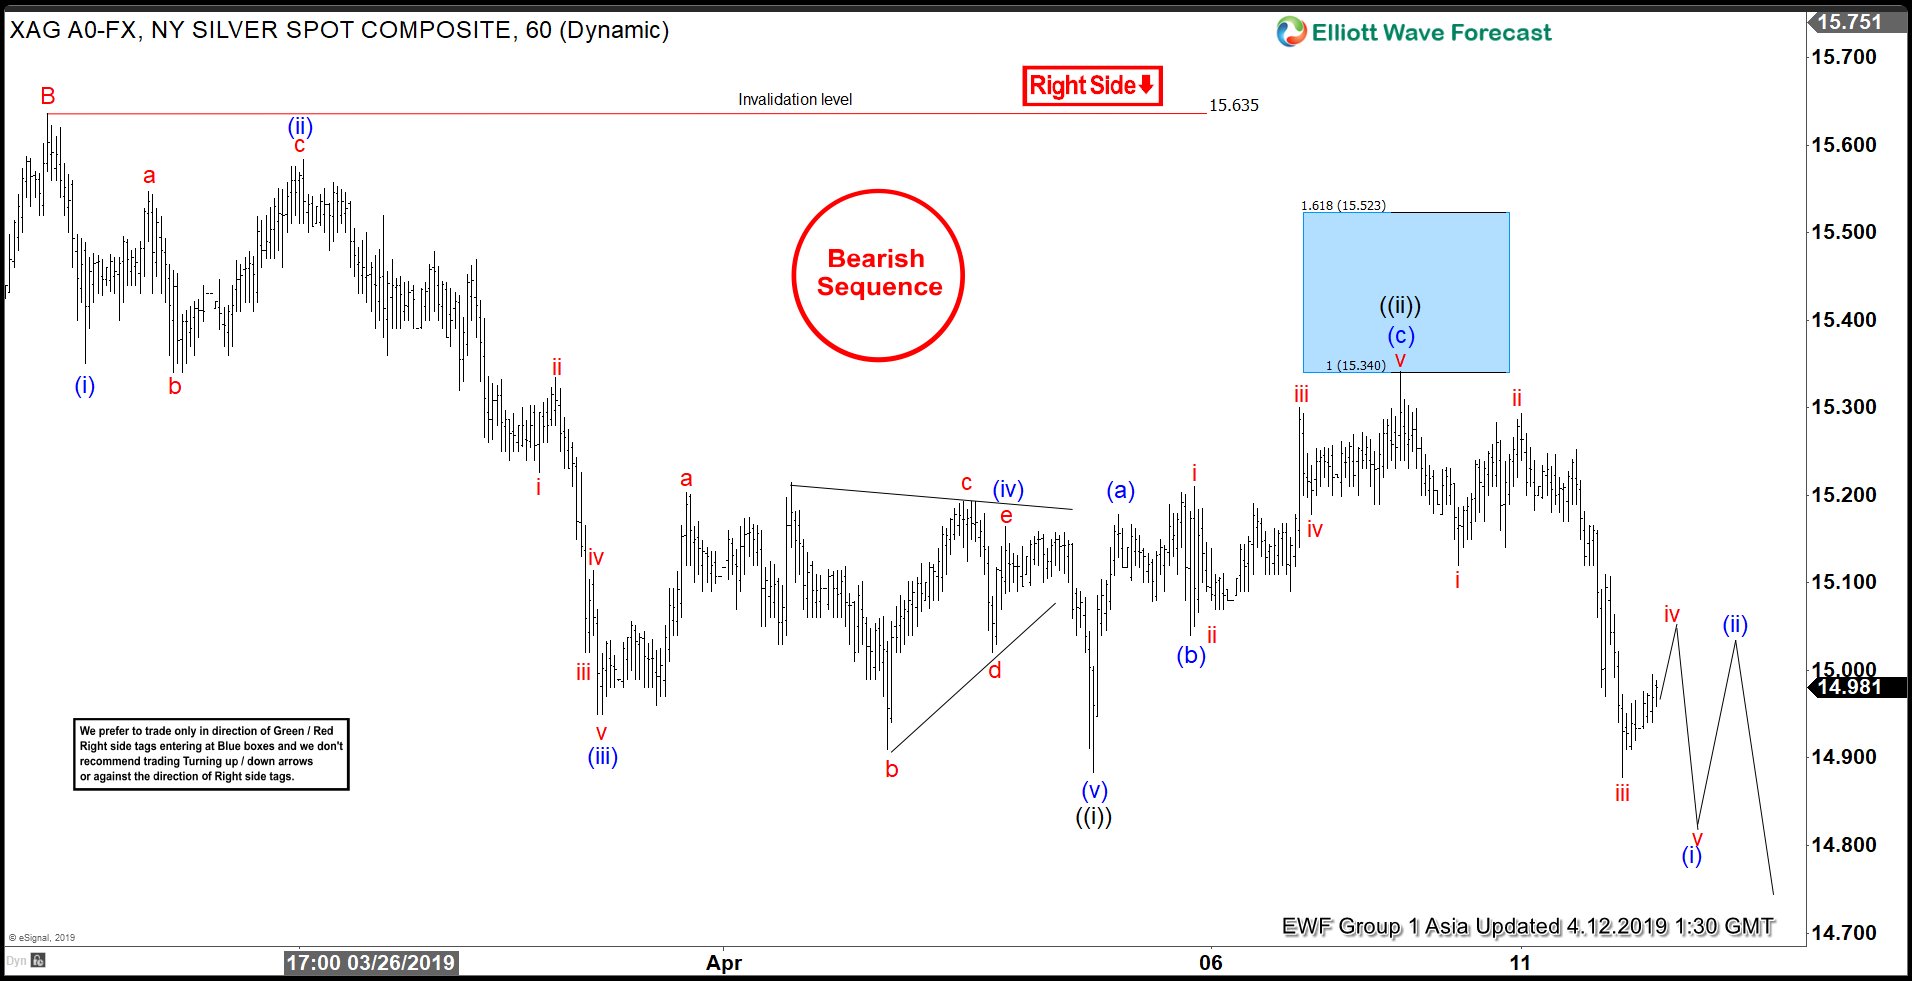
Silver Elliott Wave View: Bearish Sequence and Invalidation
Read MoreSilver ended an Elliott Wave impulse down from 15.63 peak and bounced and should now fail in 3, 7 or 11 swings in blue boxes as far as 15.63 holds.