
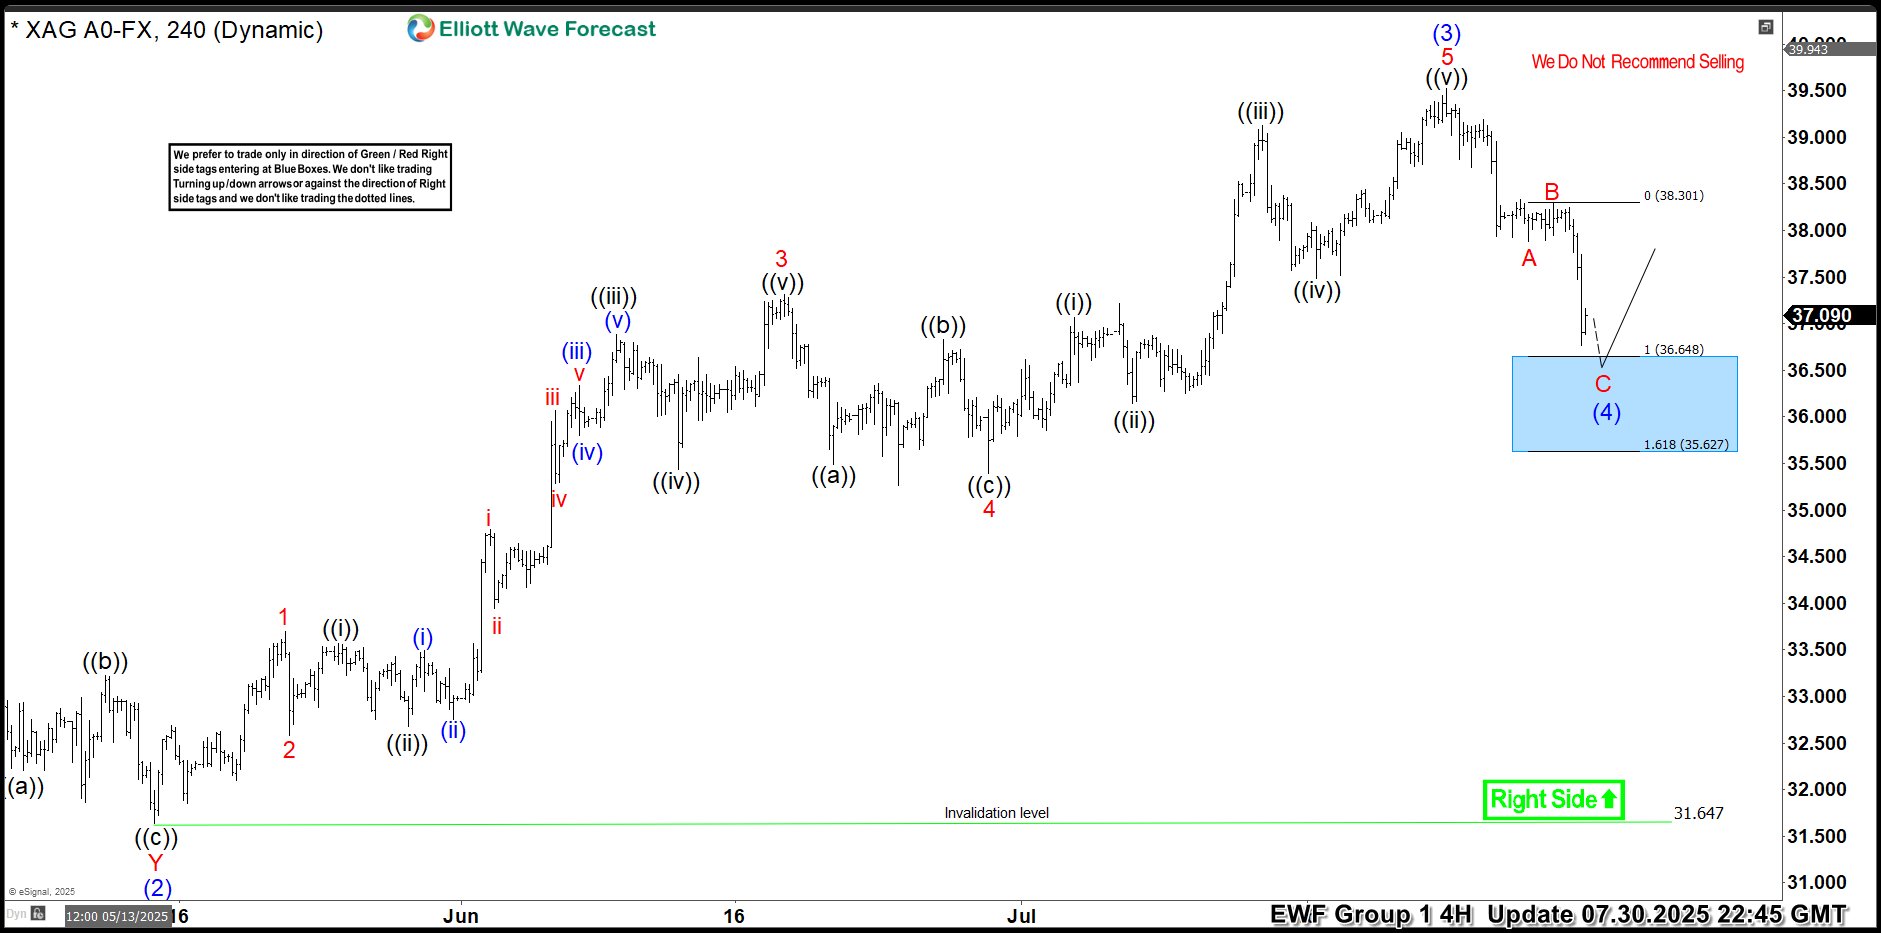
Hello traders. As our members know, we have had many profitable trading setups recently. In this technical article, we are going to talk about another Elliott Wave trading setup we got in Silver (XAGUSD). The commodity has completed its correction exactly at the Equal Legs zone, also known as the Blue Box Area. In this […]
-
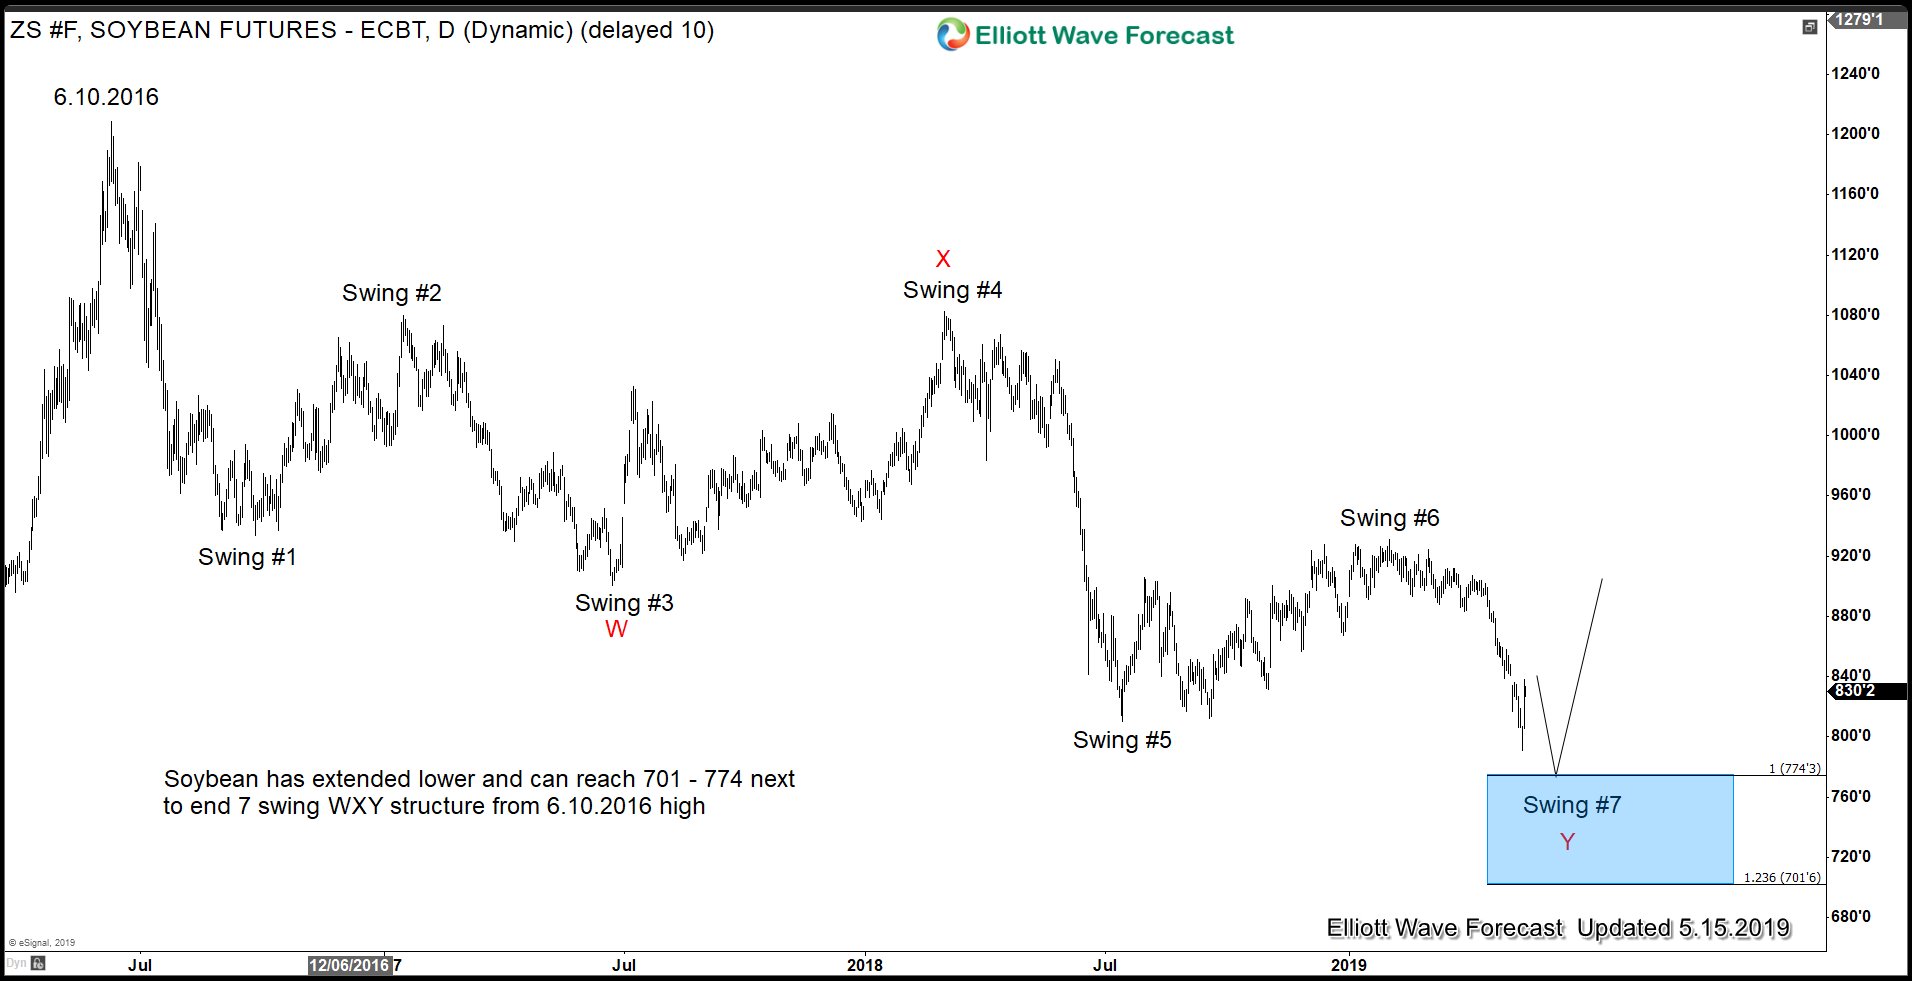
Soybean at Risk of Further Selloff as Trade War Escalates
Read MoreSummary The months-long trade negotiation between the U.S and China has failed to reach an agreement. Sticking points of the negotiation centers around intellectual property and technology transfer. The two sides can not come into agreement yet. The U.S. has increased the tariffs and China has retaliated, effectively escalating the trade war. One of the […]
-
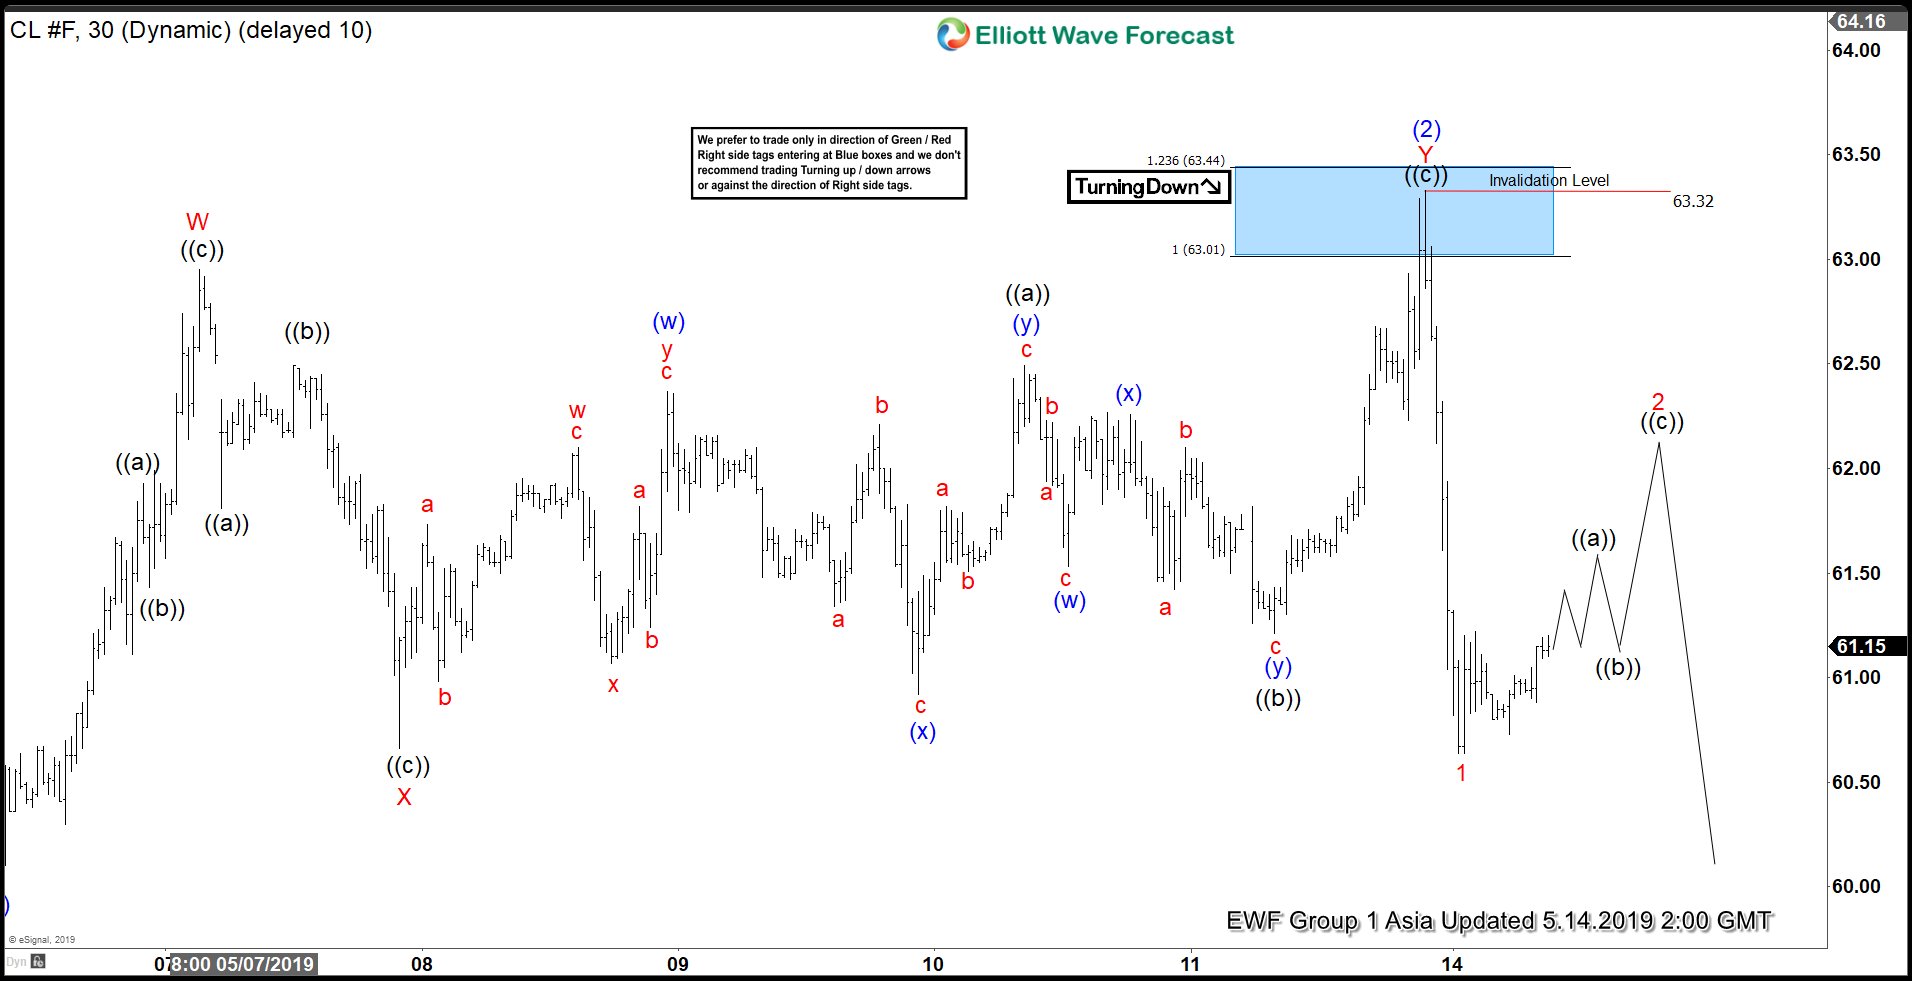
Elliott Wave View Calling for More Downside in Oil
Read MoreOil (CL_F) shows a 5 waves down from April 23 high, looking for further downside. This article & video explains the short term Elliottwave path for Oil.
-
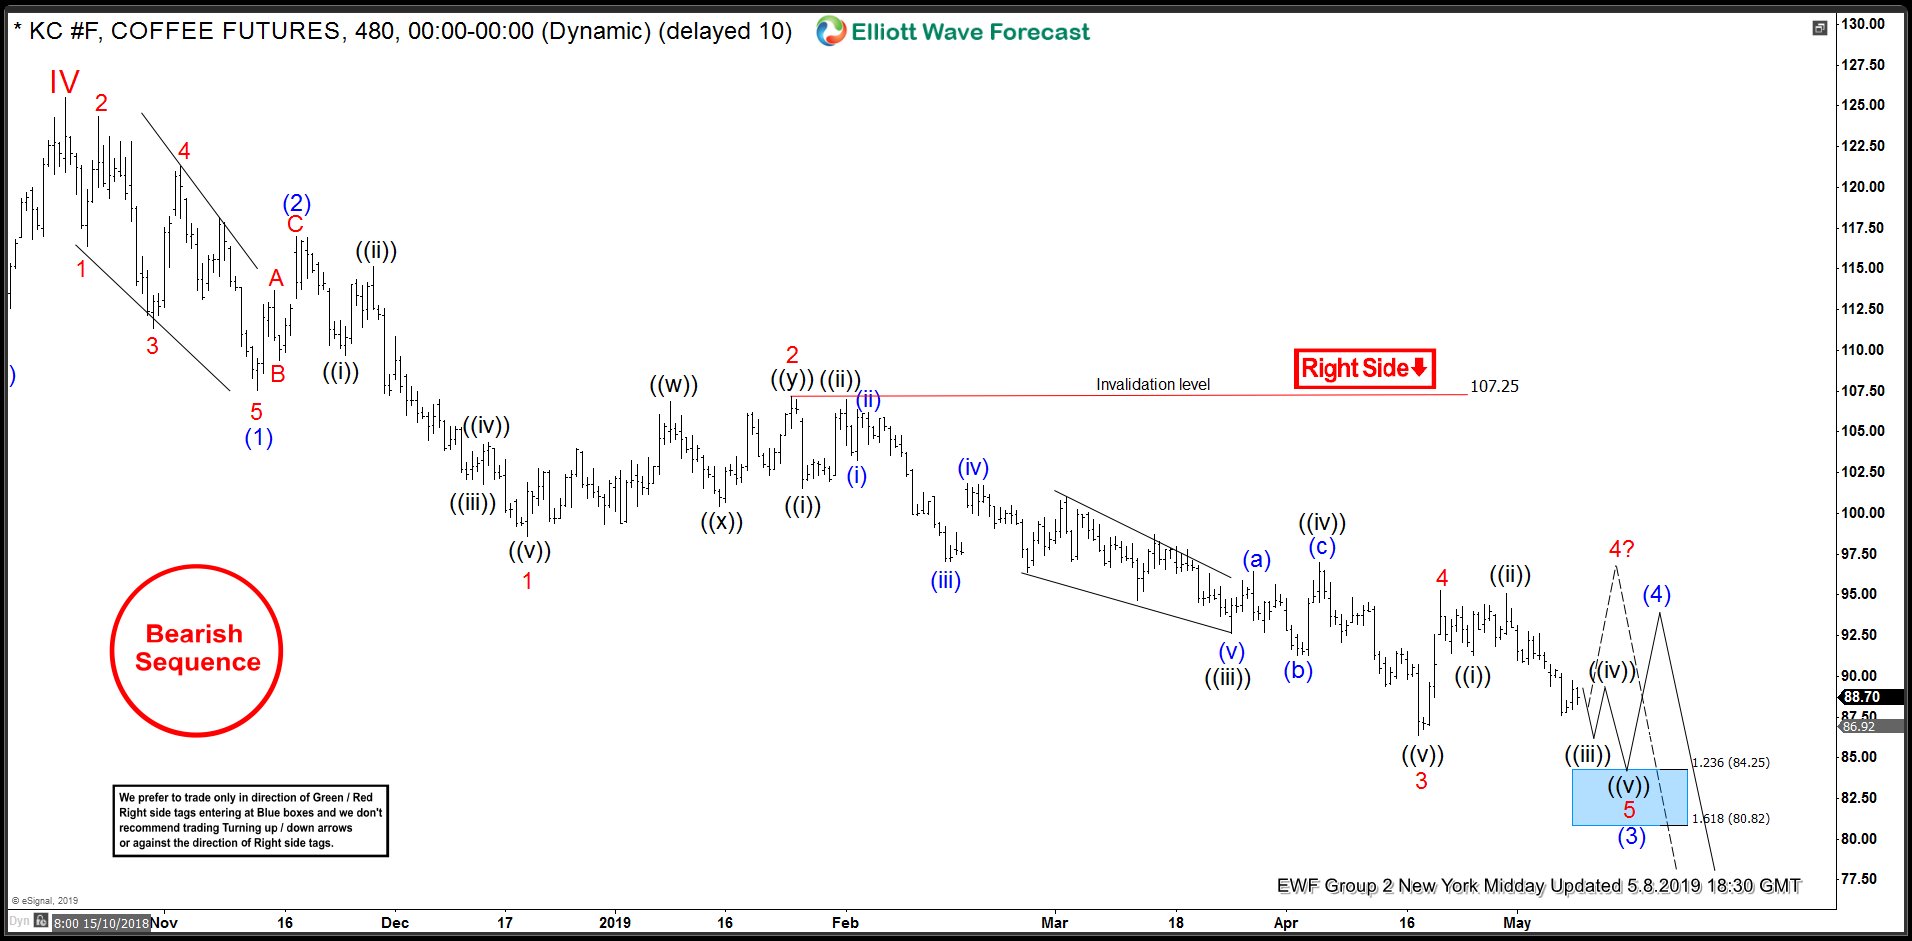
Coffee: Elliott Wave Impulse In Progress
Read MoreLast month, we looked at the bearish incomplete sequence in $KC_F (Coffee) since 11.8.2016 peak but today we would be looking at the Elliott wave structure of the decline from 11.8.2016 peak in the daily time frame and decline from 10.19.2018 peak in the 480 minute time frame to give readers an idea of where […]
-
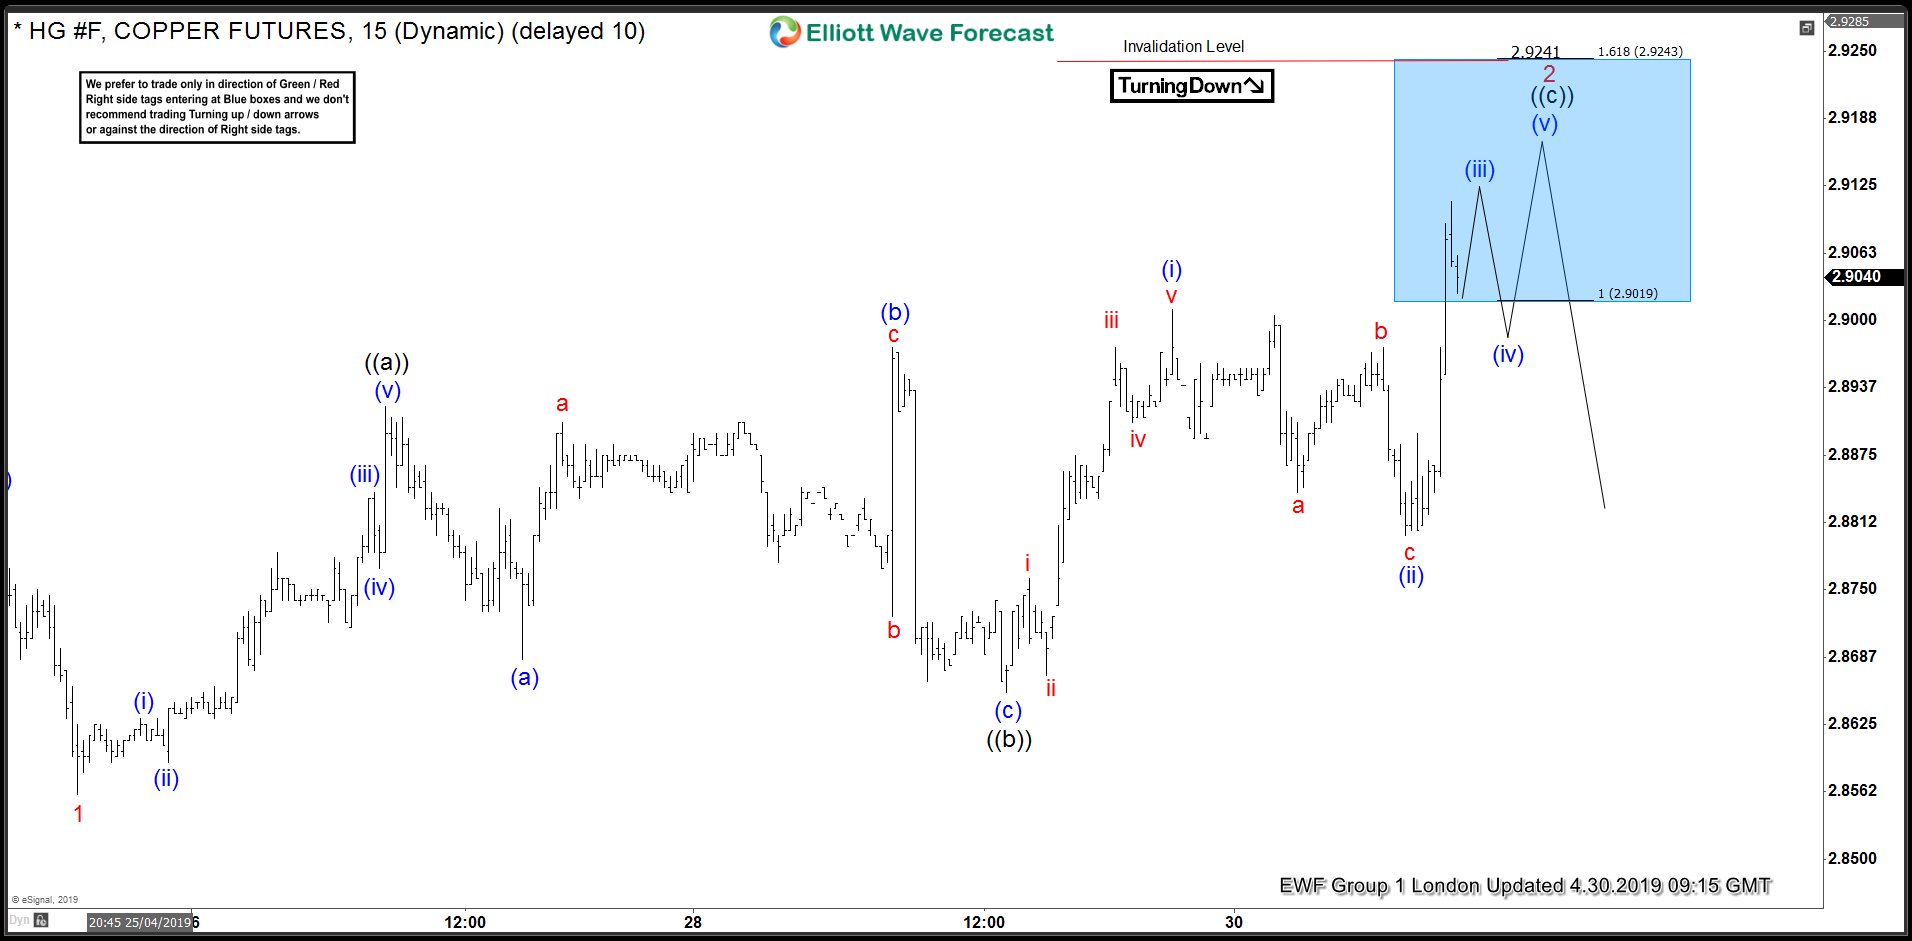
COPPER Forecasting The Decline From The Blue Box Area
Read MoreHello fellow traders. In this technical blog we’re going to take a quick look at the charts of Copper futures published in members area of the website. As our members know, Copper is correcting the cycle from the 2.4536 low. Short term cycle from the April 17th peak is still in progress and we expect […]
-

Gold Elliott Wave View: Showing Impulsive Decline
Read MoreGold cycle from 2/20/2019 peak is showing incomplete structure to the downside favoring more weakness towards $1258.18-1242.45 area lower. This article & video talks about the short term Elliott Wave path in the metal.
-
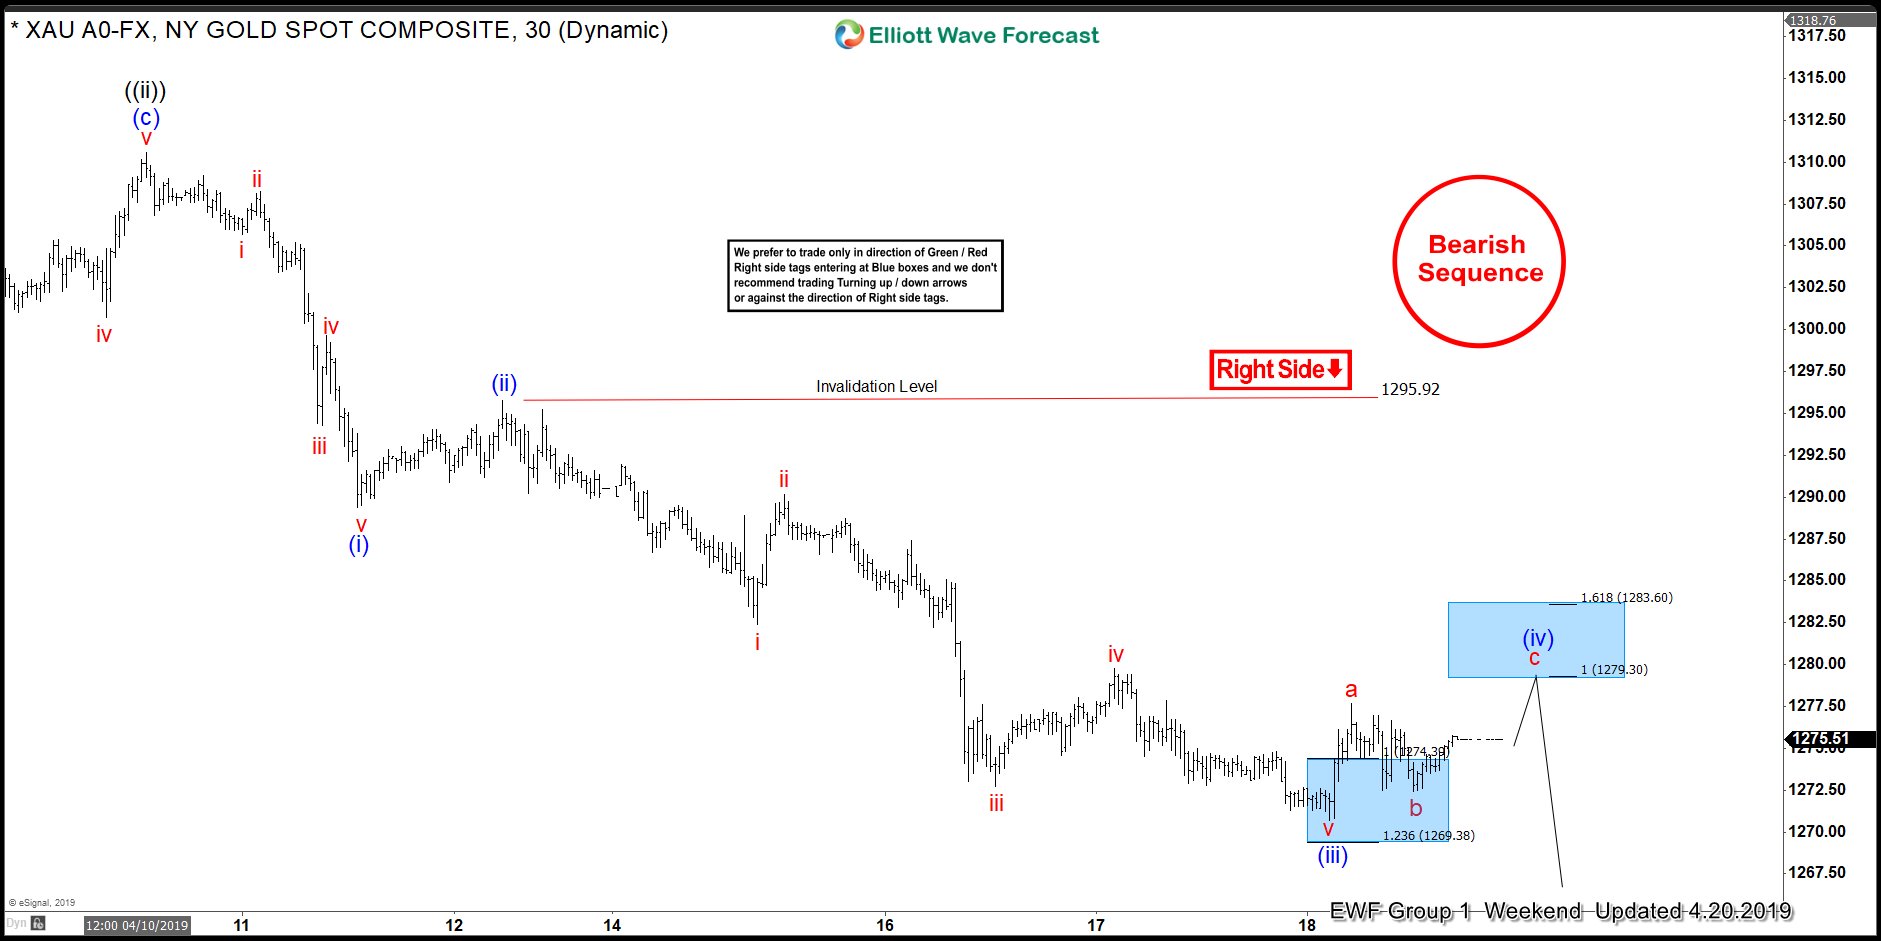
GOLD ( $XAUUSD ) Incomplete Bearish Sequences Calling The Decline
Read MoreHello fellow traders. In this technical blog we’re going to take a quick look at the charts of GOLD published in members area of the website. GOLD has had incomplete sequences in the cycle from the February 2oth peak (1347.43) . Consequently , we advised clients to avoid buying GOLD and keep on selling the […]