
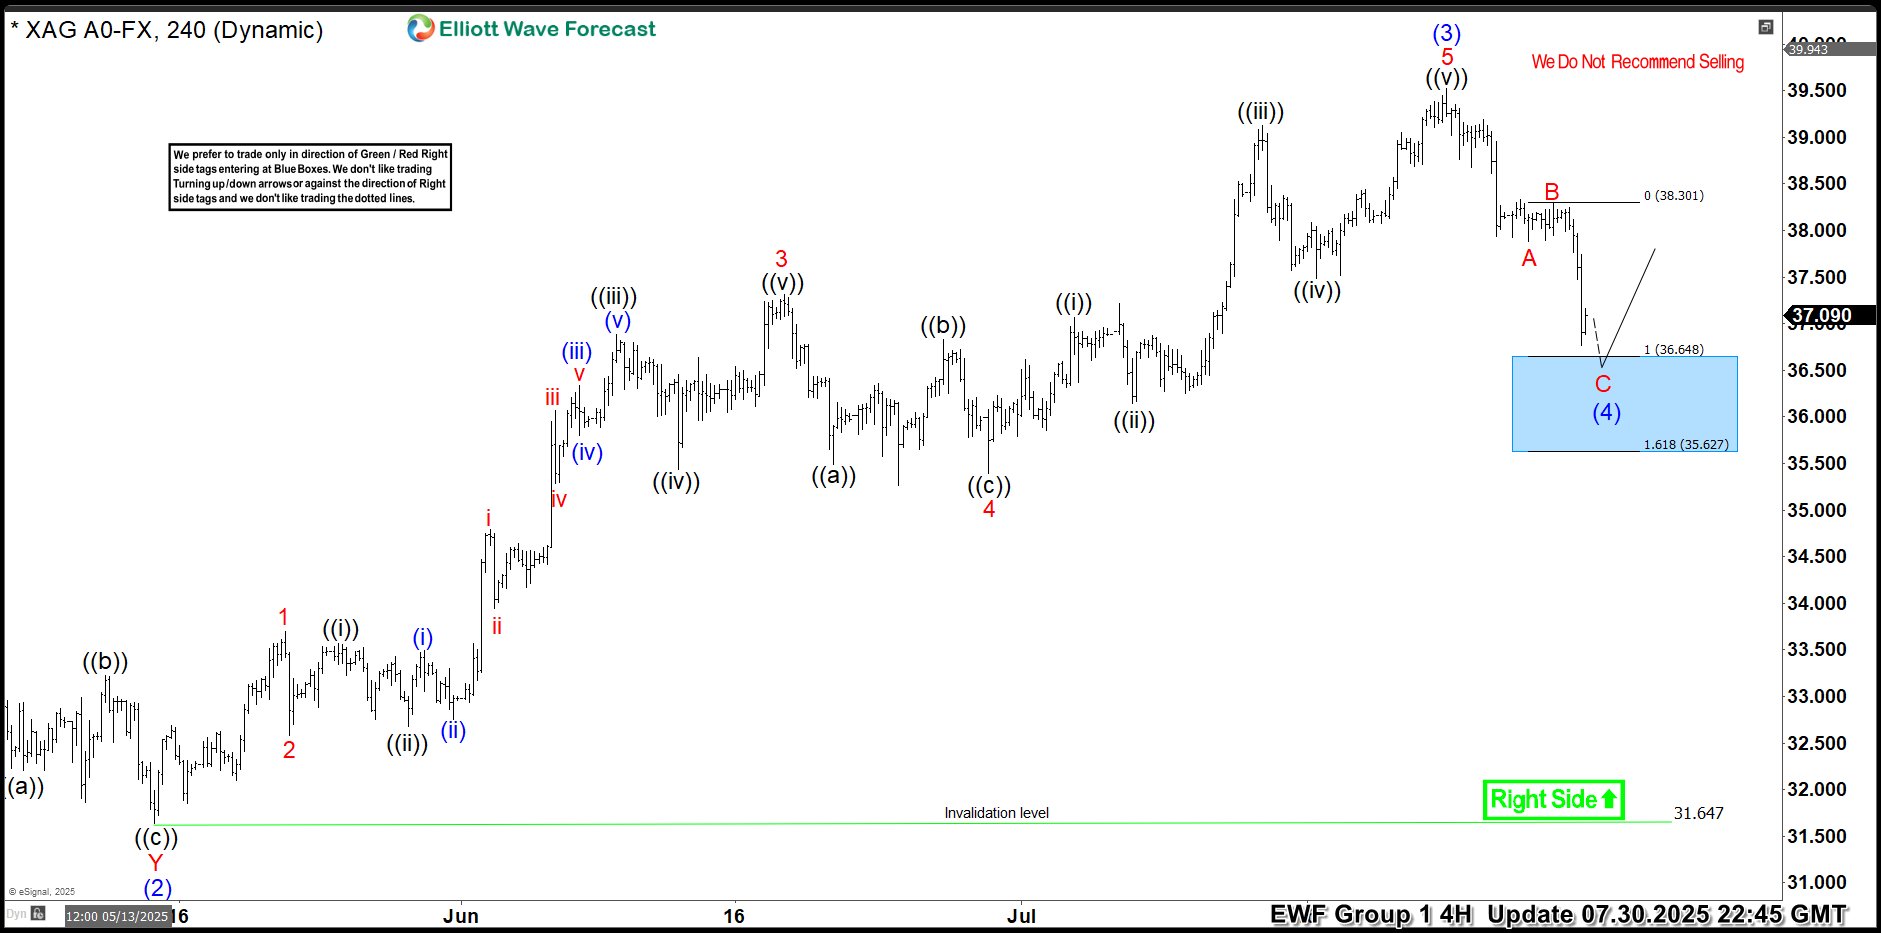
Hello traders. As our members know, we have had many profitable trading setups recently. In this technical article, we are going to talk about another Elliott Wave trading setup we got in Silver (XAGUSD). The commodity has completed its correction exactly at the Equal Legs zone, also known as the Blue Box Area. In this […]
-
Elliott Wave View: Gold Extends Higher in Impulsive Move
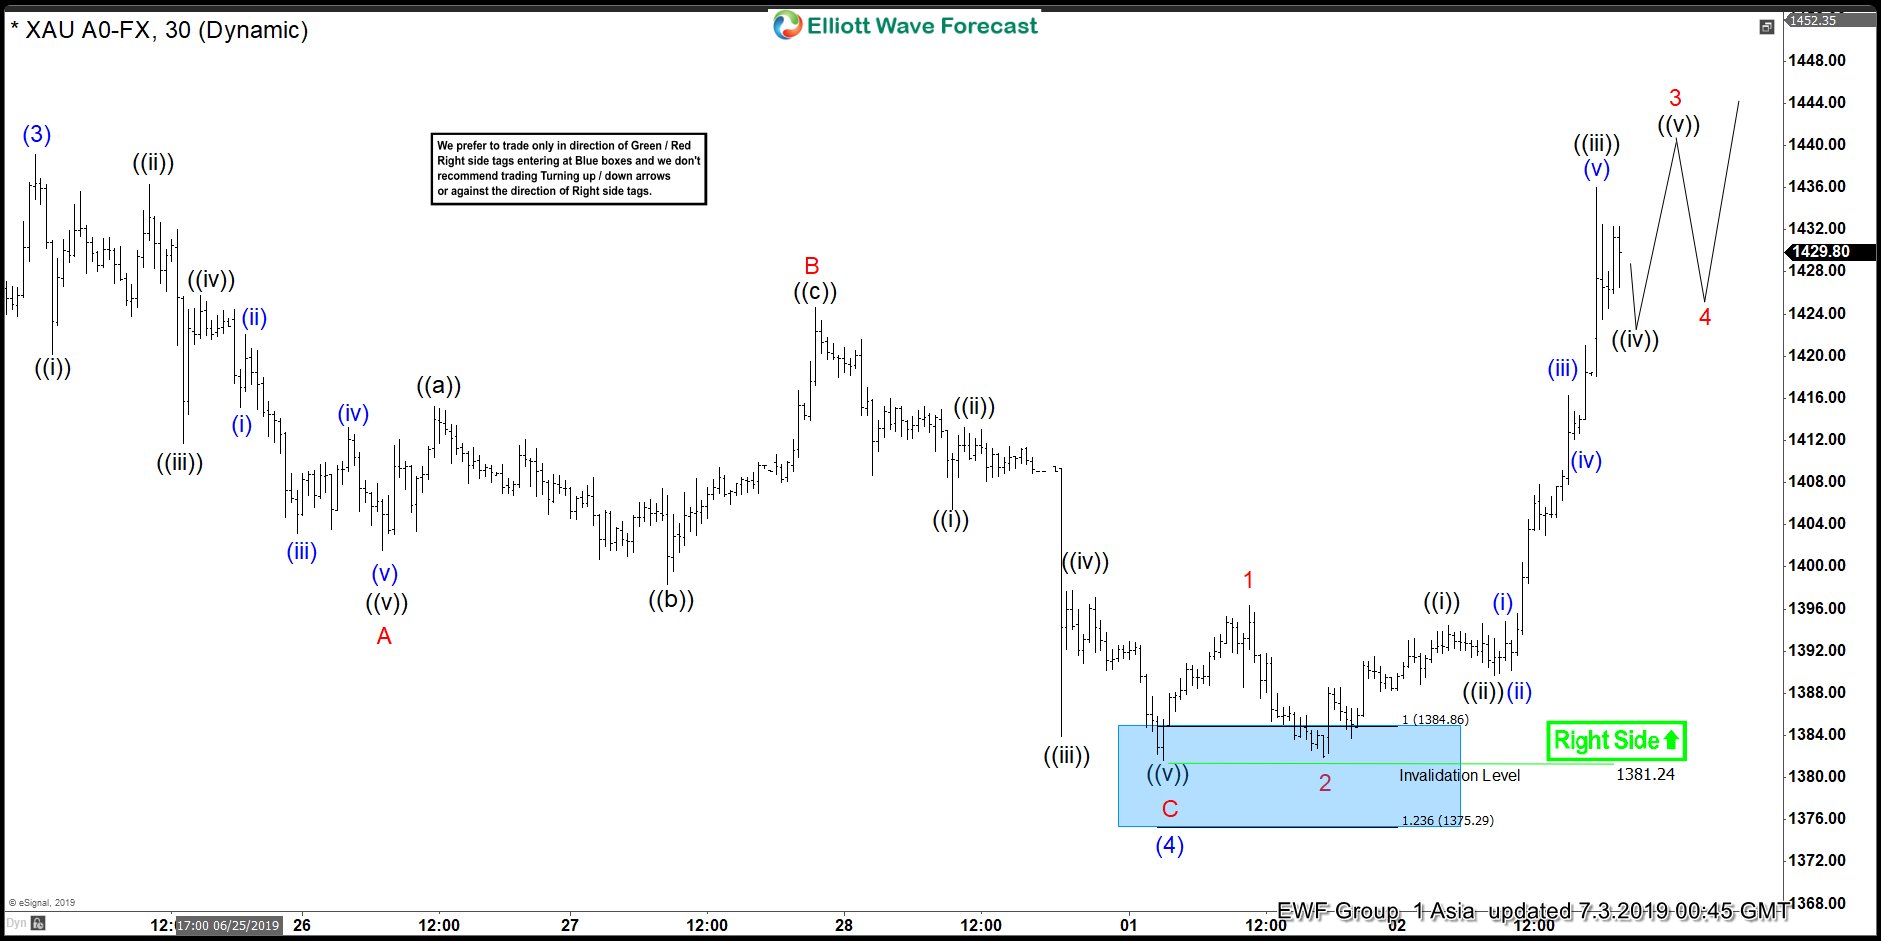
Read MoreShort Term Elliott wave view in Gold suggests that the decline to $1381.42 low on July 1 ended wave (4). Above from there, the yellow metal is rallying higher as an impulse Elliott Wave structure looking for more upside within wave (5). Up from July 1 low, wave 1 ended at 1396.35 and wave 2 pullback […]
-
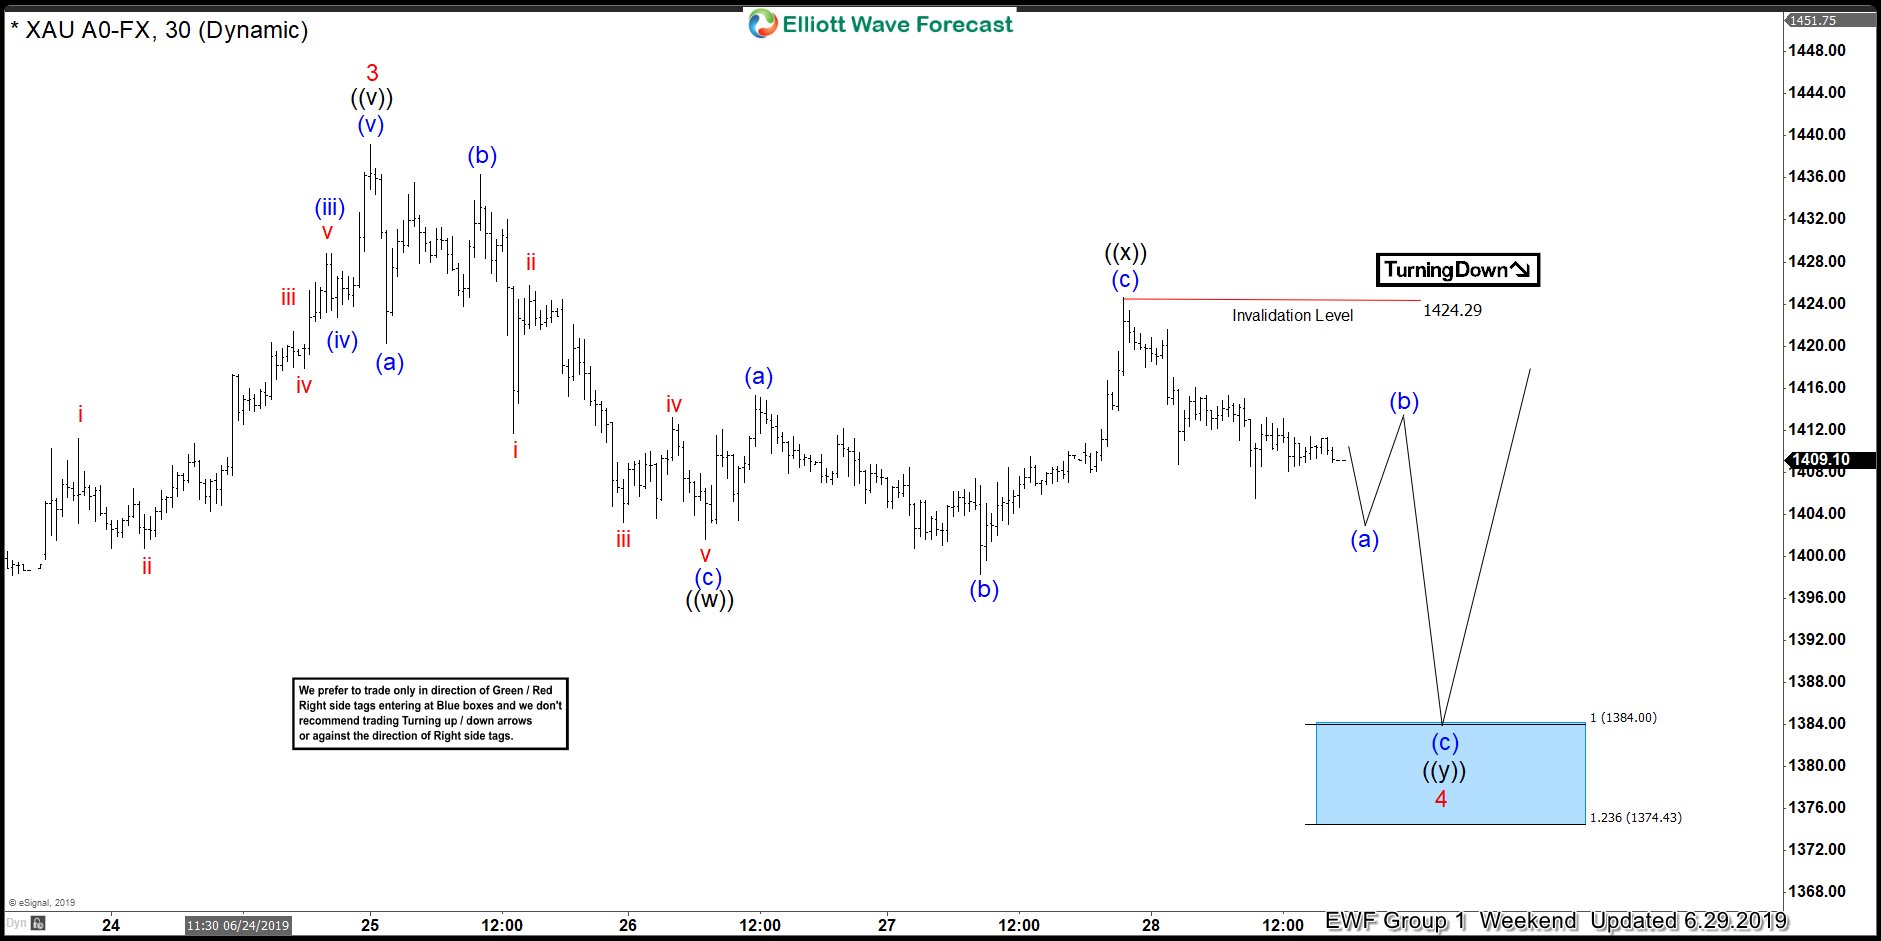
GOLD ( $XAUUSD ) Buying The Dips At The Blue Box
Read MoreHello fellow traders. In this technical blog we’re going to take a quick look at the Elliott Wave charts of GOLD . As our members know GOLD has incomplete bullish sequences within August 2018 cycle. When the price broke 02/20 peak, GOLD became bullish against the 1265.92 low. Since then we favor the long side. […]
-
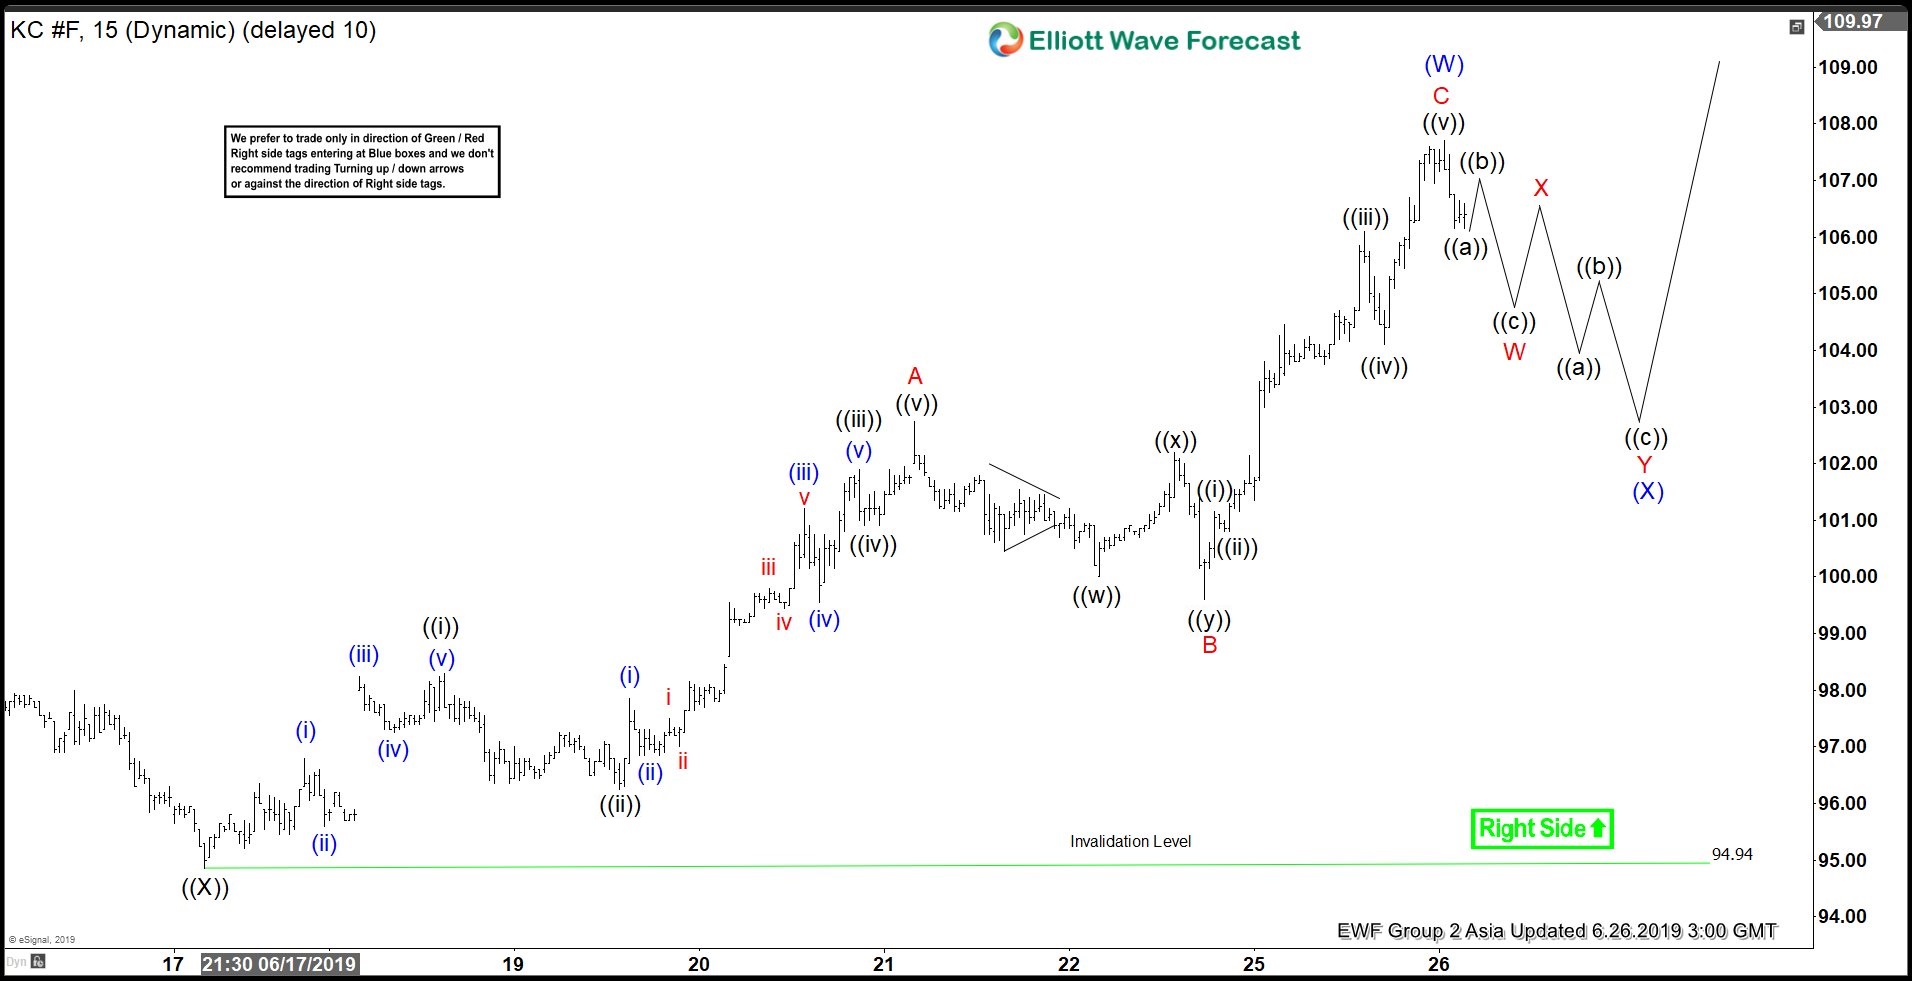
Elliott Wave View: Coffee Shows Bullish Sequence
Read MoreCoffee shows a 5 swing sequence from April 17 low favoring further upside. This article & video shows the Elliott Wave path.
-
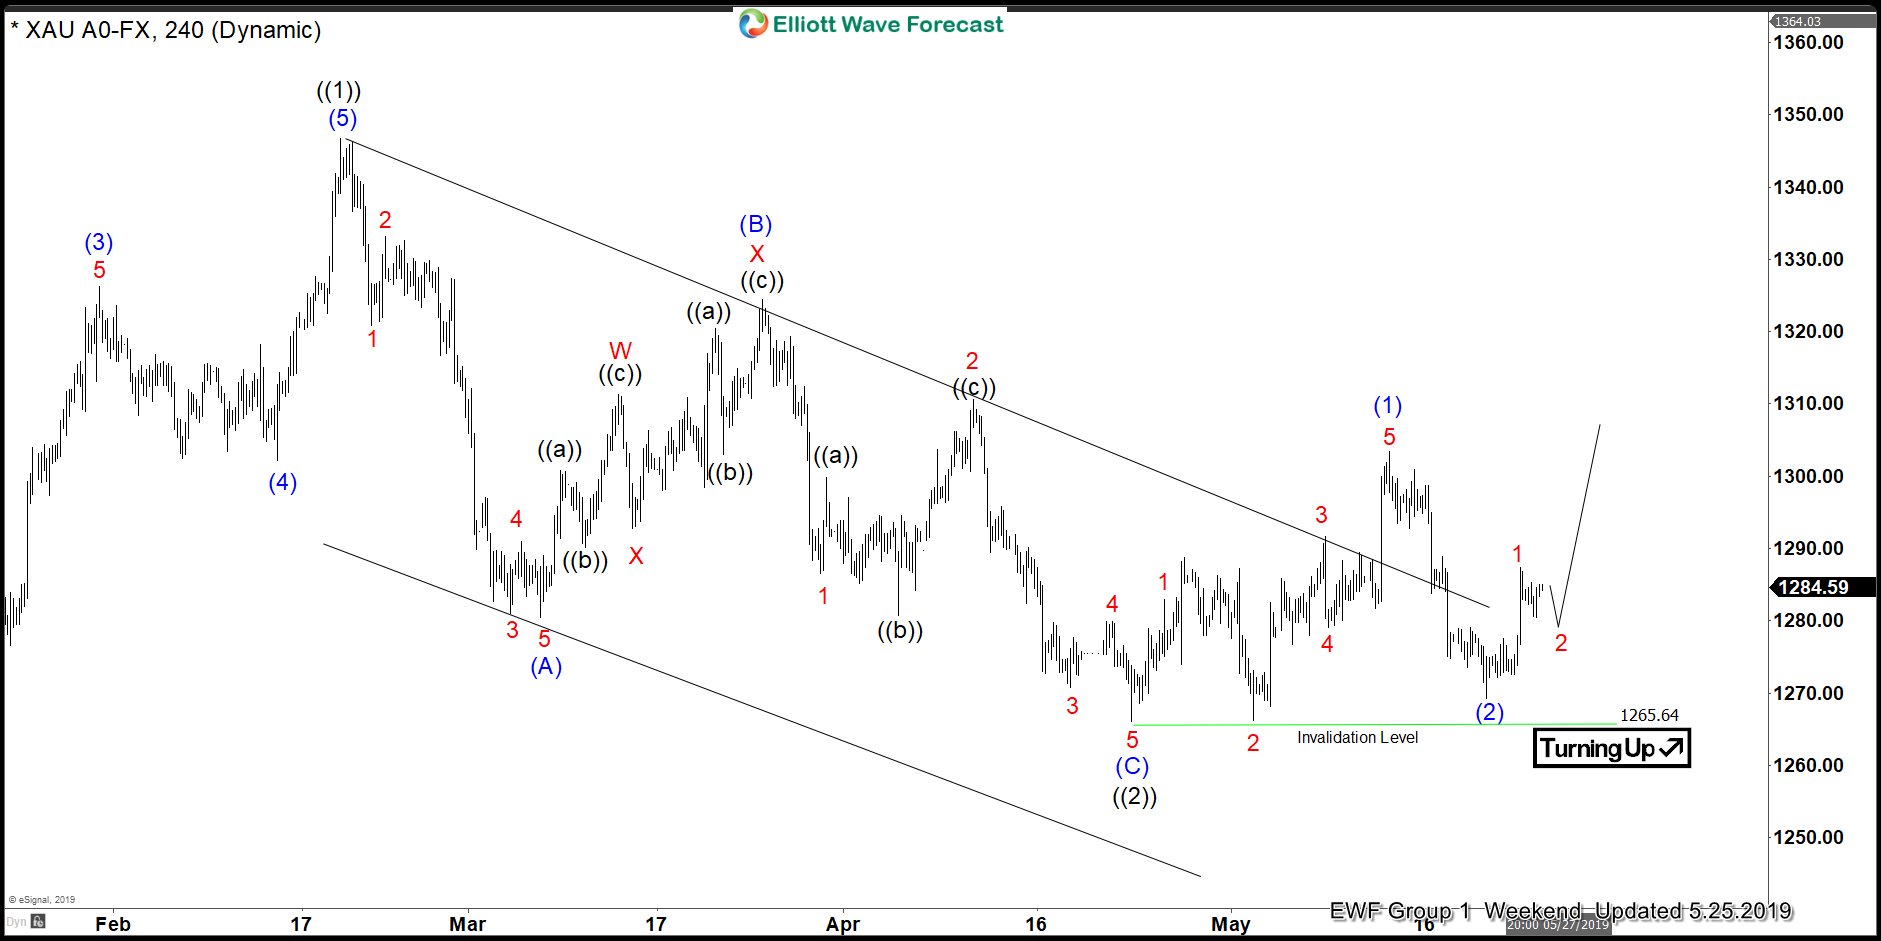
Gold ($XAUUSD) Forecasting Elliott Wave Path Since April Low
Read MoreIn this article, we will take a look at the rally which took place in Gold ($XAUUSD) since April 2019 low. We will present a series of charts to show what the forecast was and how it unfolded. $XAUUSD 4 Hour Elliott Wave Analysis 5.25.2019 Chart below shows wave (( 2)) completed at $1265.64 on […]
-
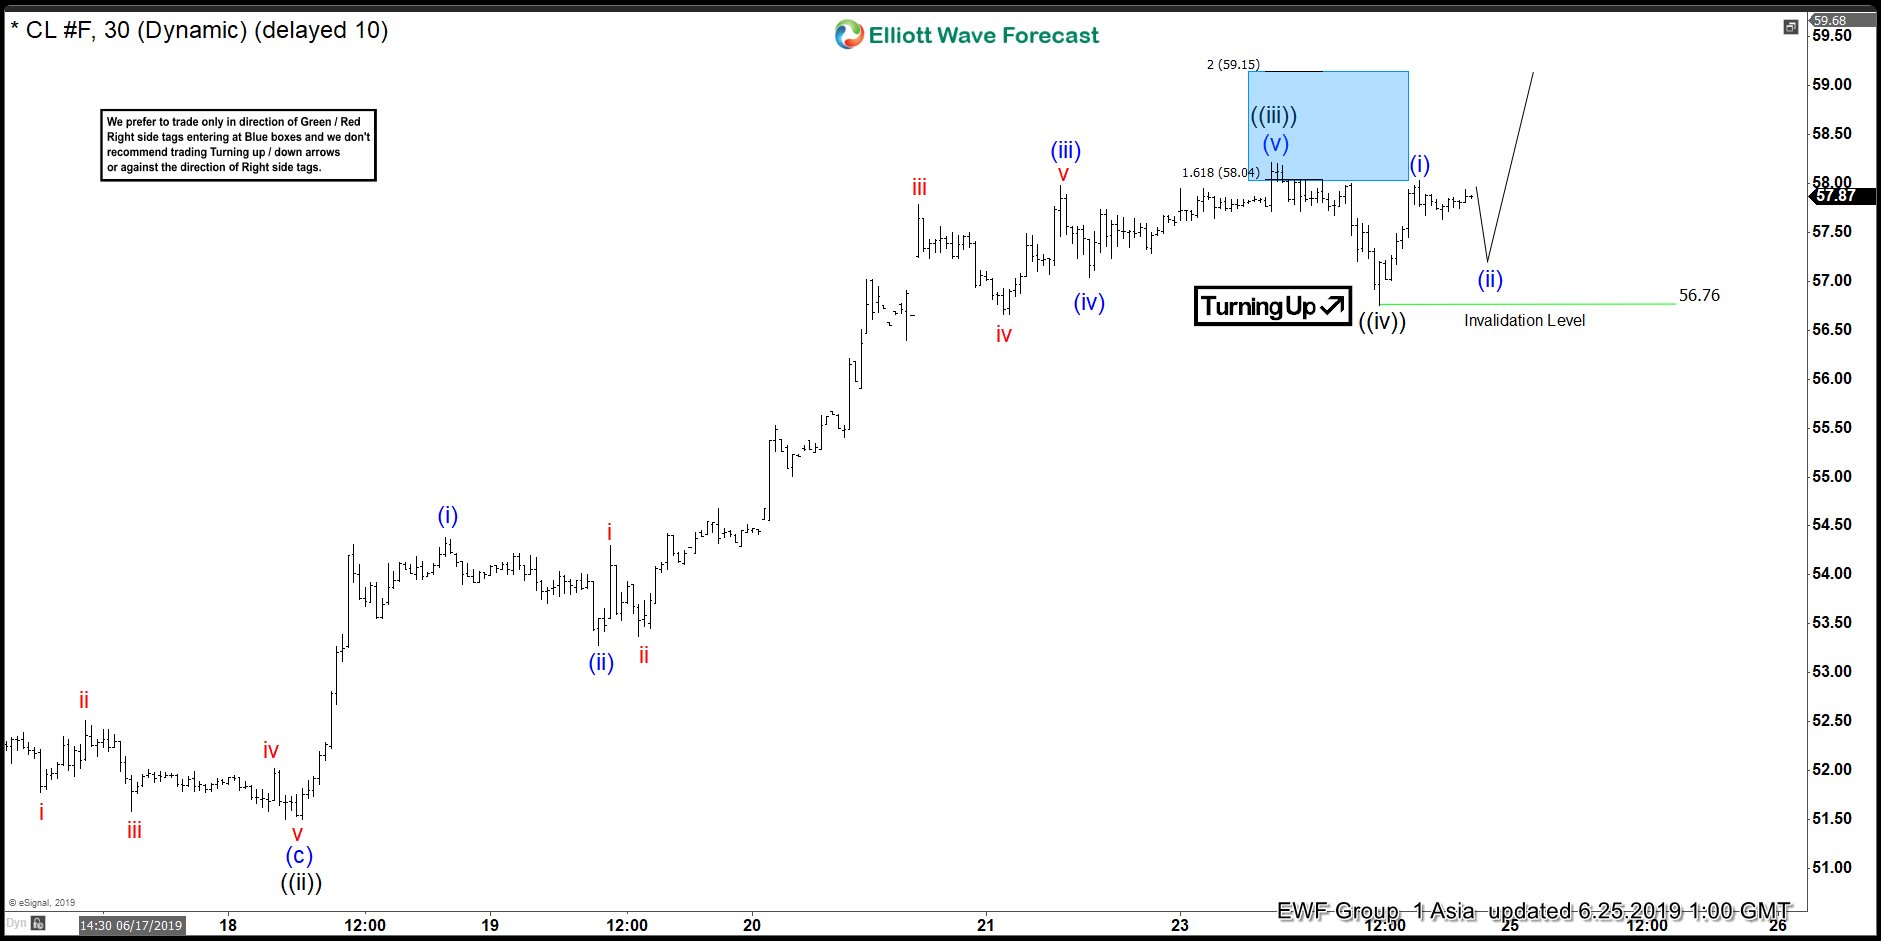
Oil Elliott Wave View: Impulsive Rally in Progress
Read MoreOil rallies impulsively from June 5 low & extension higher is expected. This article & video show short term Elliot Wave path.
-
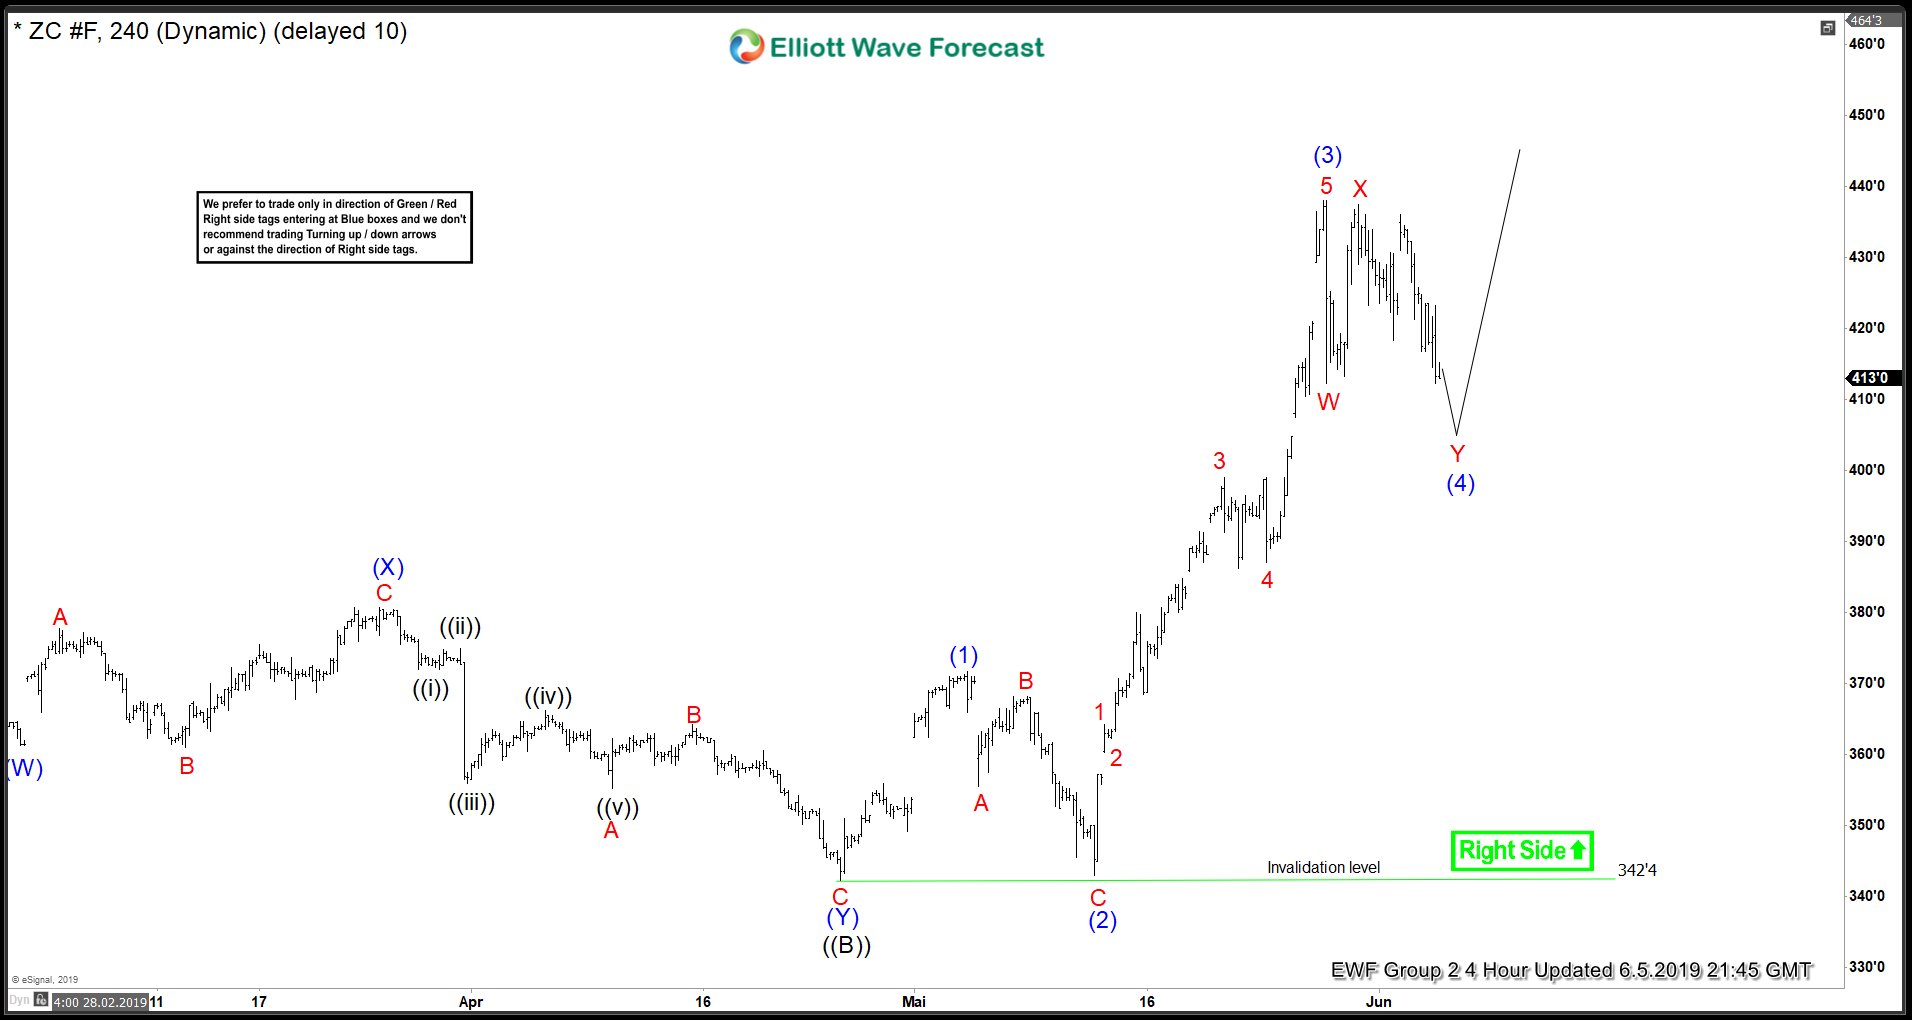
CORN ( $ZC_F ) Forecasting The Rally After Double Three Pattern
Read MoreHello fellow traders. In this technical blog we’re going to take a quick look at the charts of CORN ($ZC_F) published in members area of the website. As our members know we have been calling for extension higher in CORN within the April cycle. Rally from the 342’4 low has made extended leg up, so […]