
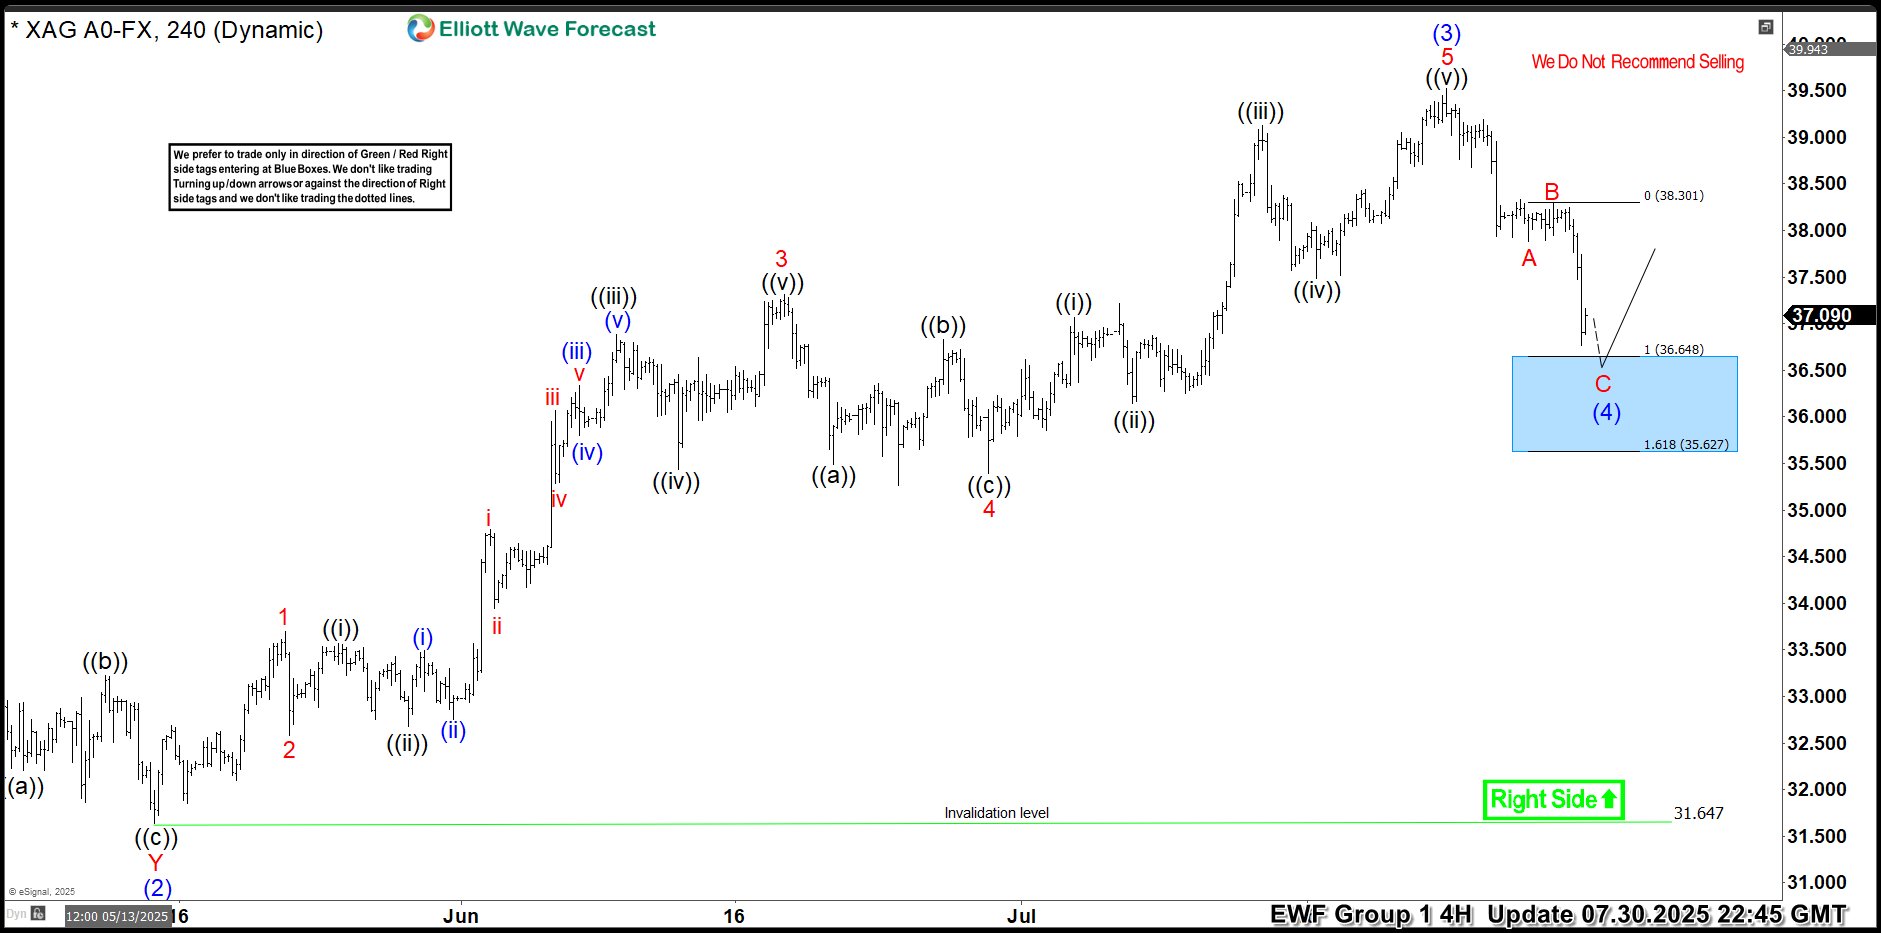
Hello traders. As our members know, we have had many profitable trading setups recently. In this technical article, we are going to talk about another Elliott Wave trading setup we got in Silver (XAGUSD). The commodity has completed its correction exactly at the Equal Legs zone, also known as the Blue Box Area. In this […]
-
Palladium: Buying Elliott Wave 4 Dip in Blue Box
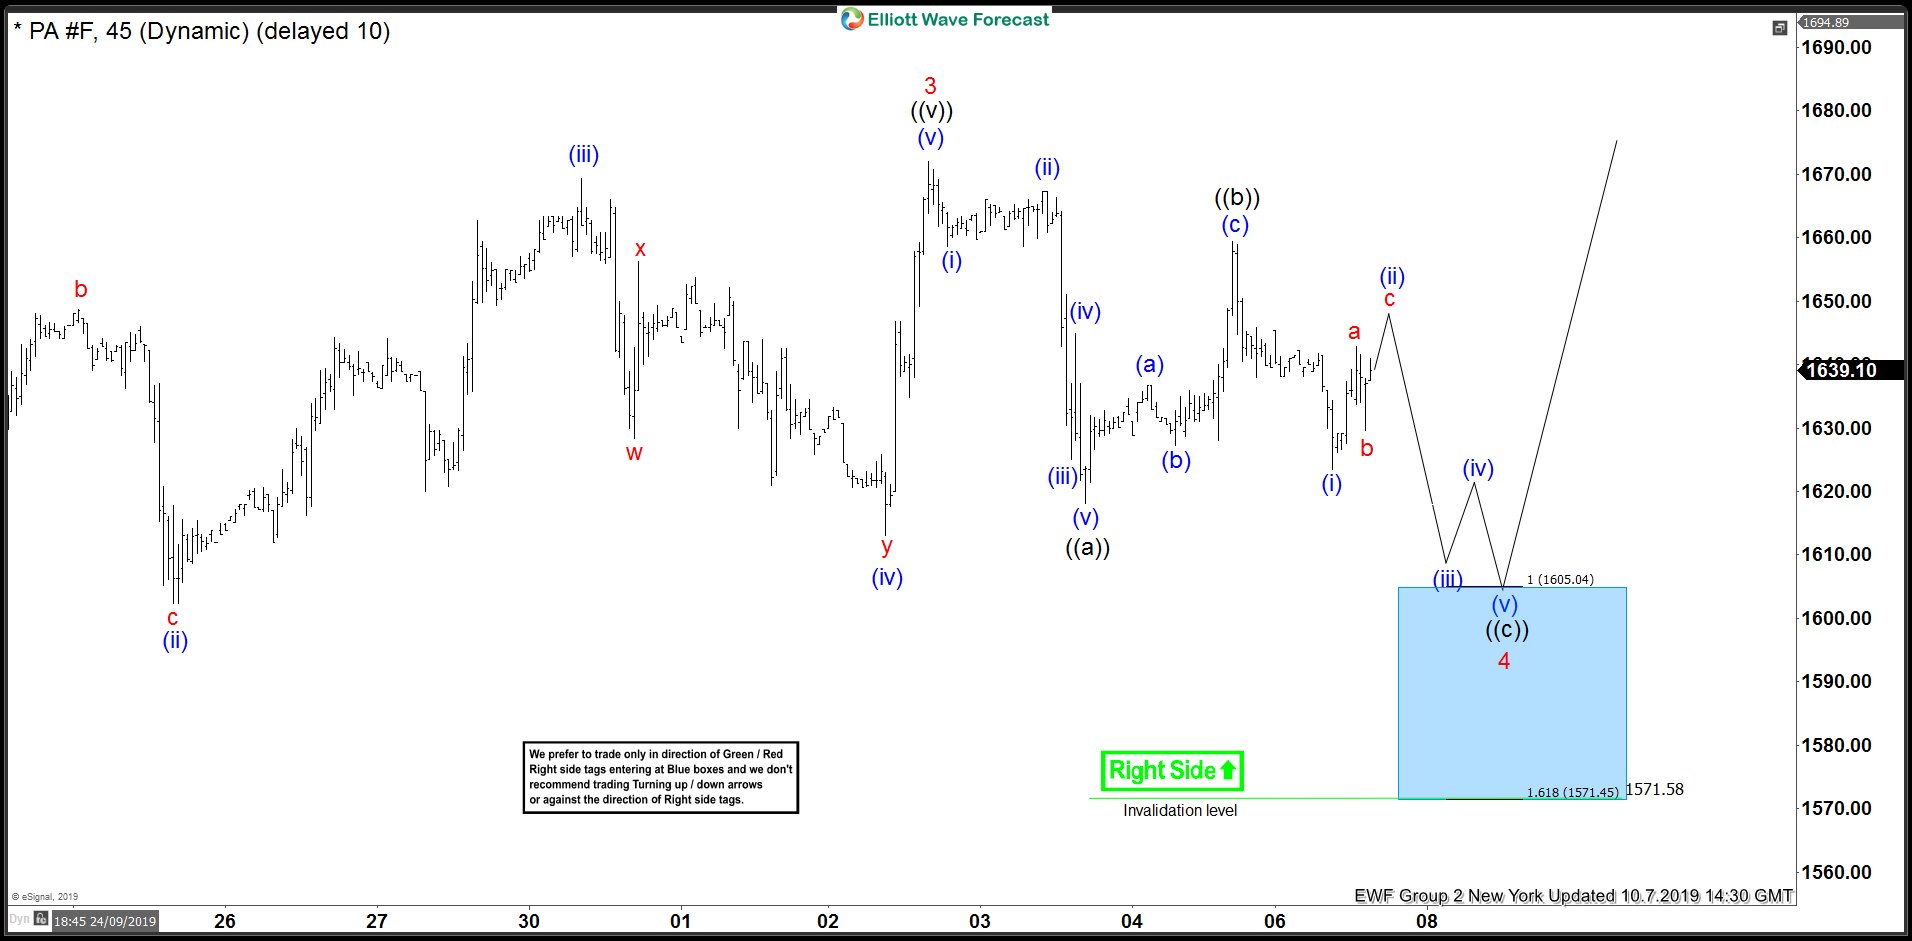
Read MoreThis week we saw Palladium rallying to new all time high and touching the $1700 psychological barrier. At Elliottwave-Forecast, we told our members last week that any dips should be viewed as a buying opportunity and we highlighted the area where we expected buyers to appear with a blue box. Blue boxes on our charts are […]
-

Elliott Wave View: Has Silver Started the Next Leg Higher
Read MoreSilver shows a short term incomplete sequence from Oct 1 low, favoring more upside. This article and video looks at the short term Elliott Wave path.
-
Elliott Wave View: Gold May Have Completed Correction
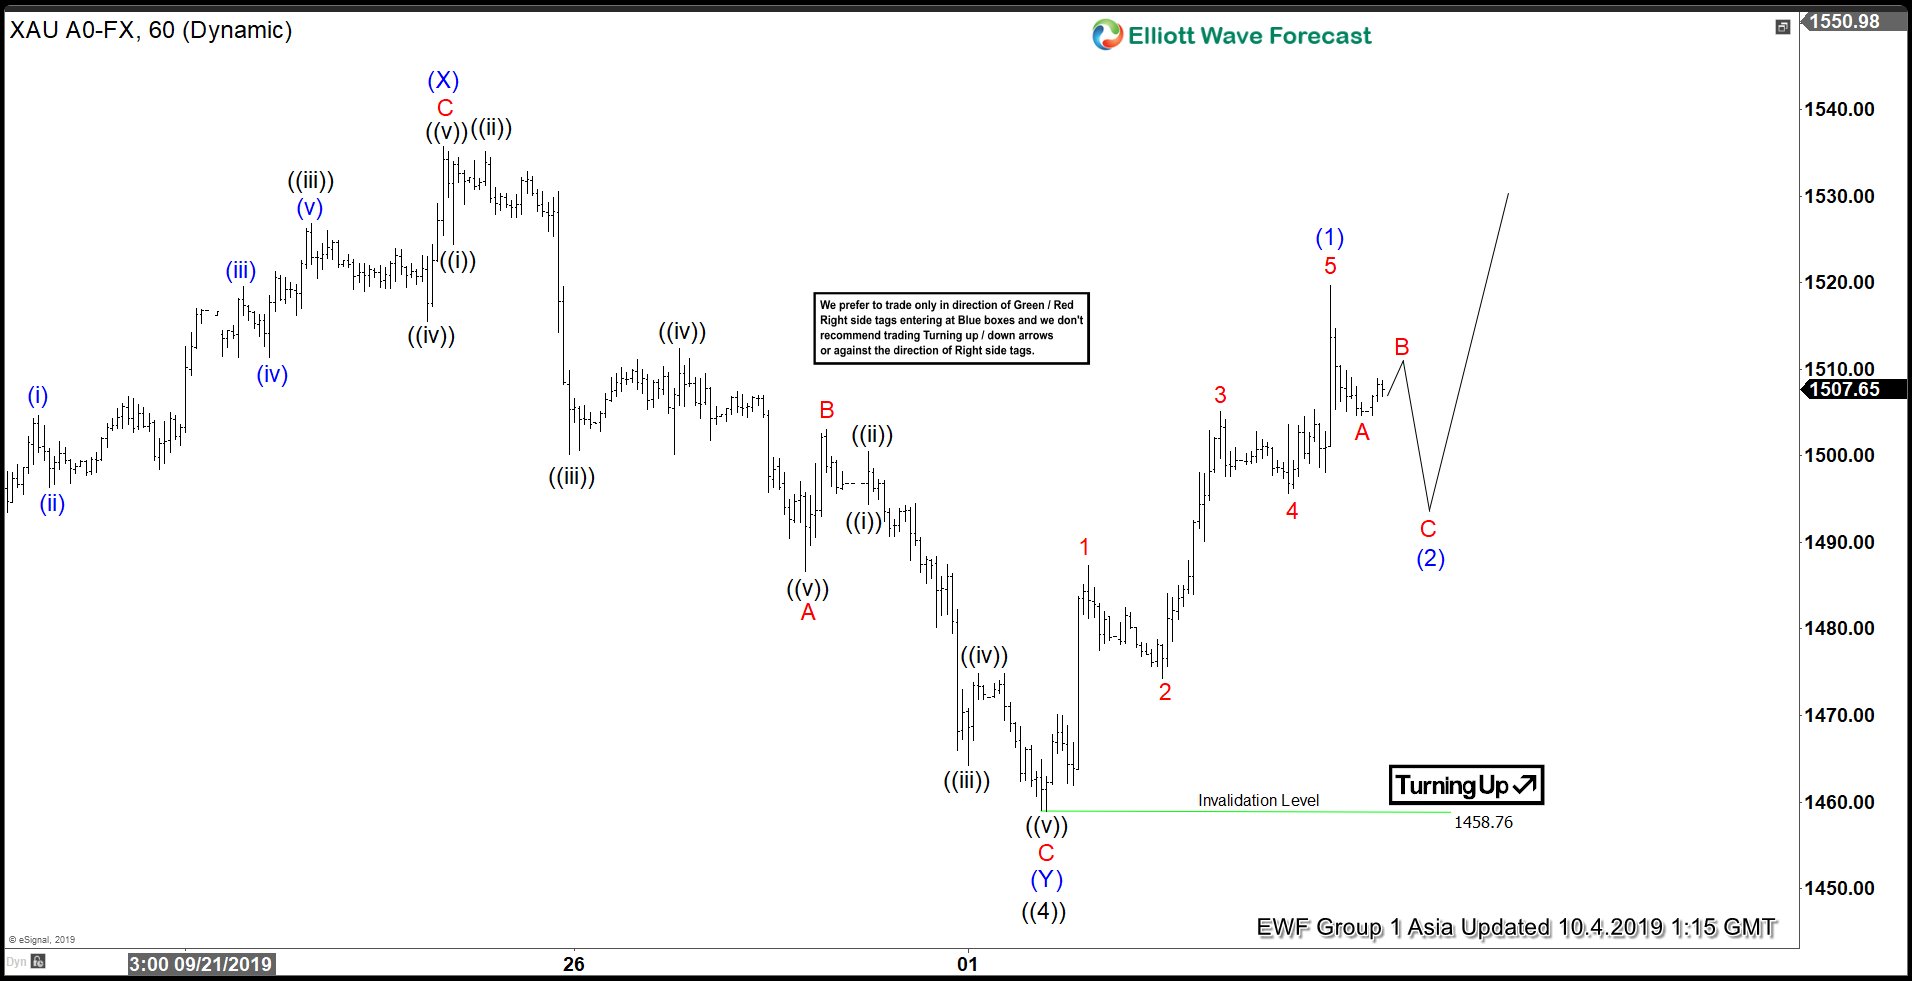
Read MoreElliott Wave view on Gold suggests the rally from August 2018 low last year remains in progress as a 5 waves impulse Elliott Wave structure. On the 1 hour chart below, we can see wave ((4)) of this impulse is proposed complete at 1458.76. Internal subdivision of wave ((4)) unfolded as a double three where wave […]
-
Elliott Wave View: Oil Resumes Lower Impulsively
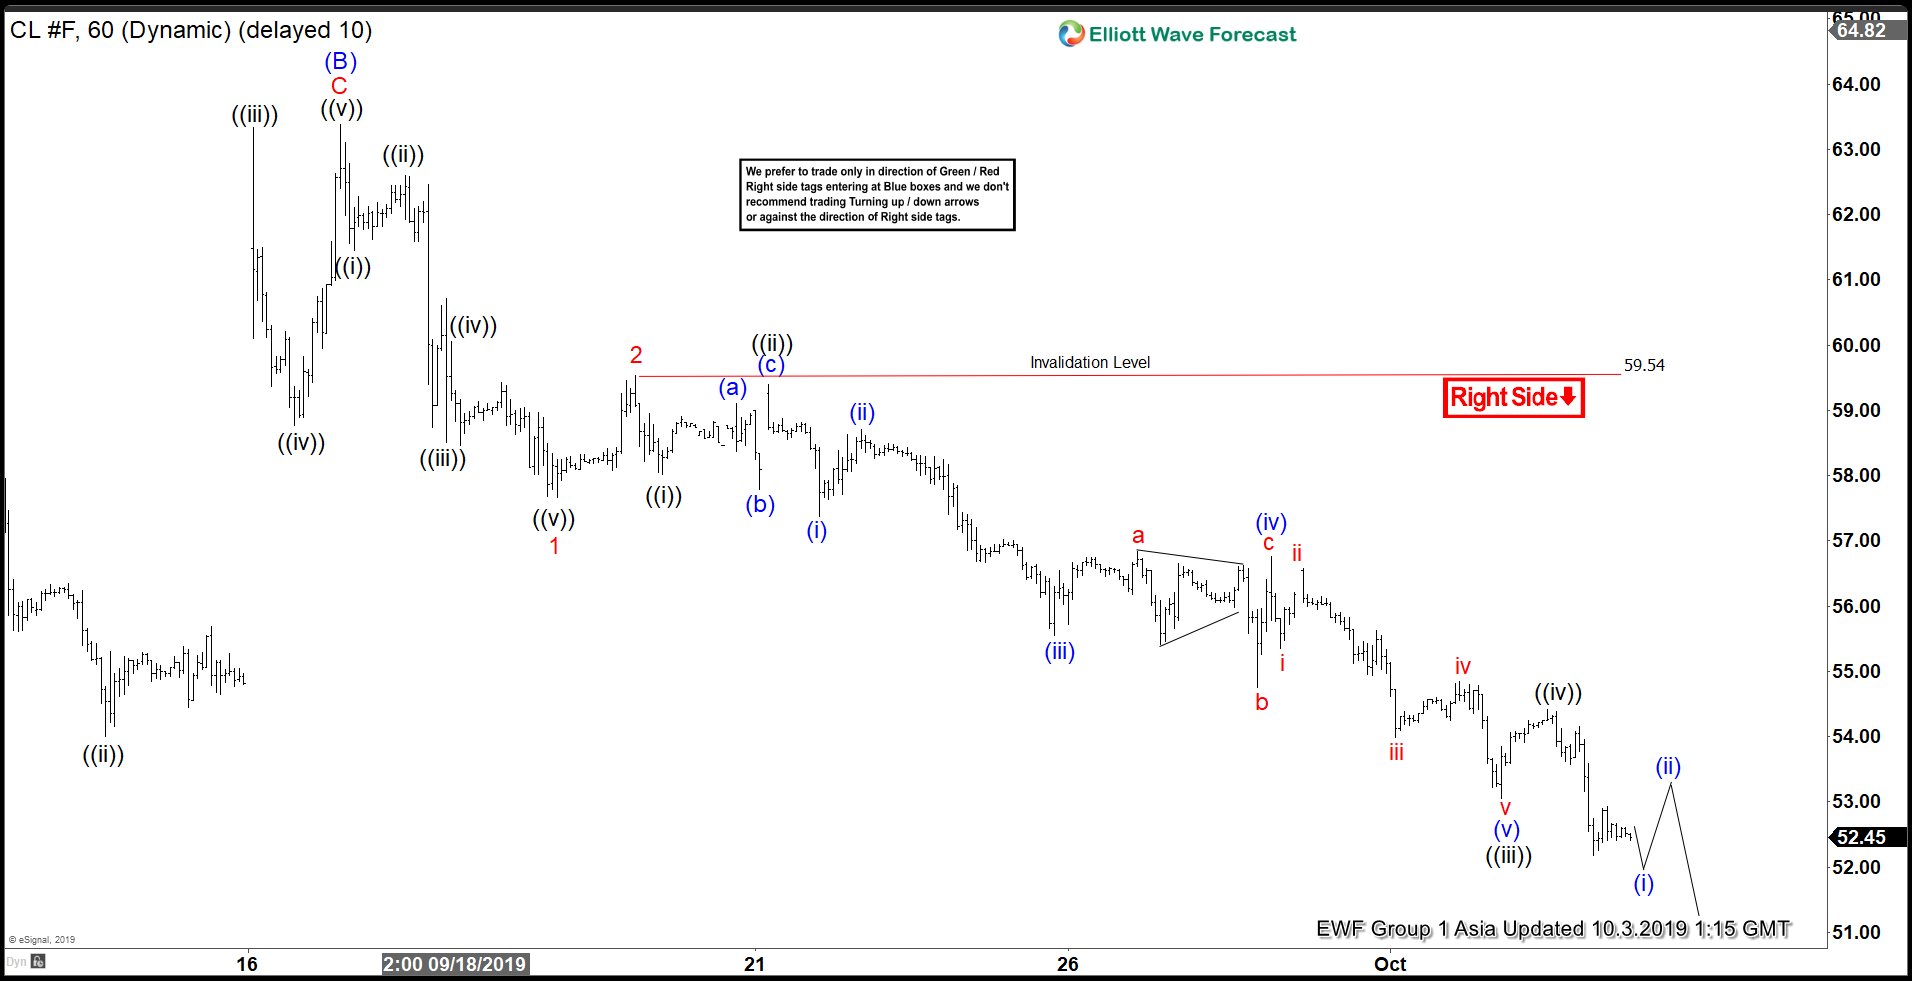
Read MoreShort term Elliott Wave view on Oil suggests wave (B) rally ended at 63.38 on September 17, 2019 high. The commodity has since turned lower within wave (C) which is unfolding as 5 waves impulse Elliott Wave structure. This view will get validation when it breaks below the previous low on August 7, 2019 low (50.52). […]
-
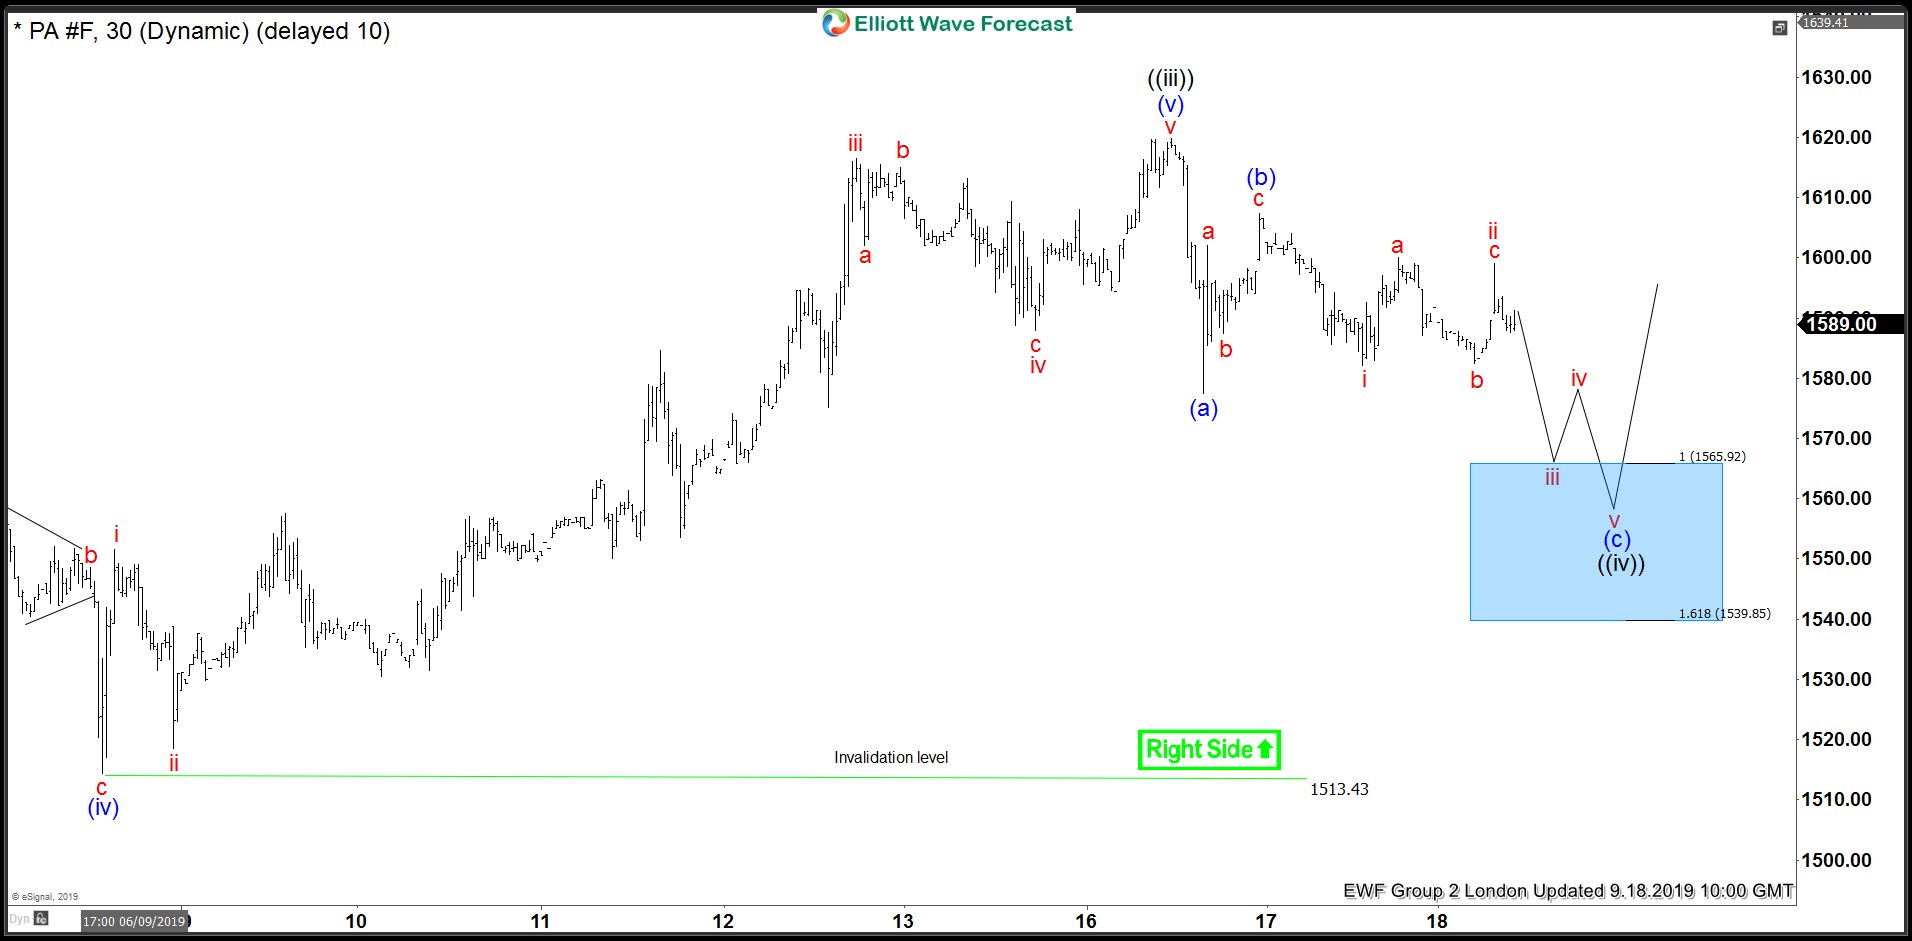
Palladium Bouncing From Elliott Wave Blue Box Area
Read MoreIn this blog, we take a look at the 1 hour Elliott Wave charts performance of Palladium, which our members took advantage at the blue box extreme areas.
-
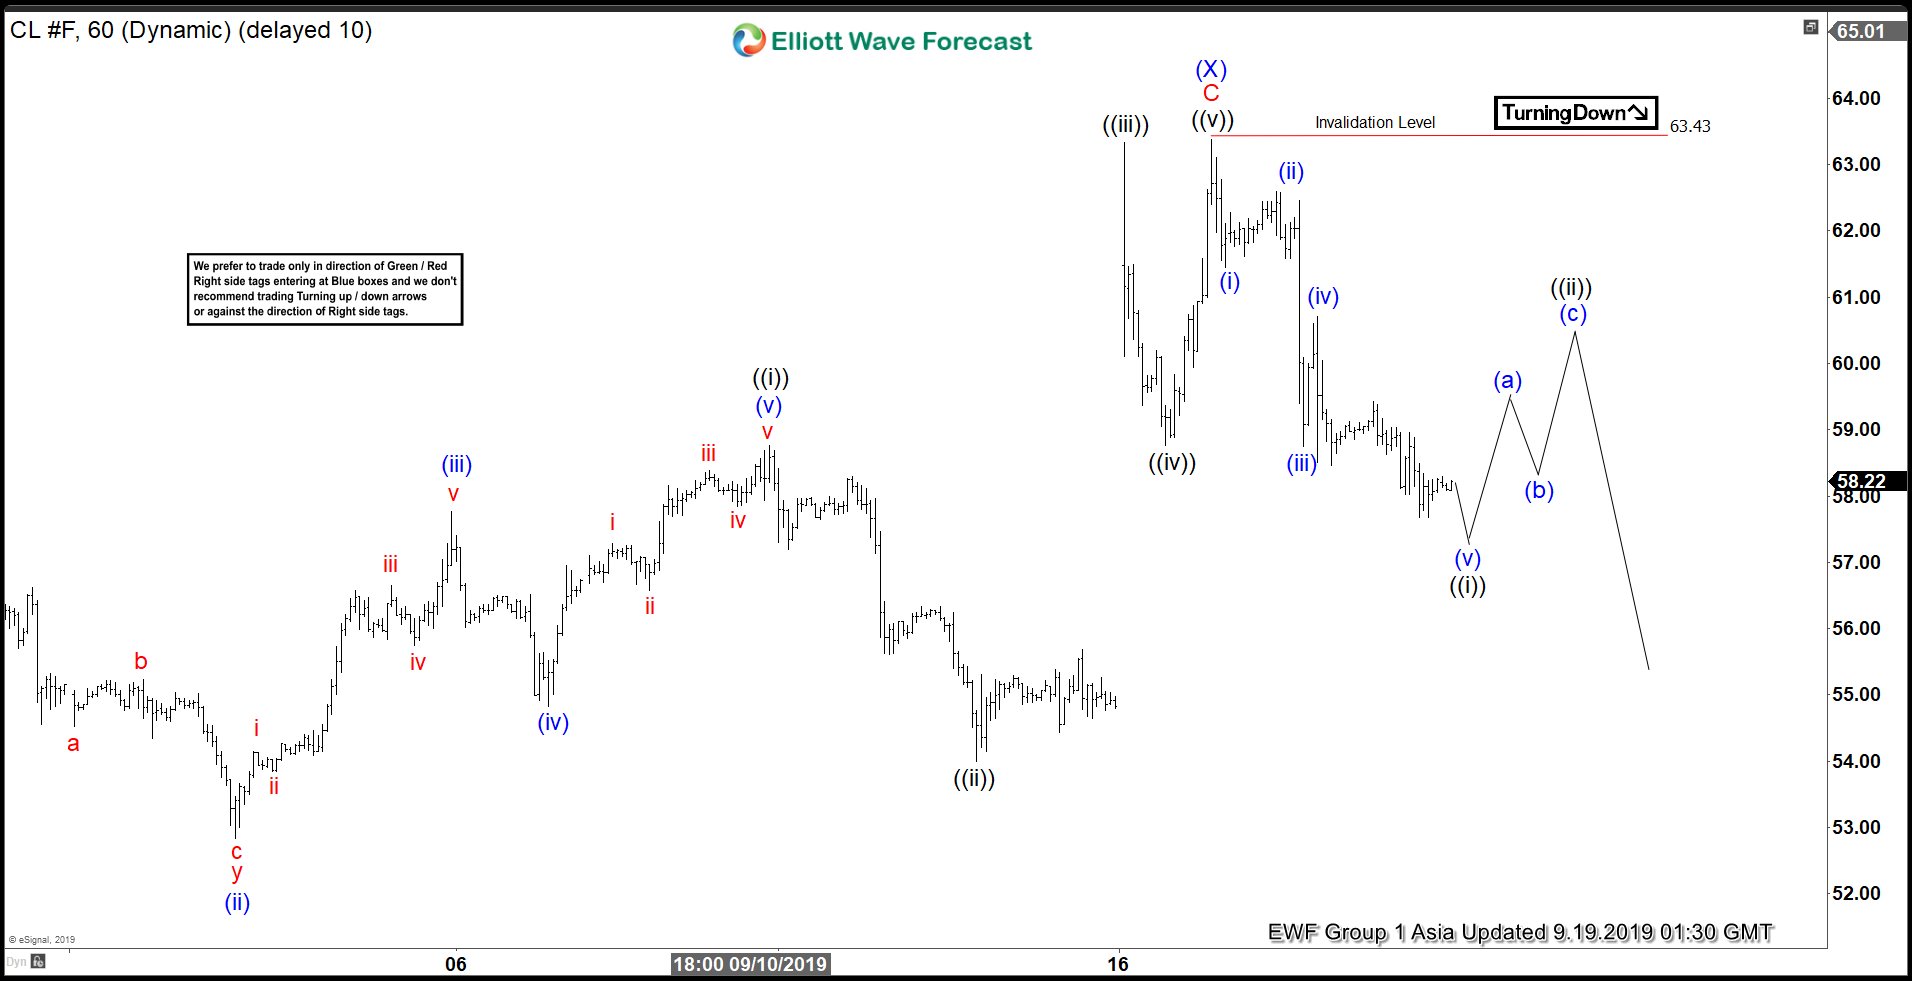
Elliott Wave View: Oil (CL_F) Outlook After Saudi Arabia’s Oil Refinery Attack
Read MoreAfter the 18% gap on the news of Saudi Arabia’s oil refinery attack, Oil has retraced. This video looks at the Elliott Wave path.