
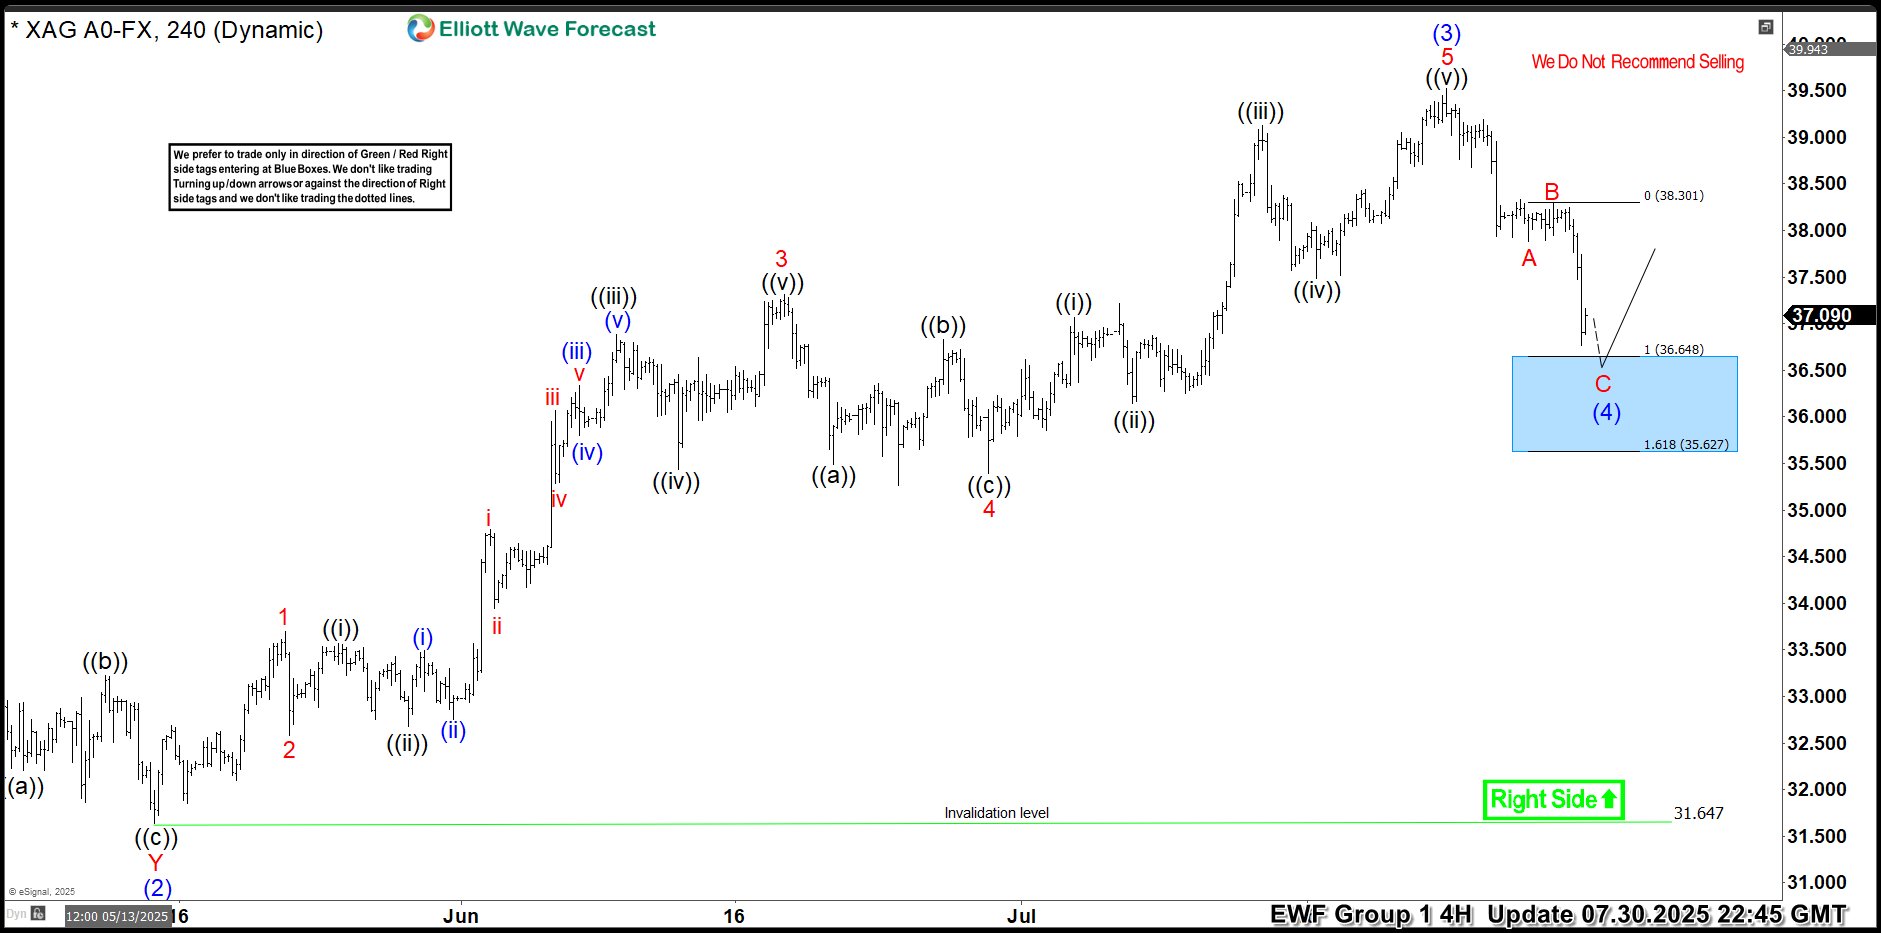
Hello traders. As our members know, we have had many profitable trading setups recently. In this technical article, we are going to talk about another Elliott Wave trading setup we got in Silver (XAGUSD). The commodity has completed its correction exactly at the Equal Legs zone, also known as the Blue Box Area. In this […]
-
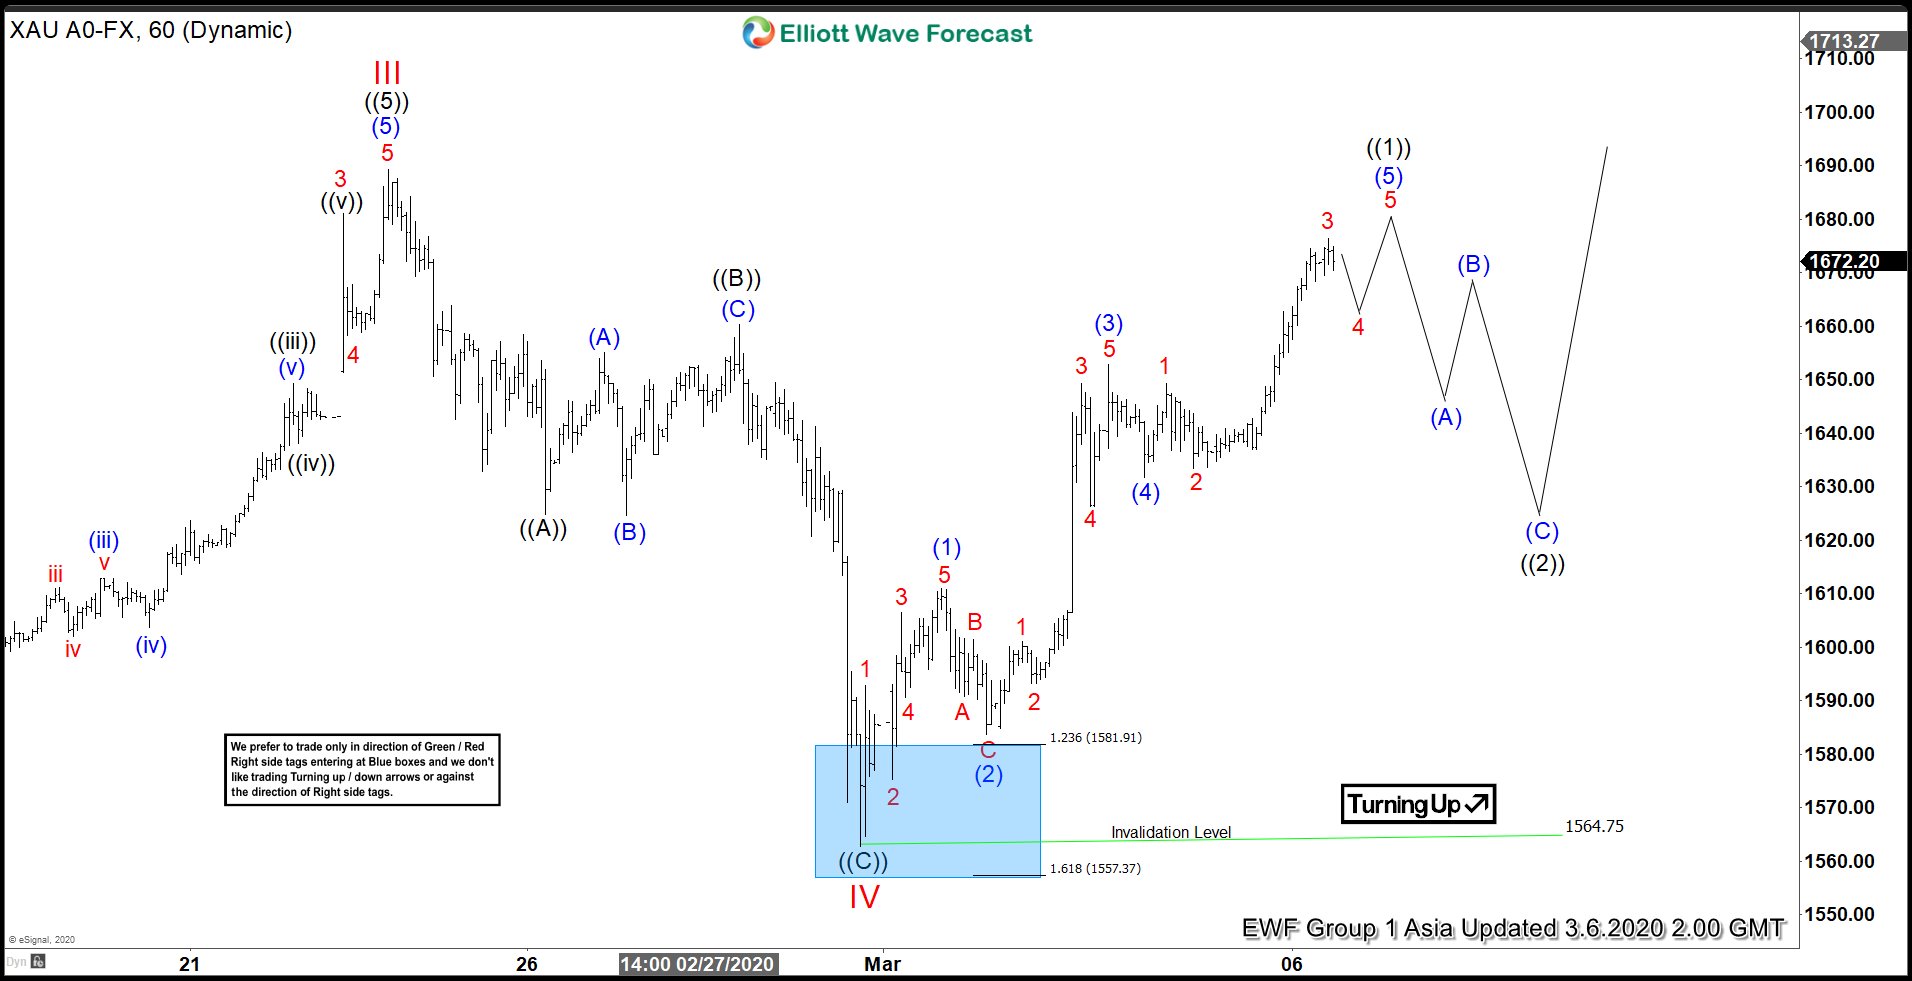
Elliott Wave View: Gold Bounced Strongly After Brief Selloff
Read MoreShort term Elliott Wave view in Gold (XAU) suggests the rally from August 2018 low in wave III has ended at 1689.30 high. Gold then corrected that cycle in wave IV as a zig-zag. Wave ((A)) of IV ended at 1624.80 low. The bounce in wave ((B)) unfolded as a flat correction and ended at […]
-
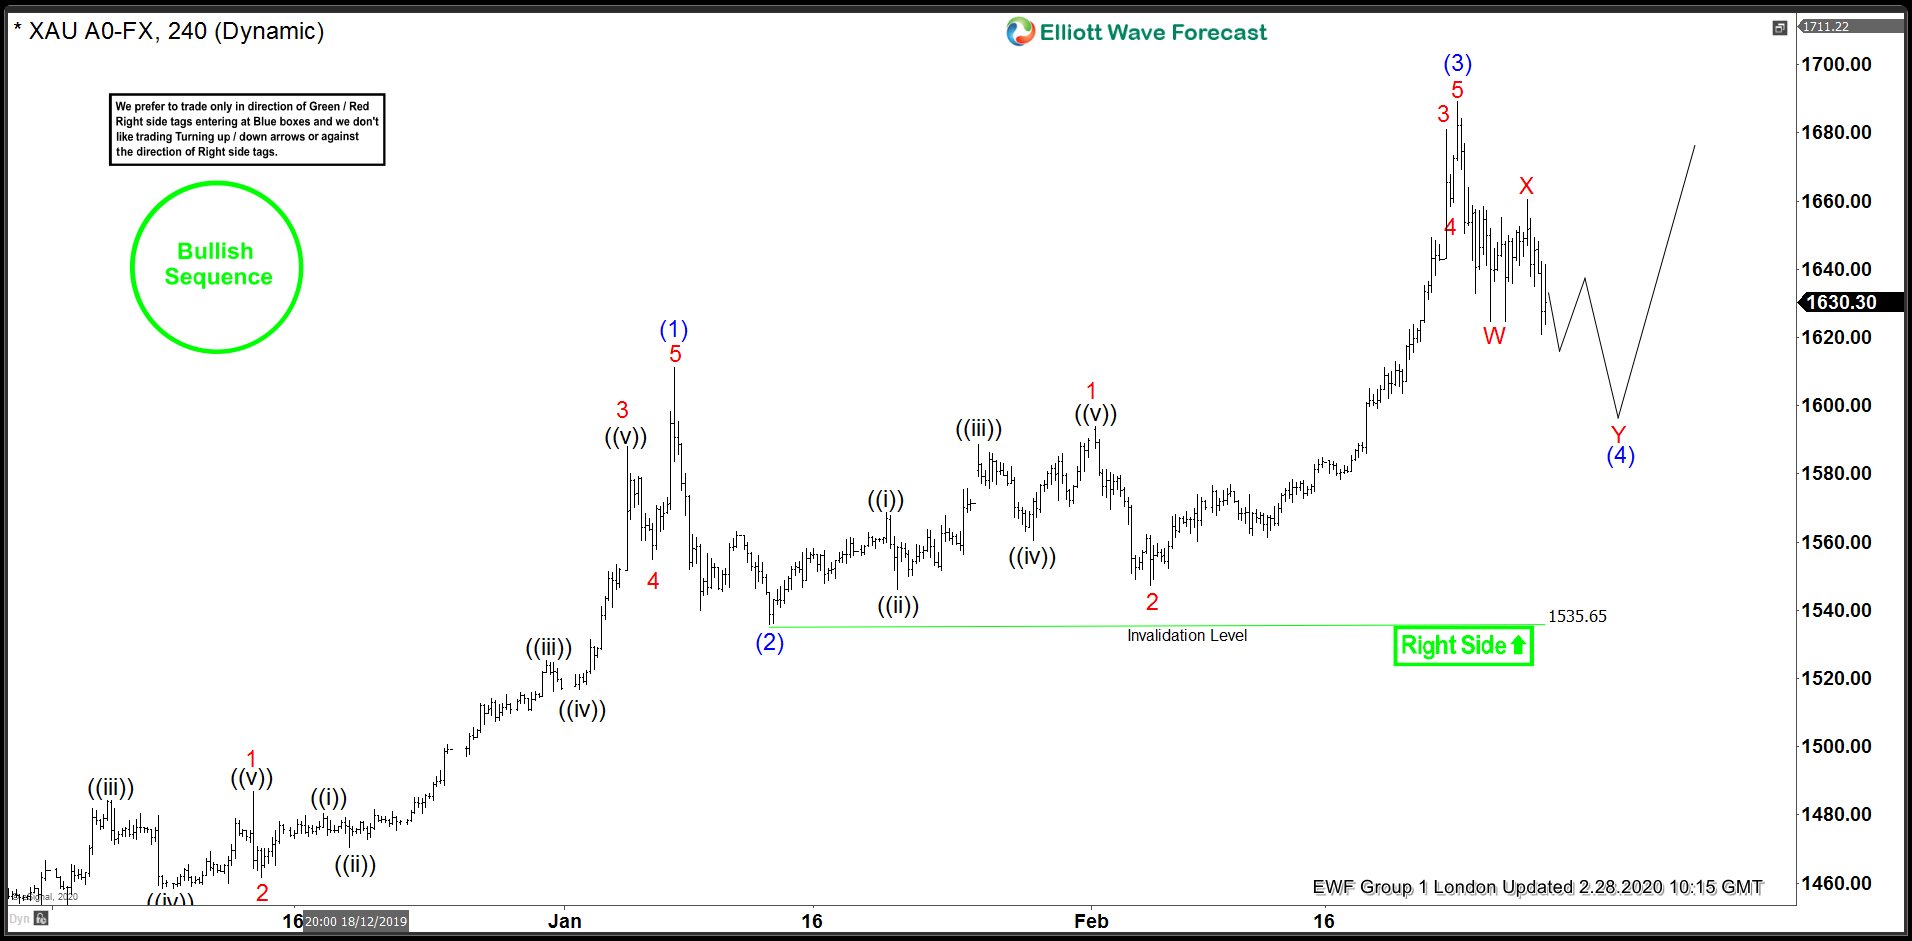
GOLD ( $XAUUSD ) Forecasting The Short Term Path
Read MoreHello fellow traders. In this technical blog we’re going to take a quick look at the Elliott Wave charts of GOLD ( $XAUUSD ), published in members area of the website. As our members know, GOLD was showing incomplete sequences in the short term cycle from the 02/24 peak. The price structure was suggesting another […]
-
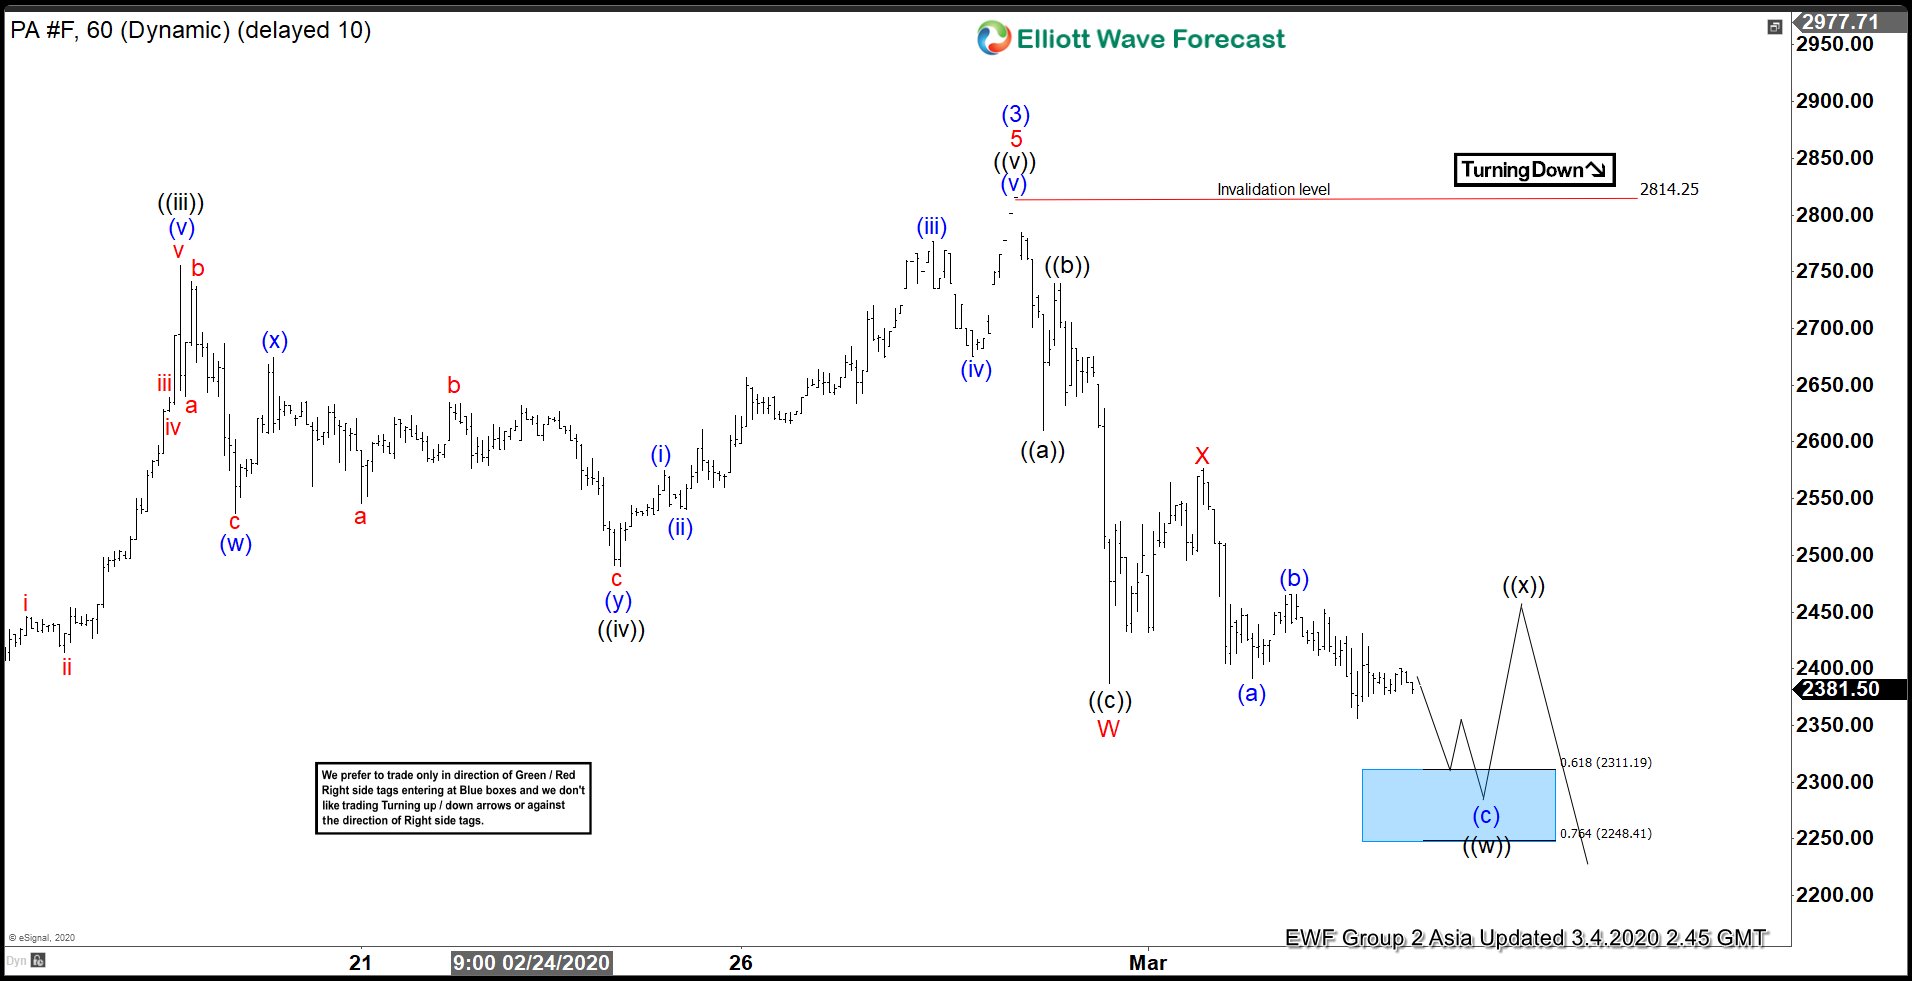
Elliott Wave View: Palladium 7 swing Correction In Progress
Read MorePalladium is in a 7 swing correction before the rally resumes. This article and video look at the Elliottwave path and target.
-
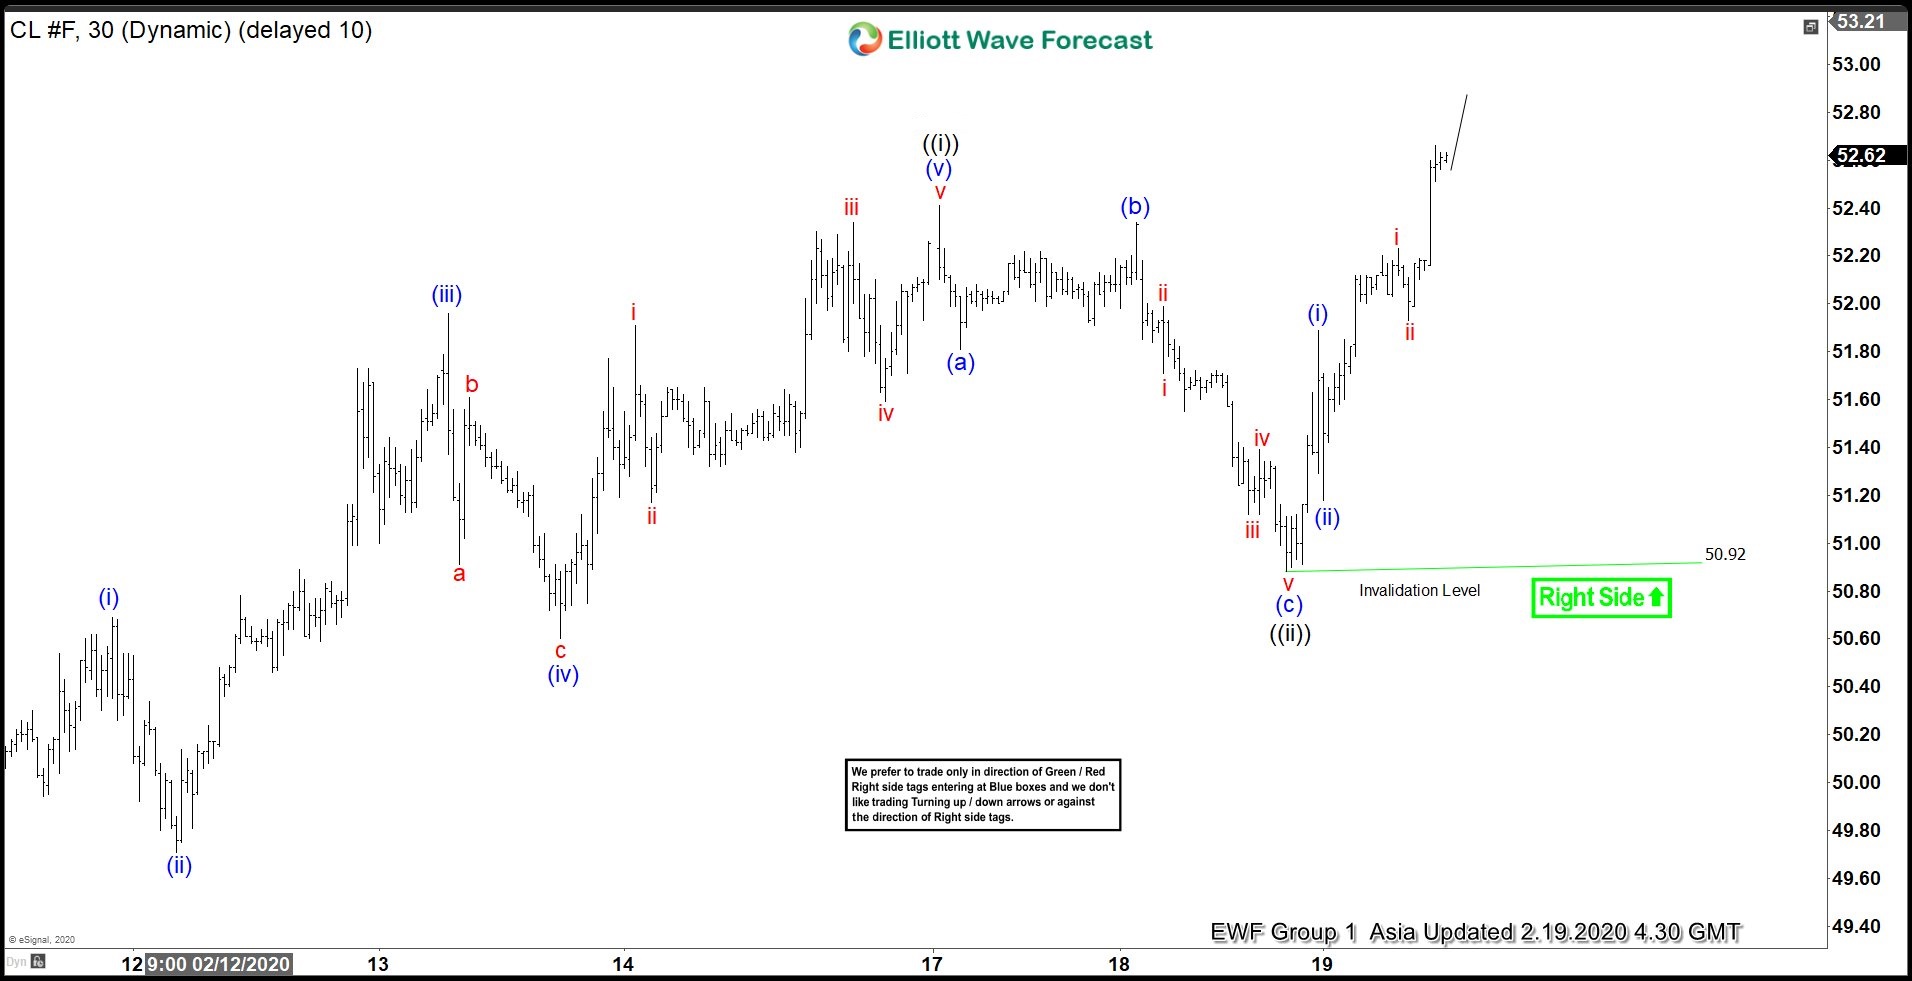
Elliott Wave View: Oil Shows 5 Waves Rally
Read MoreShort term Elliott wave view in Oil (CL_F) suggests the rally from February 5 low shows a 5 swing bullish sequence. We label the rally as an impulse Elliott Wave structure with a nest. Up from February 5 low, wave 1 ended at 52.2 and wave 2 pullback ended at 49.42. Wave 3 higher is […]
-
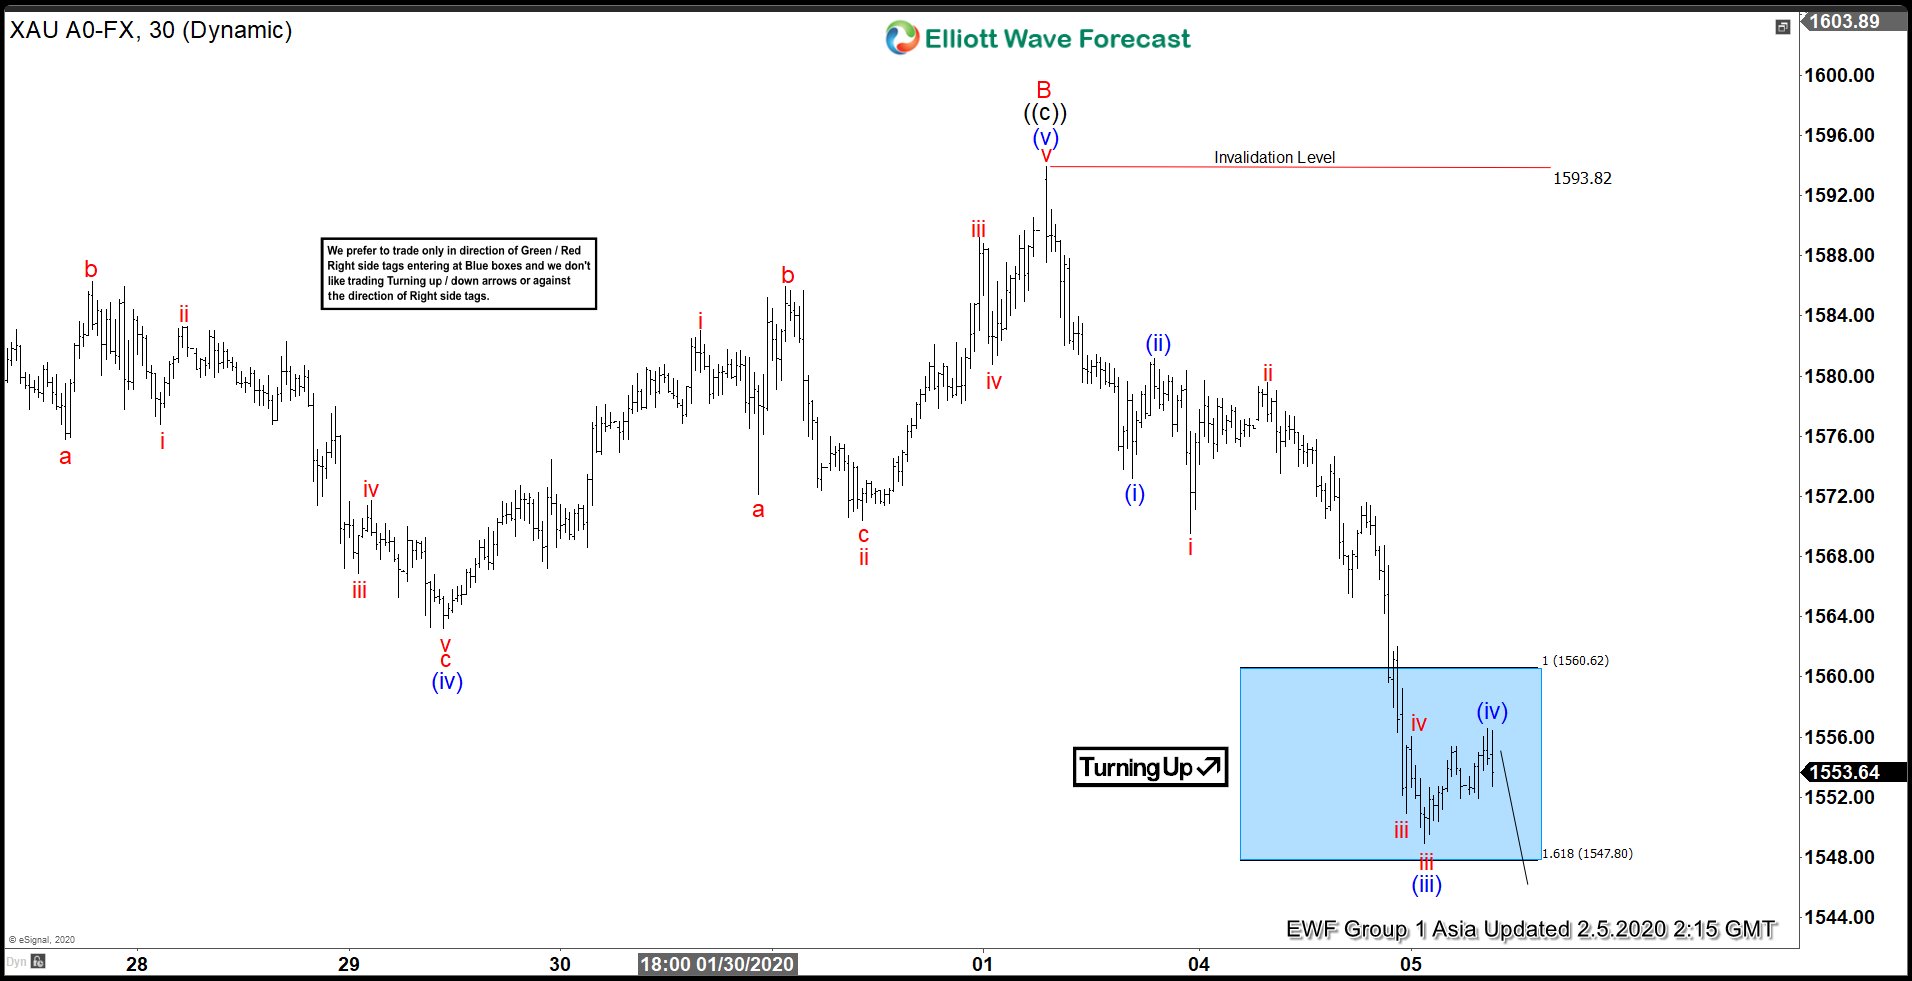
XAUUSD Impulsive Elliott Wave Decline In Progress
Read MoreXAUUSD (Gold) formed a secondary peak at 1593.82 on February 2, 2020 and turned lower sharply. Primary count suggests secondary peak completed wave B as a FLAT and wave C lower has started which should form part of a Zigzag Elliott wave structure down January 7, 2020 peak. A zigzag is a 5-3-5 structure in […]
-
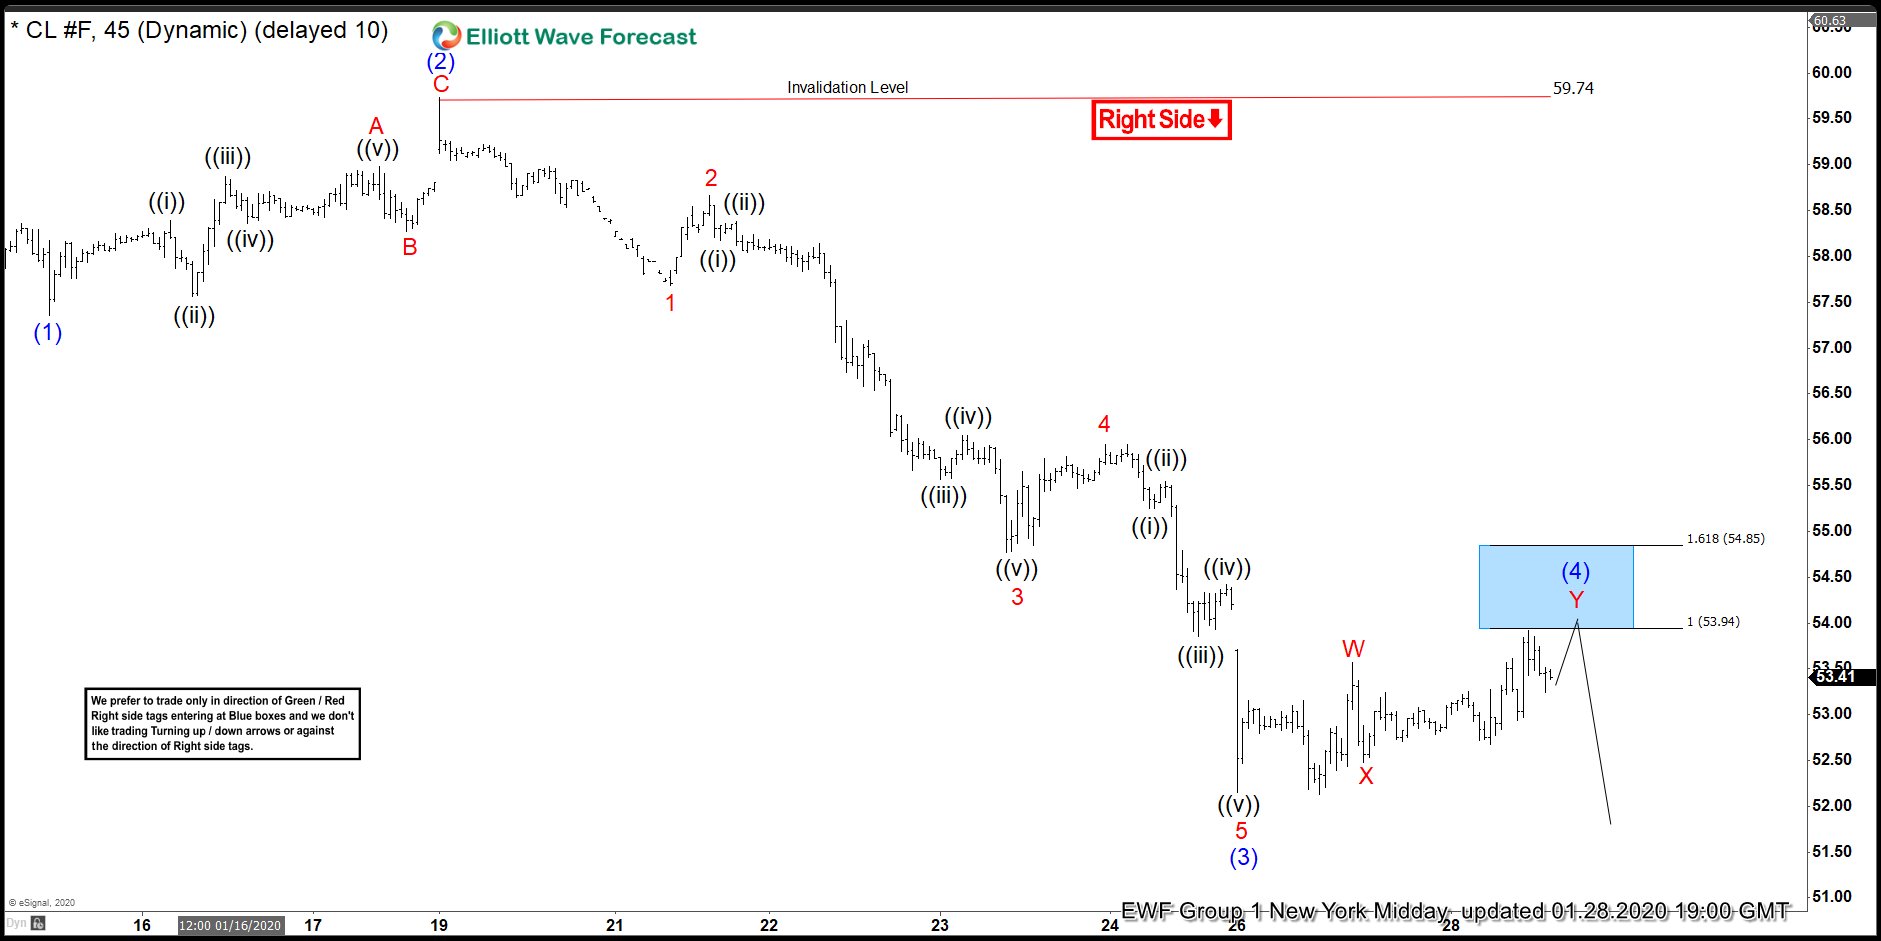
Oil (CL_F) Selling Wave Four Bounce At The Blue Box Area
Read MoreIn this blog, we are going to take a quick look at the Elliottwave chart of Oil (CL_F). Oil is proposed to be in wave ((C)) which we expect to unfold as a 5 waves move down. The chart from 1.28.2020 New York Midday update showed that Oil has ended wave (3) at 52.15 low. […]