
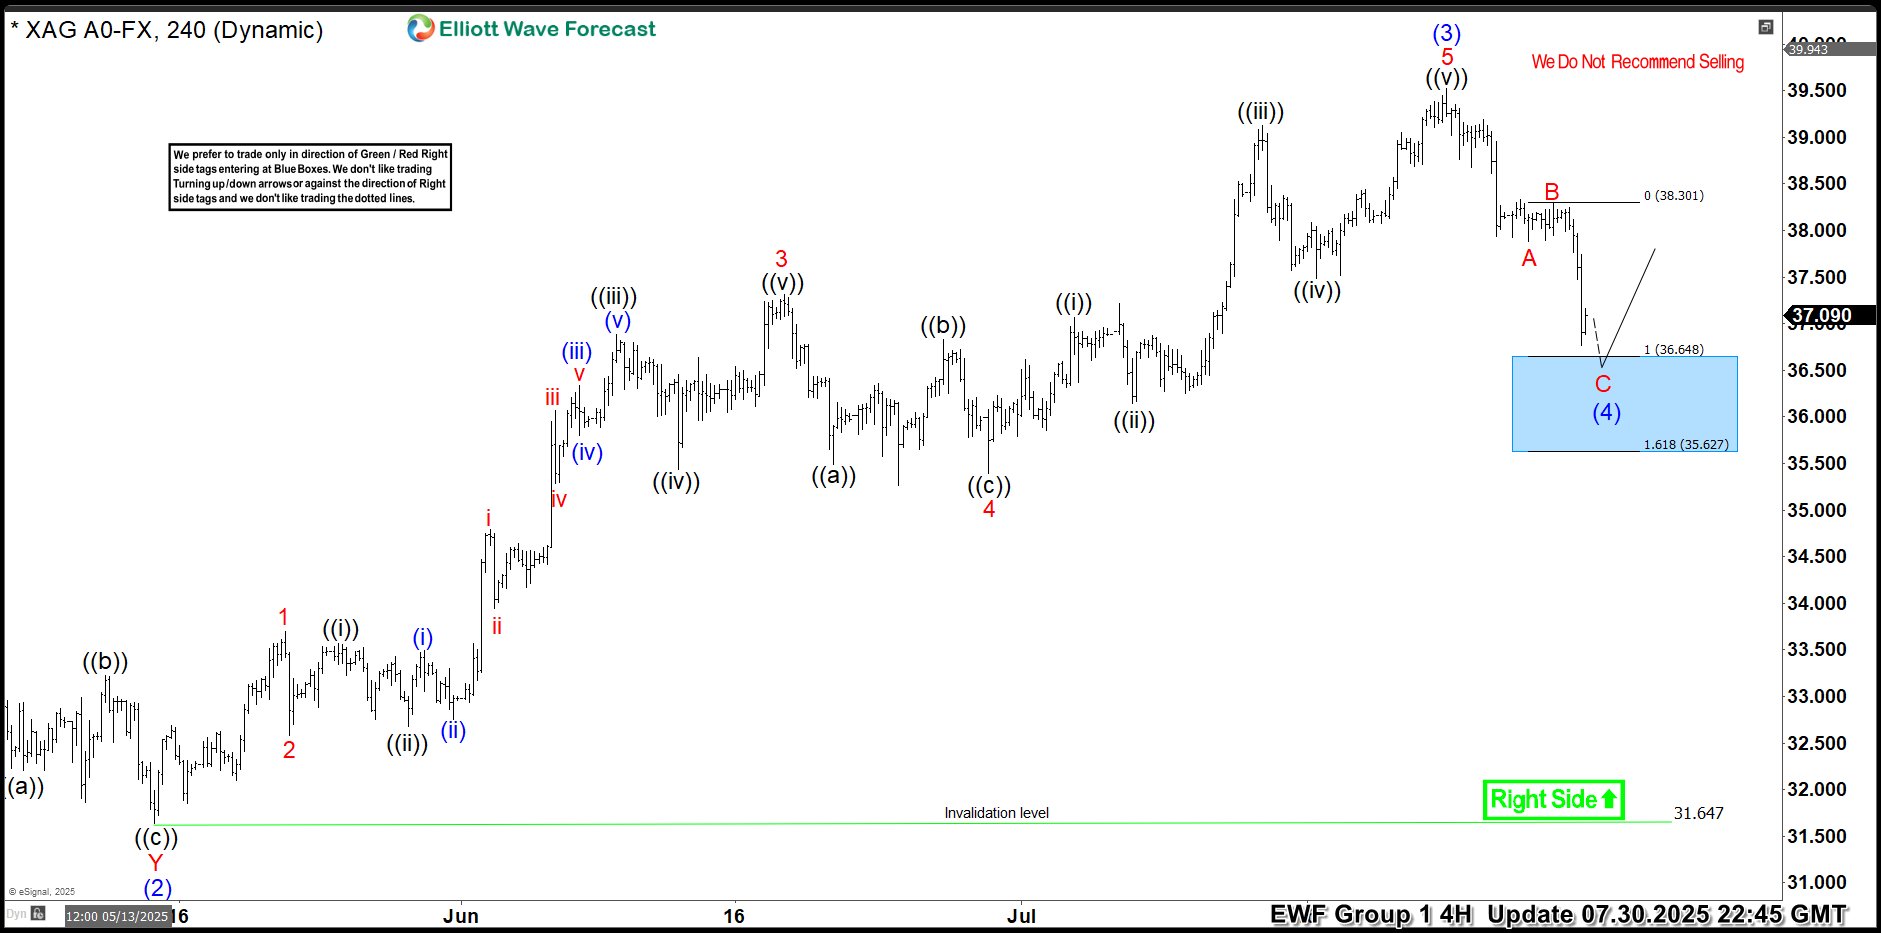
Hello traders. As our members know, we have had many profitable trading setups recently. In this technical article, we are going to talk about another Elliott Wave trading setup we got in Silver (XAGUSD). The commodity has completed its correction exactly at the Equal Legs zone, also known as the Blue Box Area. In this […]
-
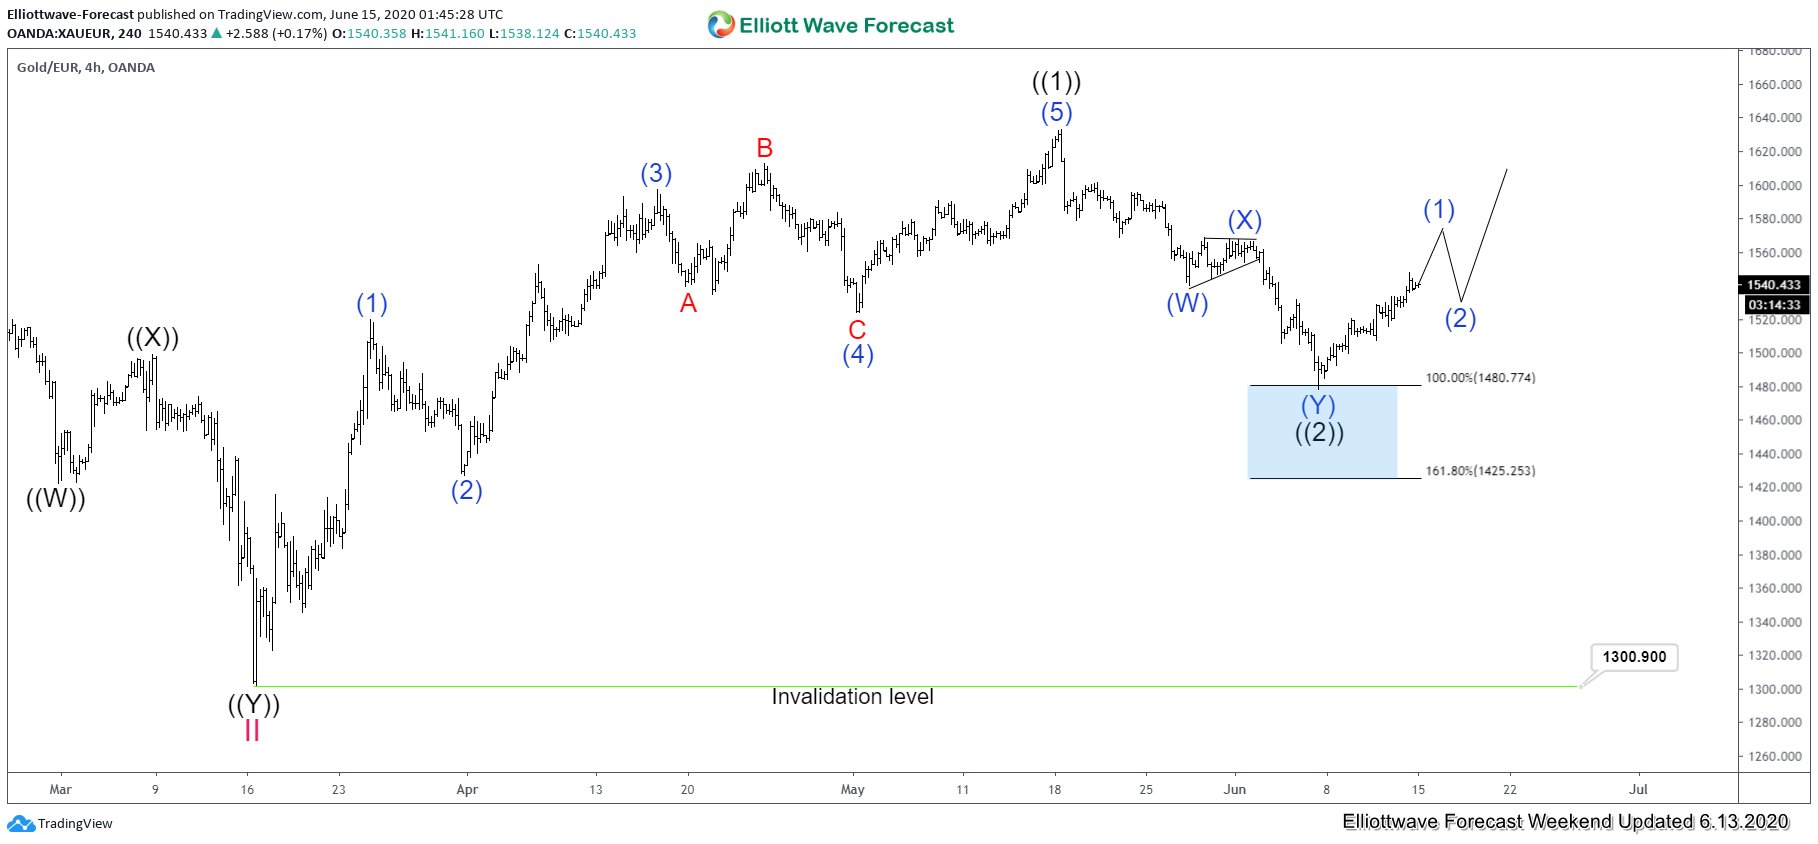
Gold Against Euro Dollar (XAUEUR) Ended Correction
Read MoreIn this article, we are going to provide an update of XAUEUR chart. In the previous article from April 23, 2020, we stated that Gold against Euro dollar (XAUEUR) should continue to move higher. XAUEUR has broken to all-time high after it broke above the previous high on Oct 2012 at 1386.5. This is very […]
-
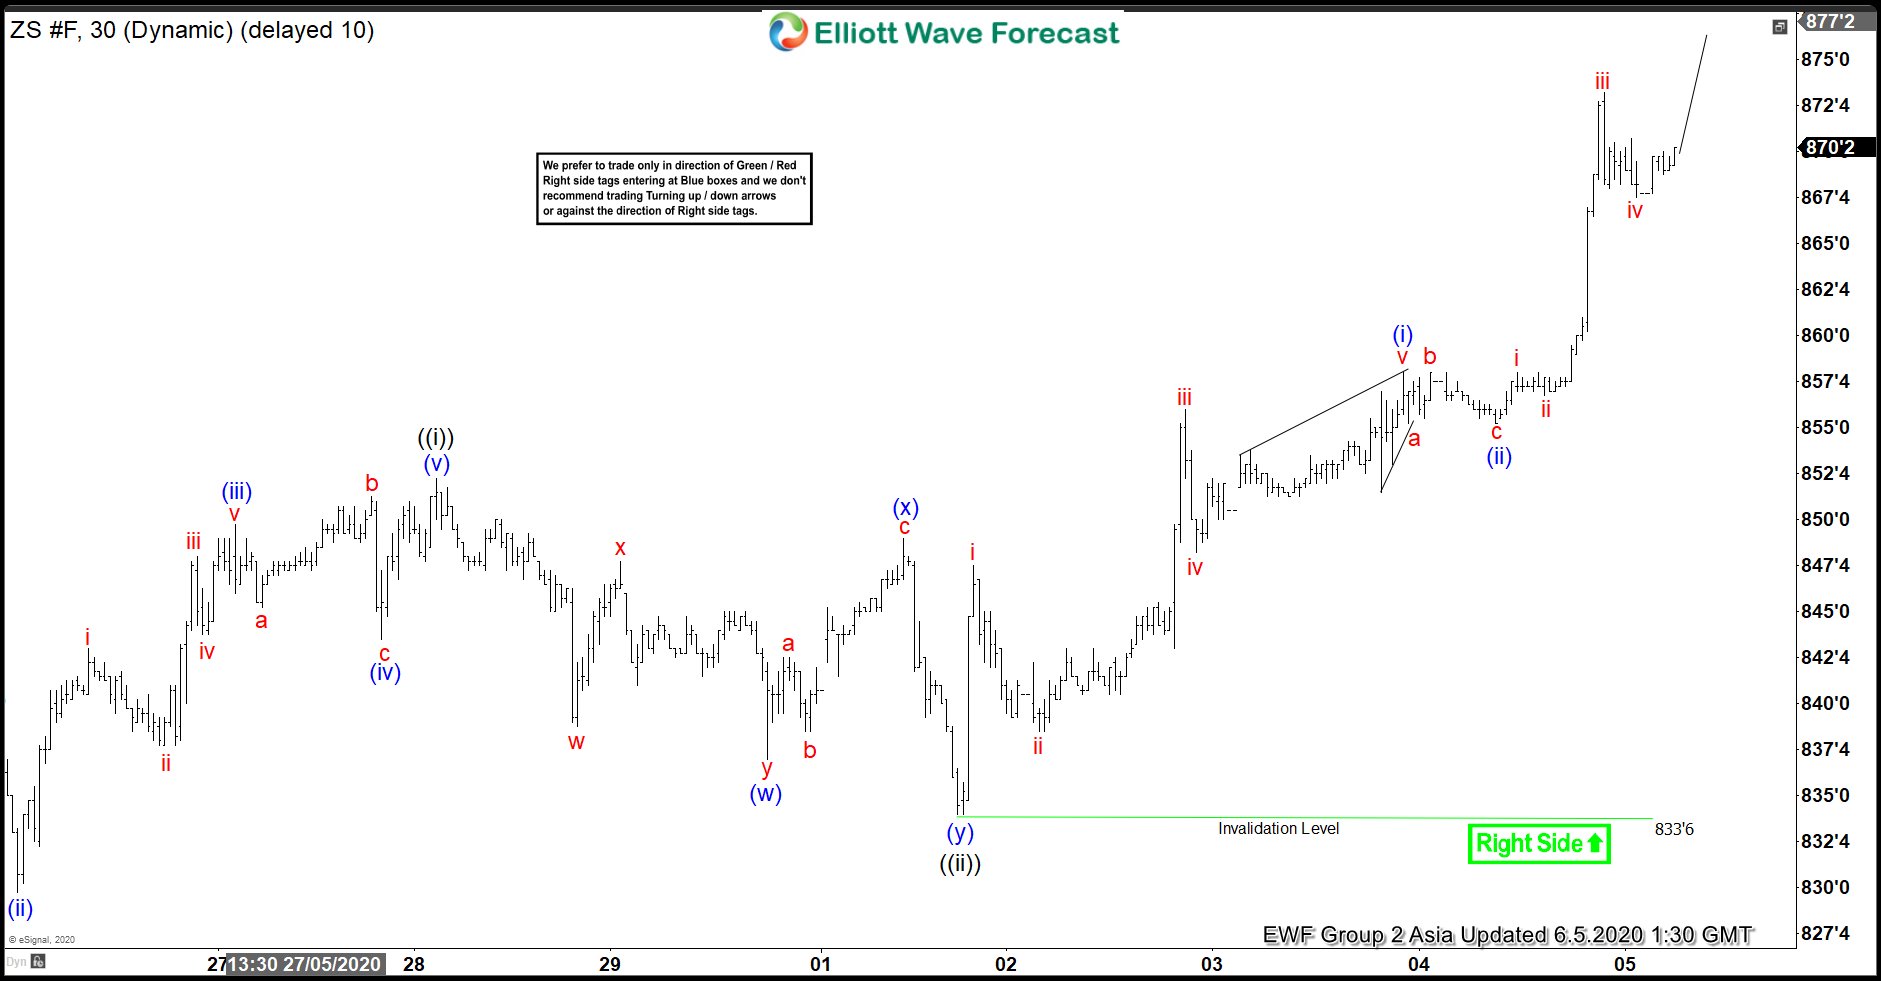
ZS_F (Soybean): Forecasting The Path Higher
Read MoreIn this blog, we are going to take a look at the Elliott Wave chart of ZS_F (Soybean Futures) and how we called it higher. The 1 hour London chart update from June 2 shows that Soybean has ended the cycle from May 22 low as wave ((i)) at 852.2 high. The sub-waves of the […]
-
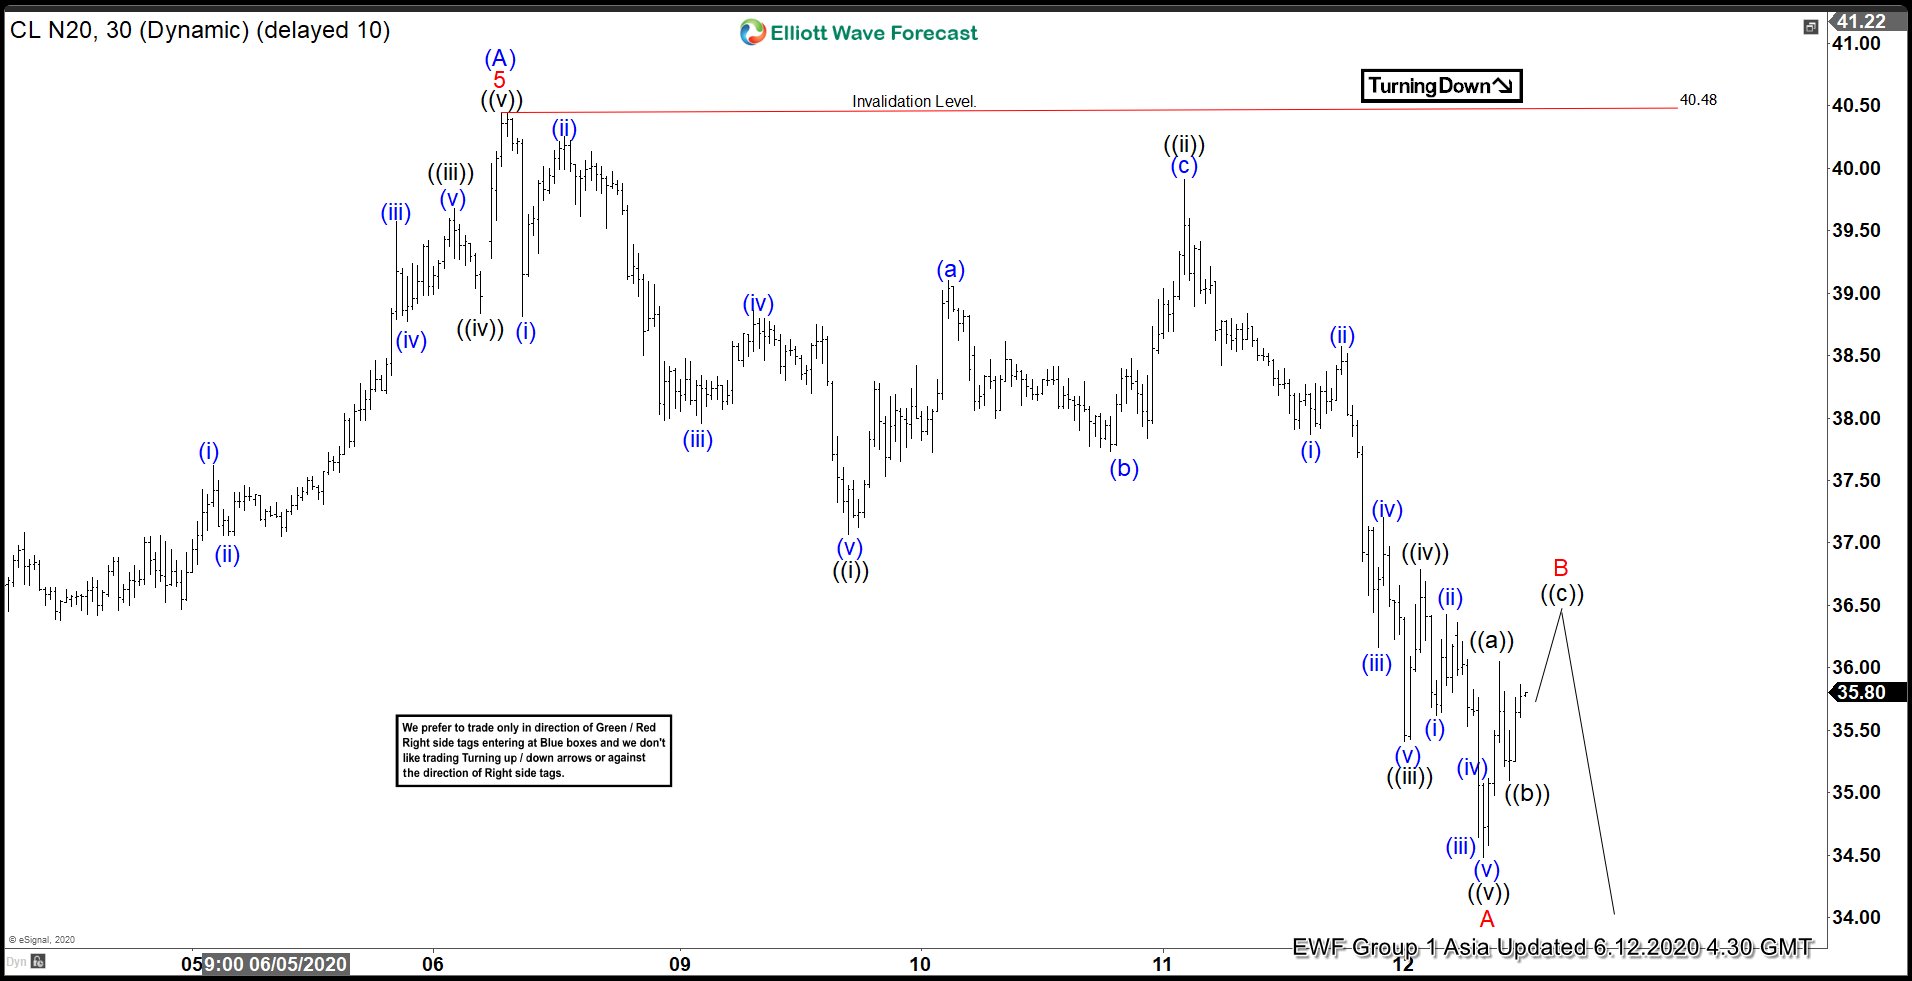
Elliott Wave View: Oil Ended Cycle from April Low
Read MoreOil ended cycle from April 29 low and now pulling back to correct that cycle in 3, 7, 11 swing. This article and video look at the Elliott Wave path.
-
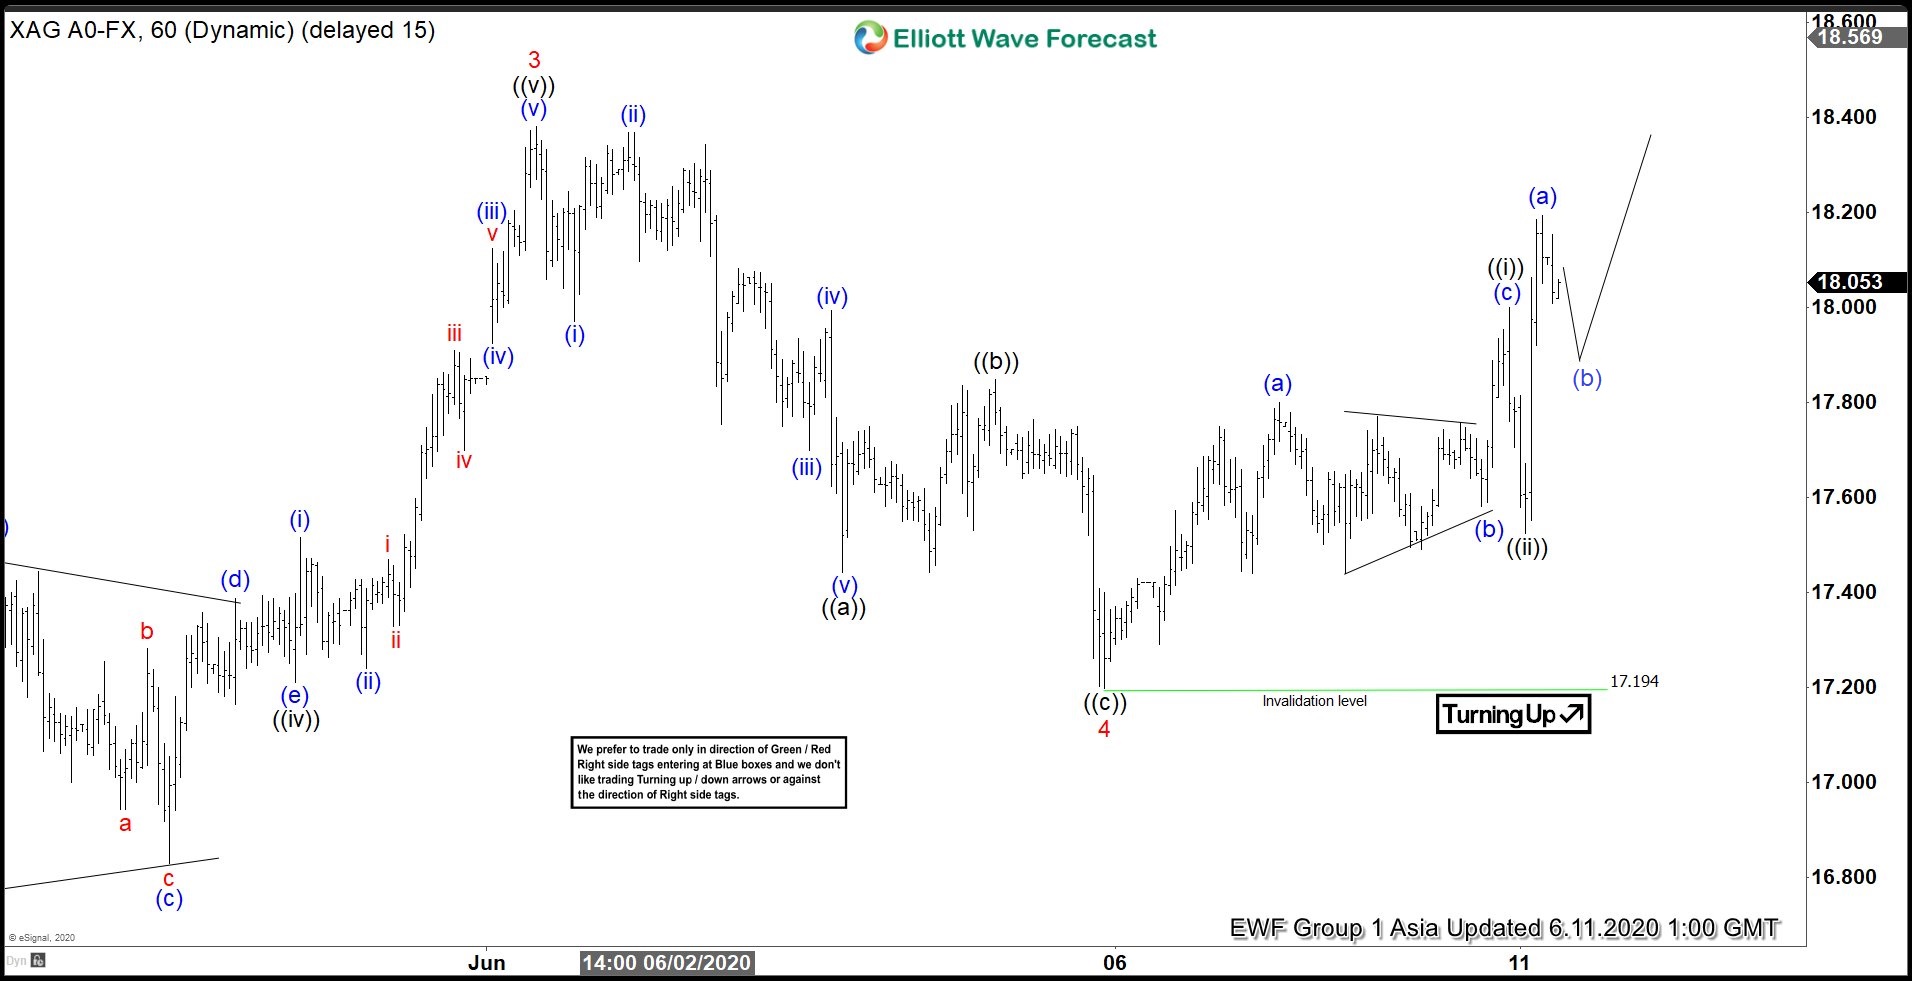
Elliott Wave View: Silver Has Resumed Higher
Read MoreSilver shows incomplete sequence from 3.19.2020 low and the metal can see further upside. This article and video look at the Elliott Wave path.
-
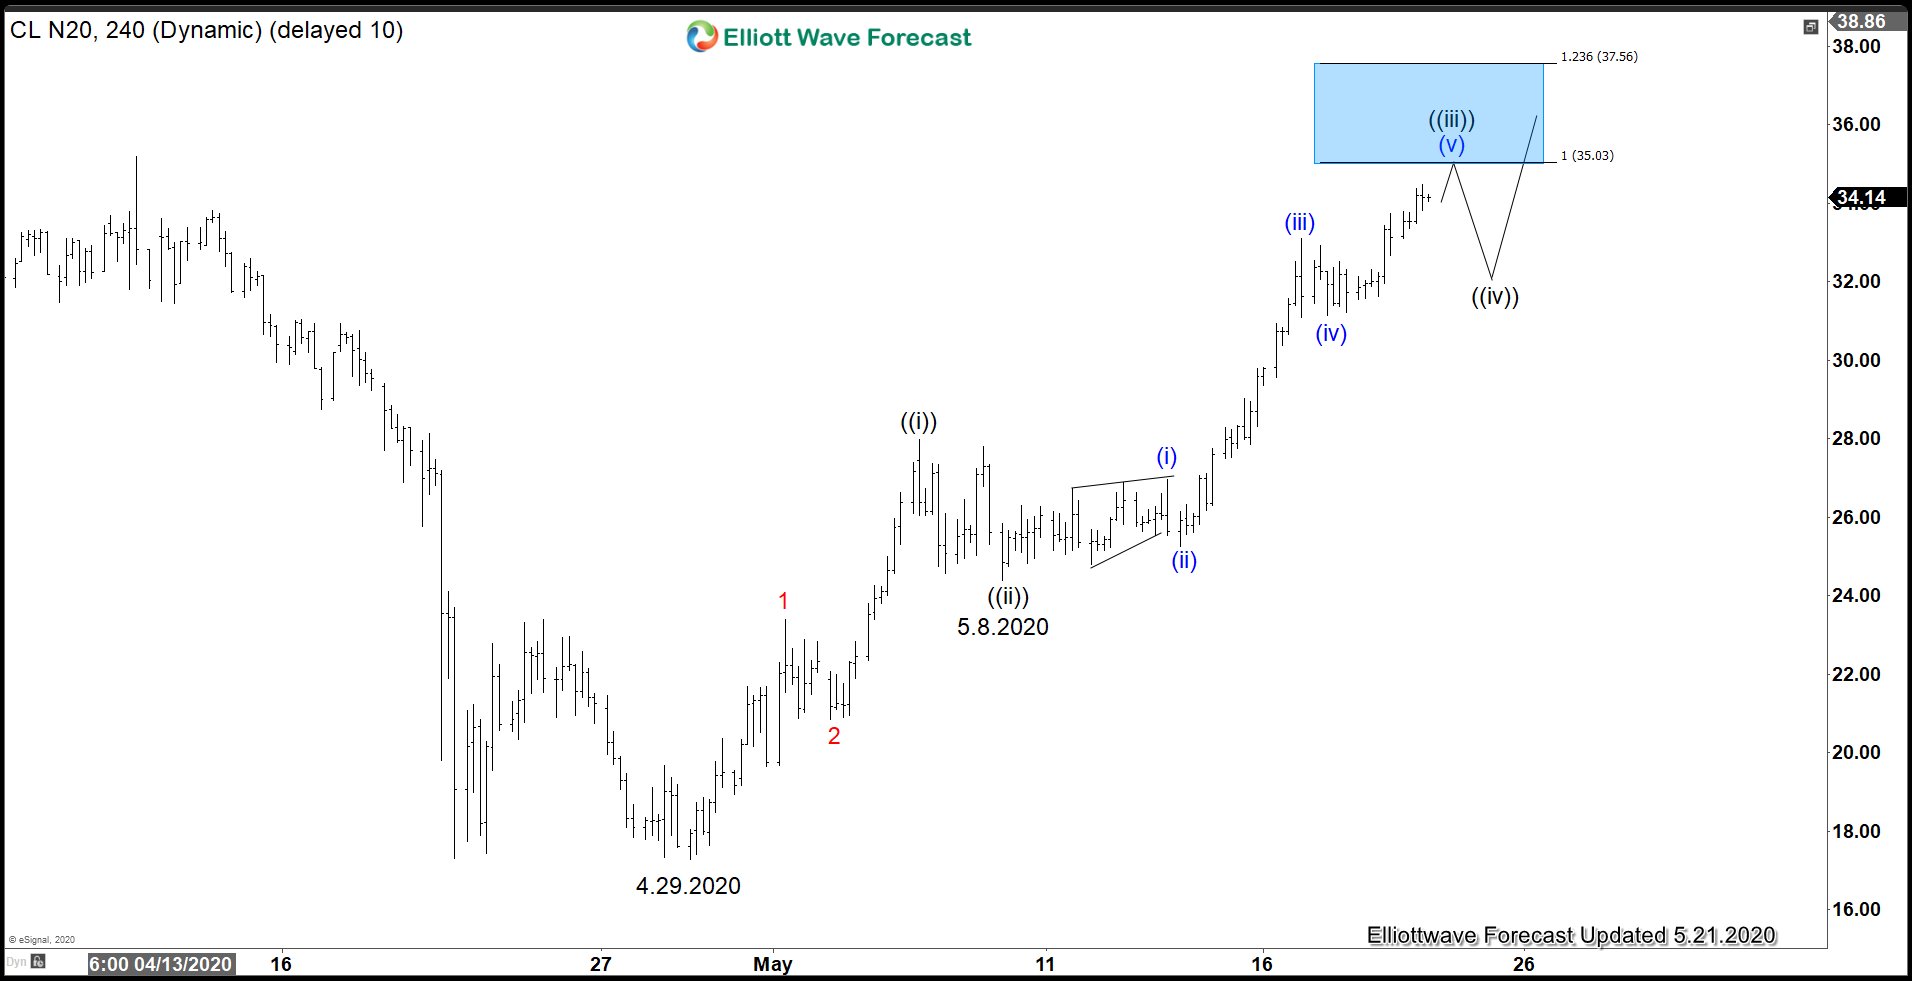
Crude Oil Staging Furious Comeback
Read MoreCrude Oil prices are staging impressive comeback after last month’s collapse to -$30. Sentiment in Oil has vastly improved in the past few weeks. Hopes of the supply cut as well as demand rebound help to support oil. China’s oil demand has come back to the pre-Covid 19 level at 13 million barrels/day. Crude storage […]
-
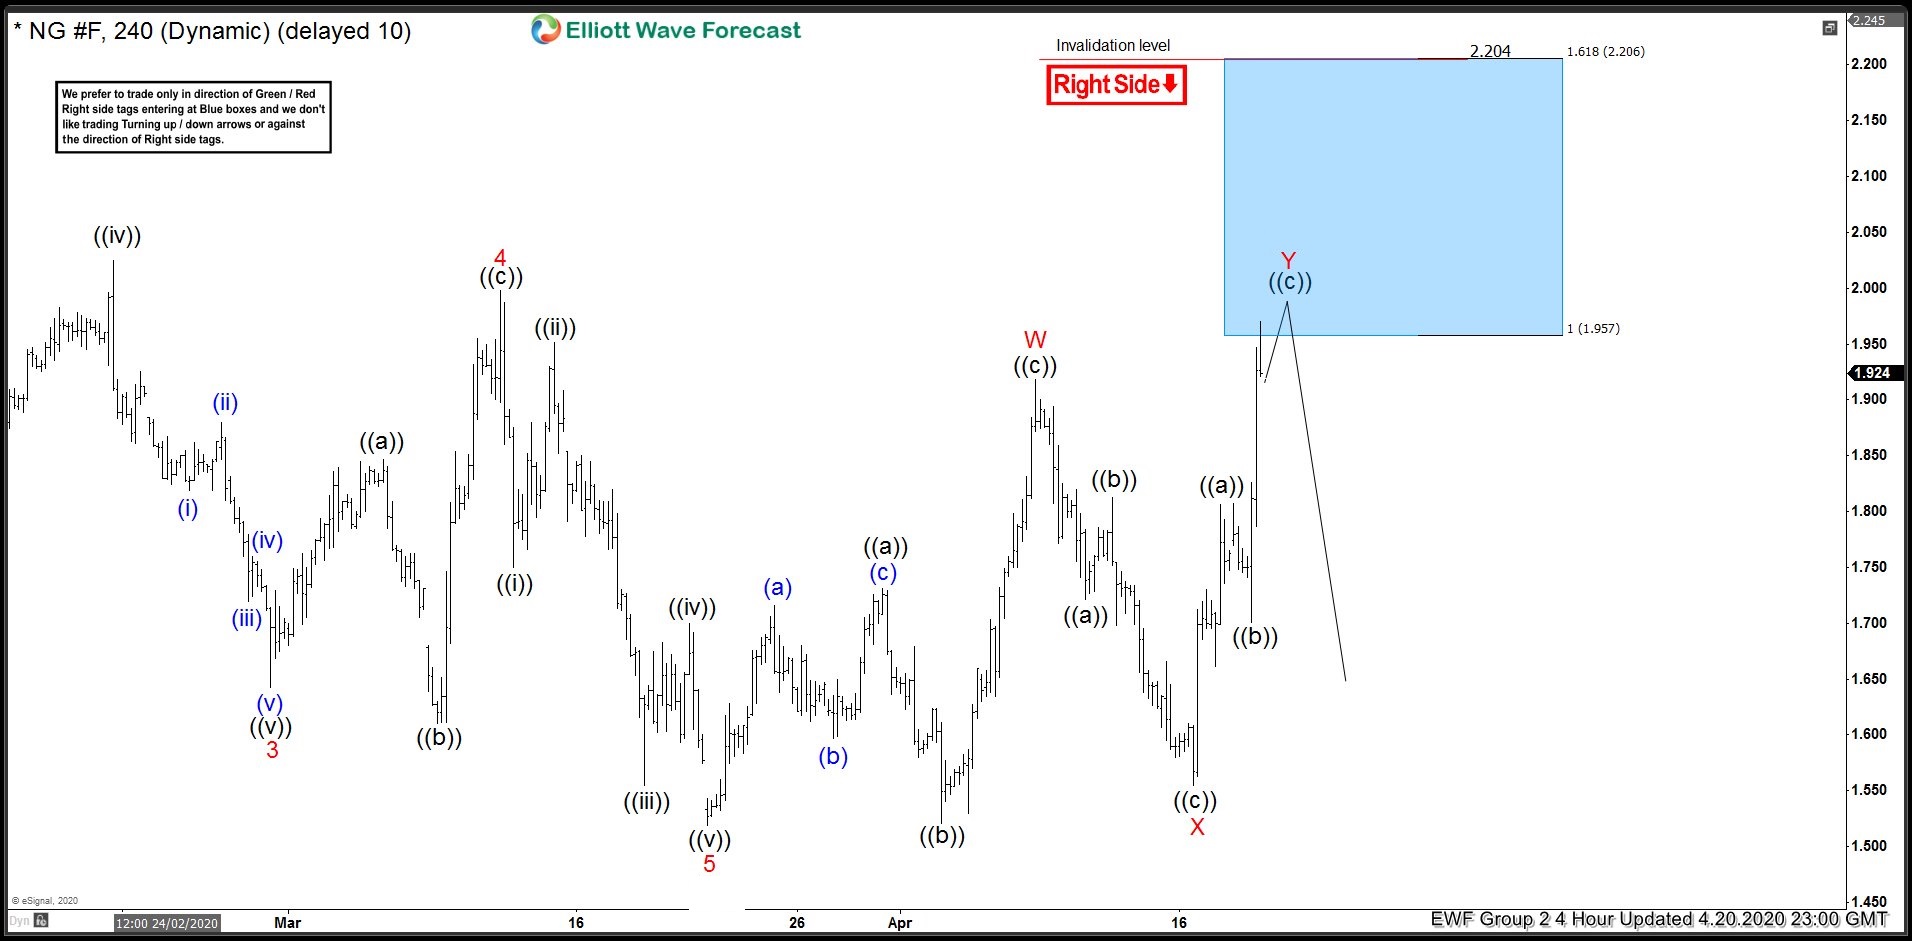
Natural Gas (NG_F) Reacted Lower From Blue Boxes
Read MoreIn this blog, we are going to take a look at the Elliott Wave chart of Natural Gas (NG_F). The 4 hour chart update from 20 April shows that cycle from May 11, 2019 high ended at 1.519 low. The commodity then bounced higher as a double three. Up from 1.519 low, Natural Gas ended […]