
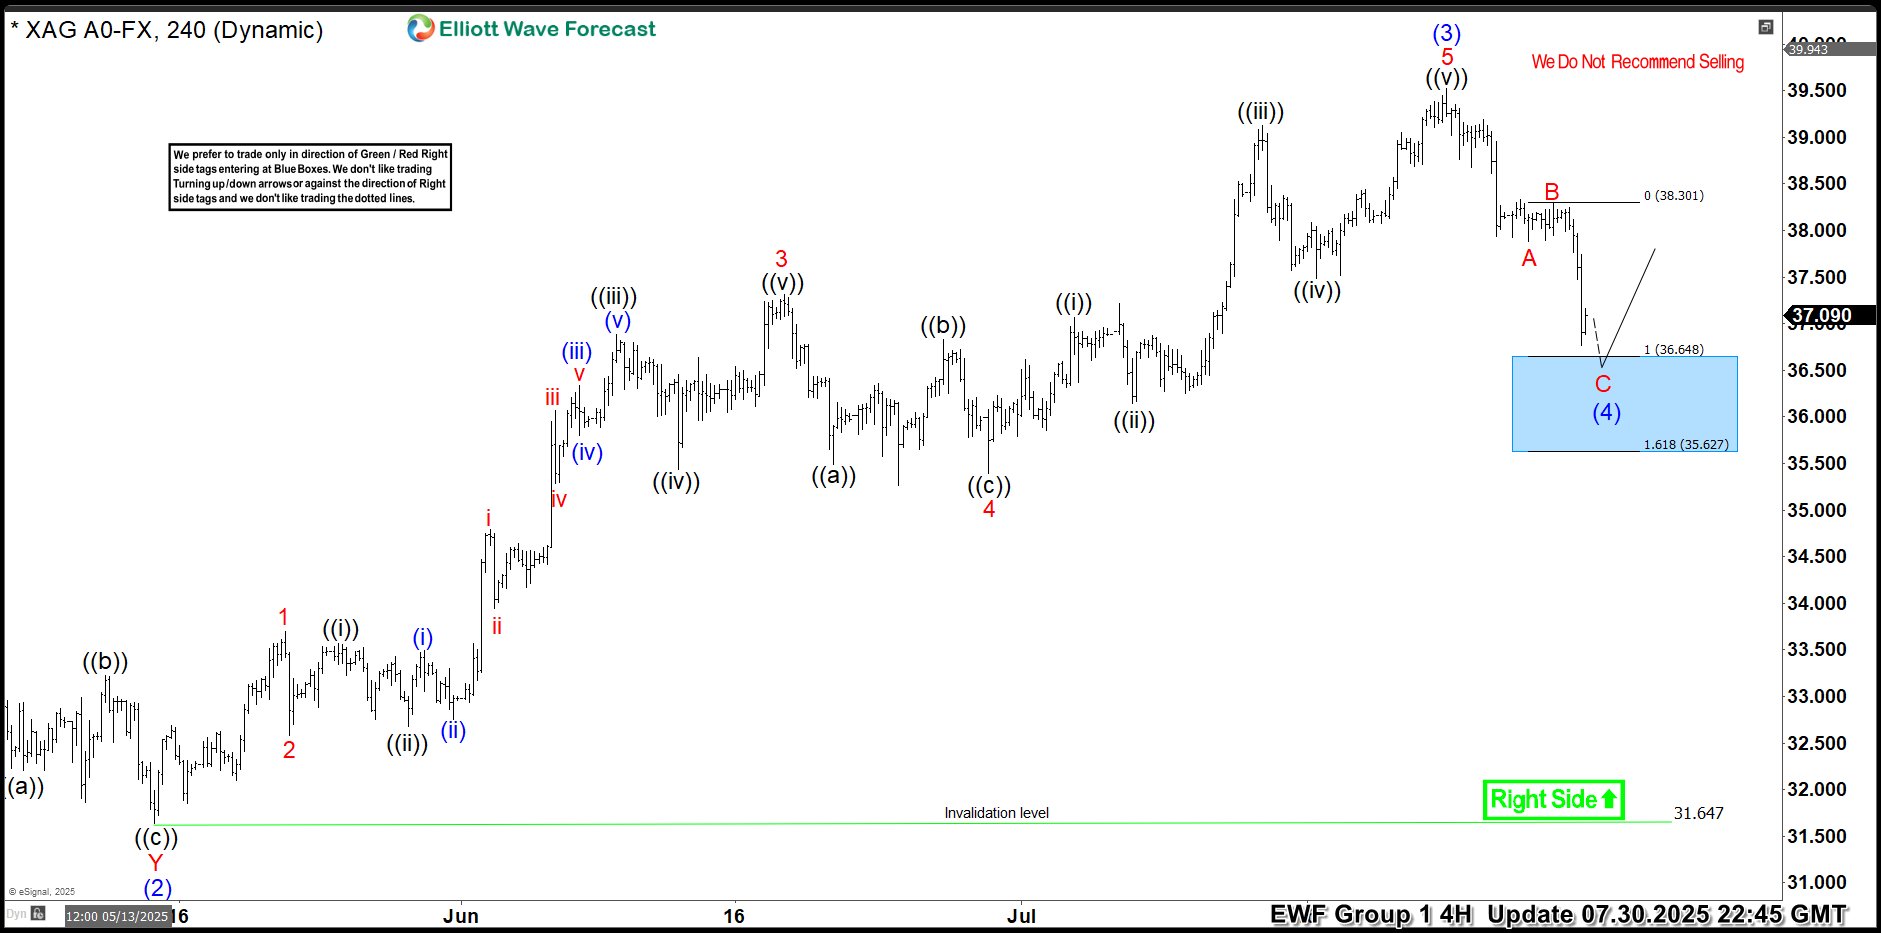
Hello traders. As our members know, we have had many profitable trading setups recently. In this technical article, we are going to talk about another Elliott Wave trading setup we got in Silver (XAGUSD). The commodity has completed its correction exactly at the Equal Legs zone, also known as the Blue Box Area. In this […]
-
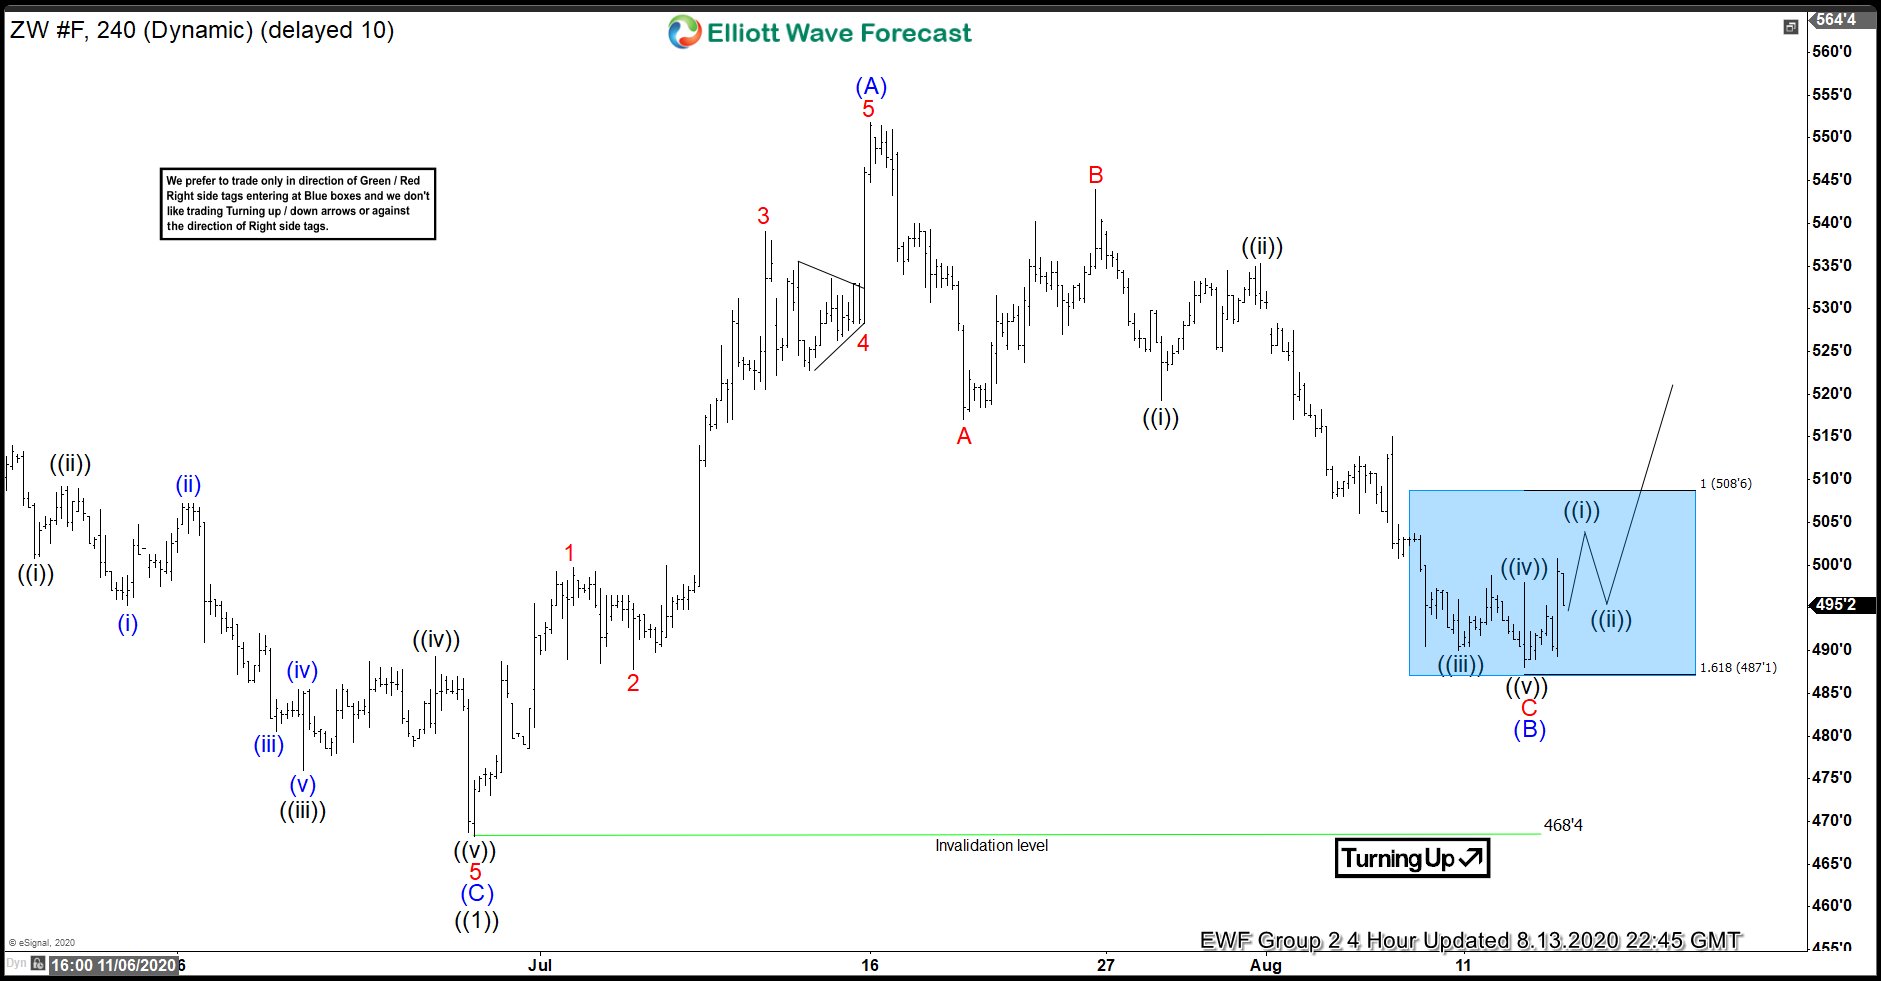
Wheat (ZW_F) Bounced Higher From Blue Box
Read MoreIn this blog, we are going to take a look at the Elliott Wave chart of Wheat Futures (ZW_F). The 4 hour chart update from August 13 shows that wheat has ended the cycle from June 27 low as wave (A) at 551.6 high. The sub-waves of the rally unfolded as 5 waves impulsive structure. […]
-
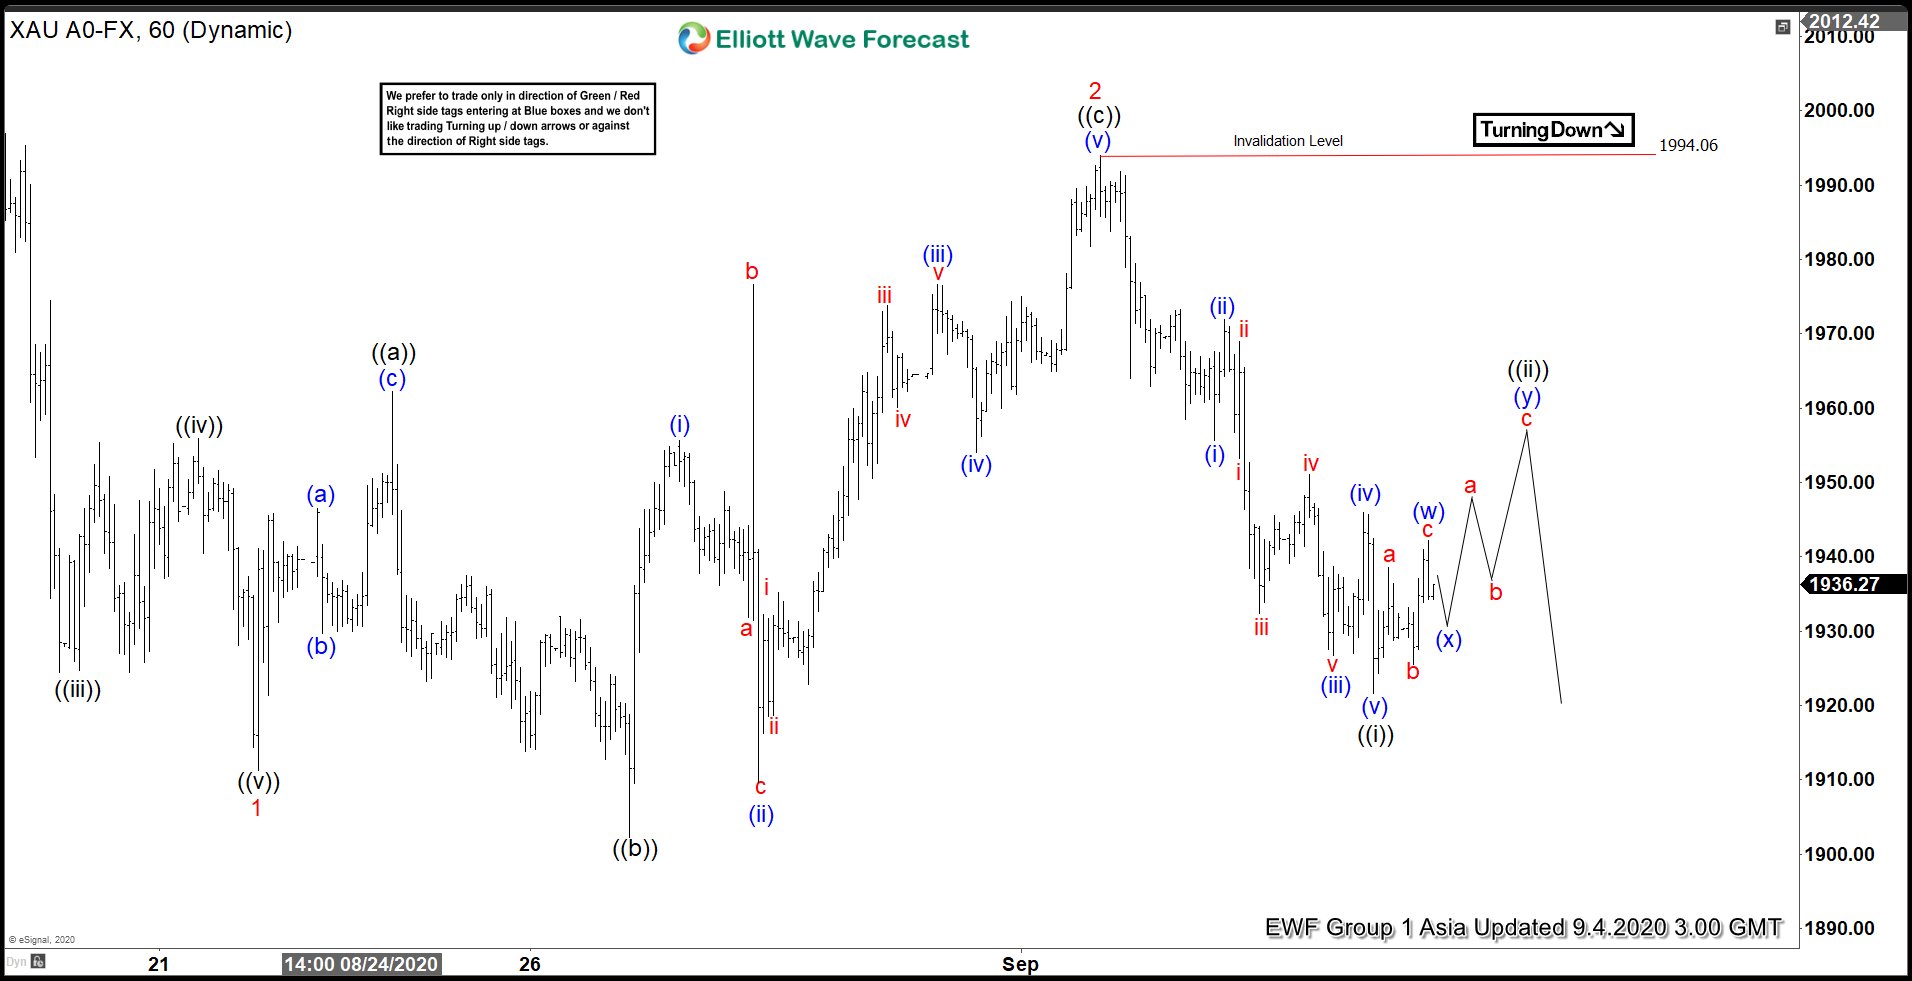
Elliott Wave View: Further Correction in Gold Still Possible
Read MoreGold extended lower from August 18 high. While below September 1 high, expect bounce in 3,7,11 swings to fail for more downside.
-
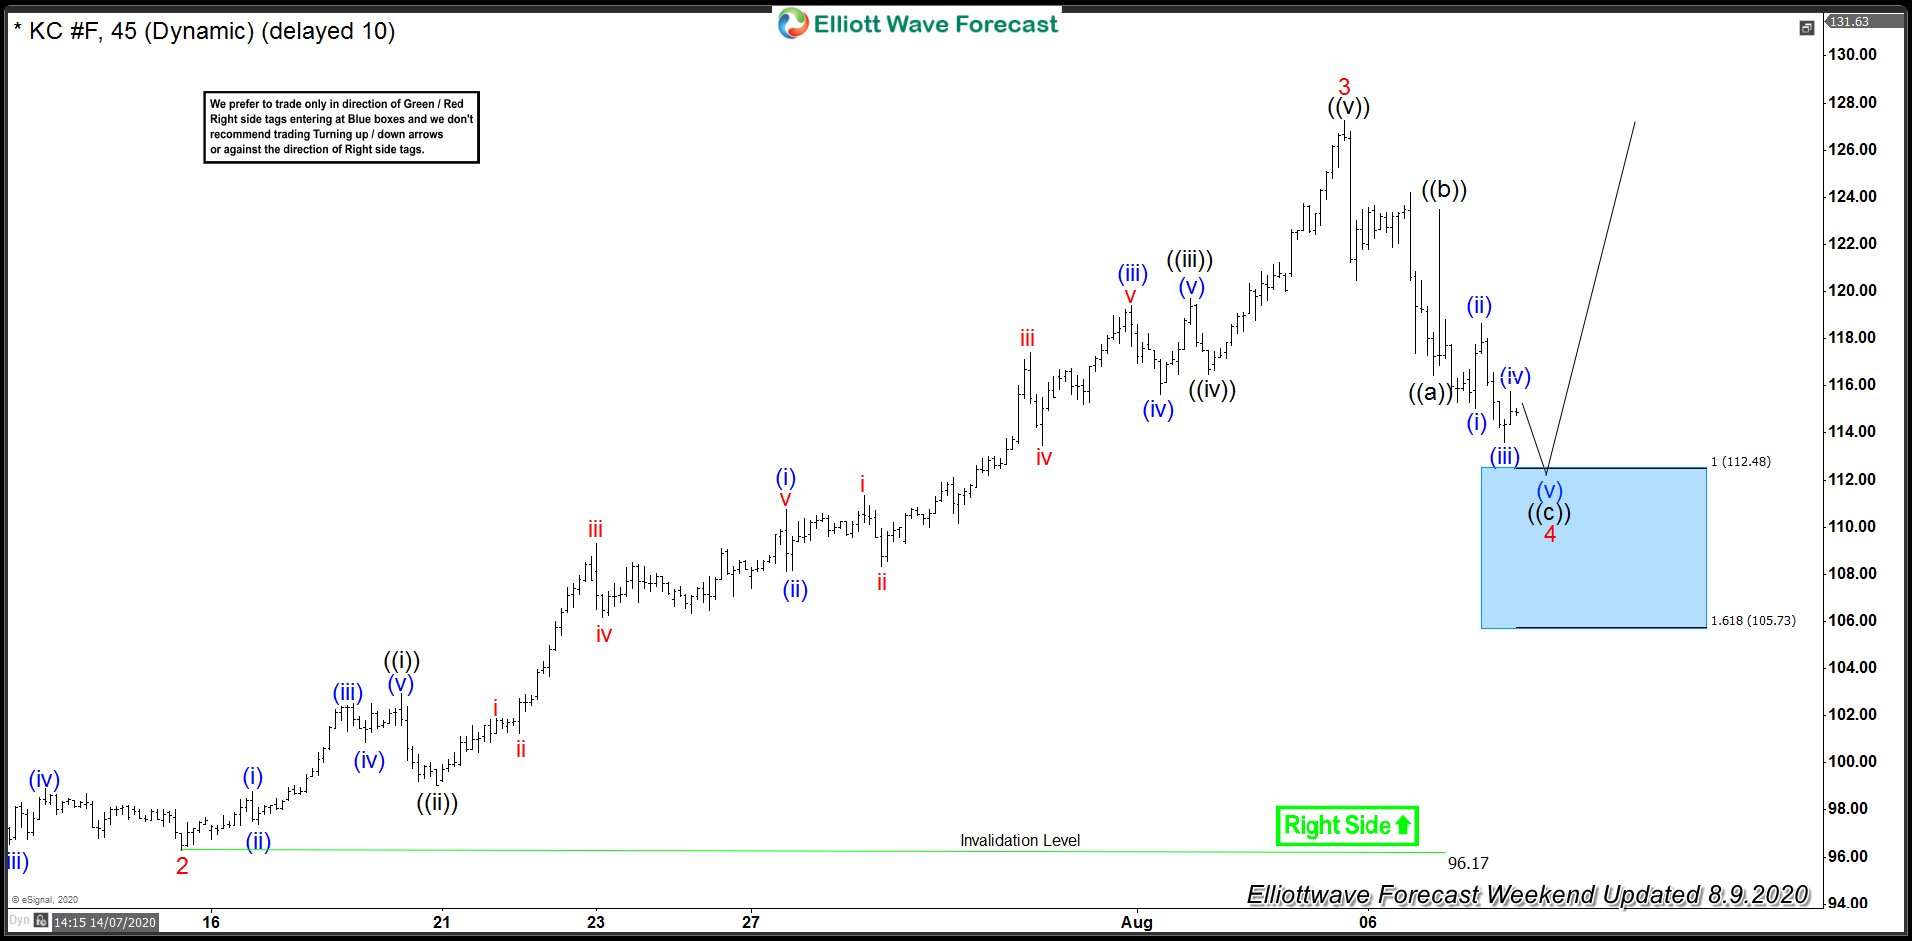
Coffee Elliott Wave View: Buying From Blue Box Area
Read MoreIn this blog, we take a look at the past performance of 1 hour Elliott Wave charts of Coffee In which our members took advantage of the blue box areas.
-

Elliott Wave View: Further Upside in Oil (CL)
Read MoreOil ended correction from 8/5 high. From there, it has extended higher and broke above previous 8/5 high. While above 8/20 low, expect more upside in Oil.
-
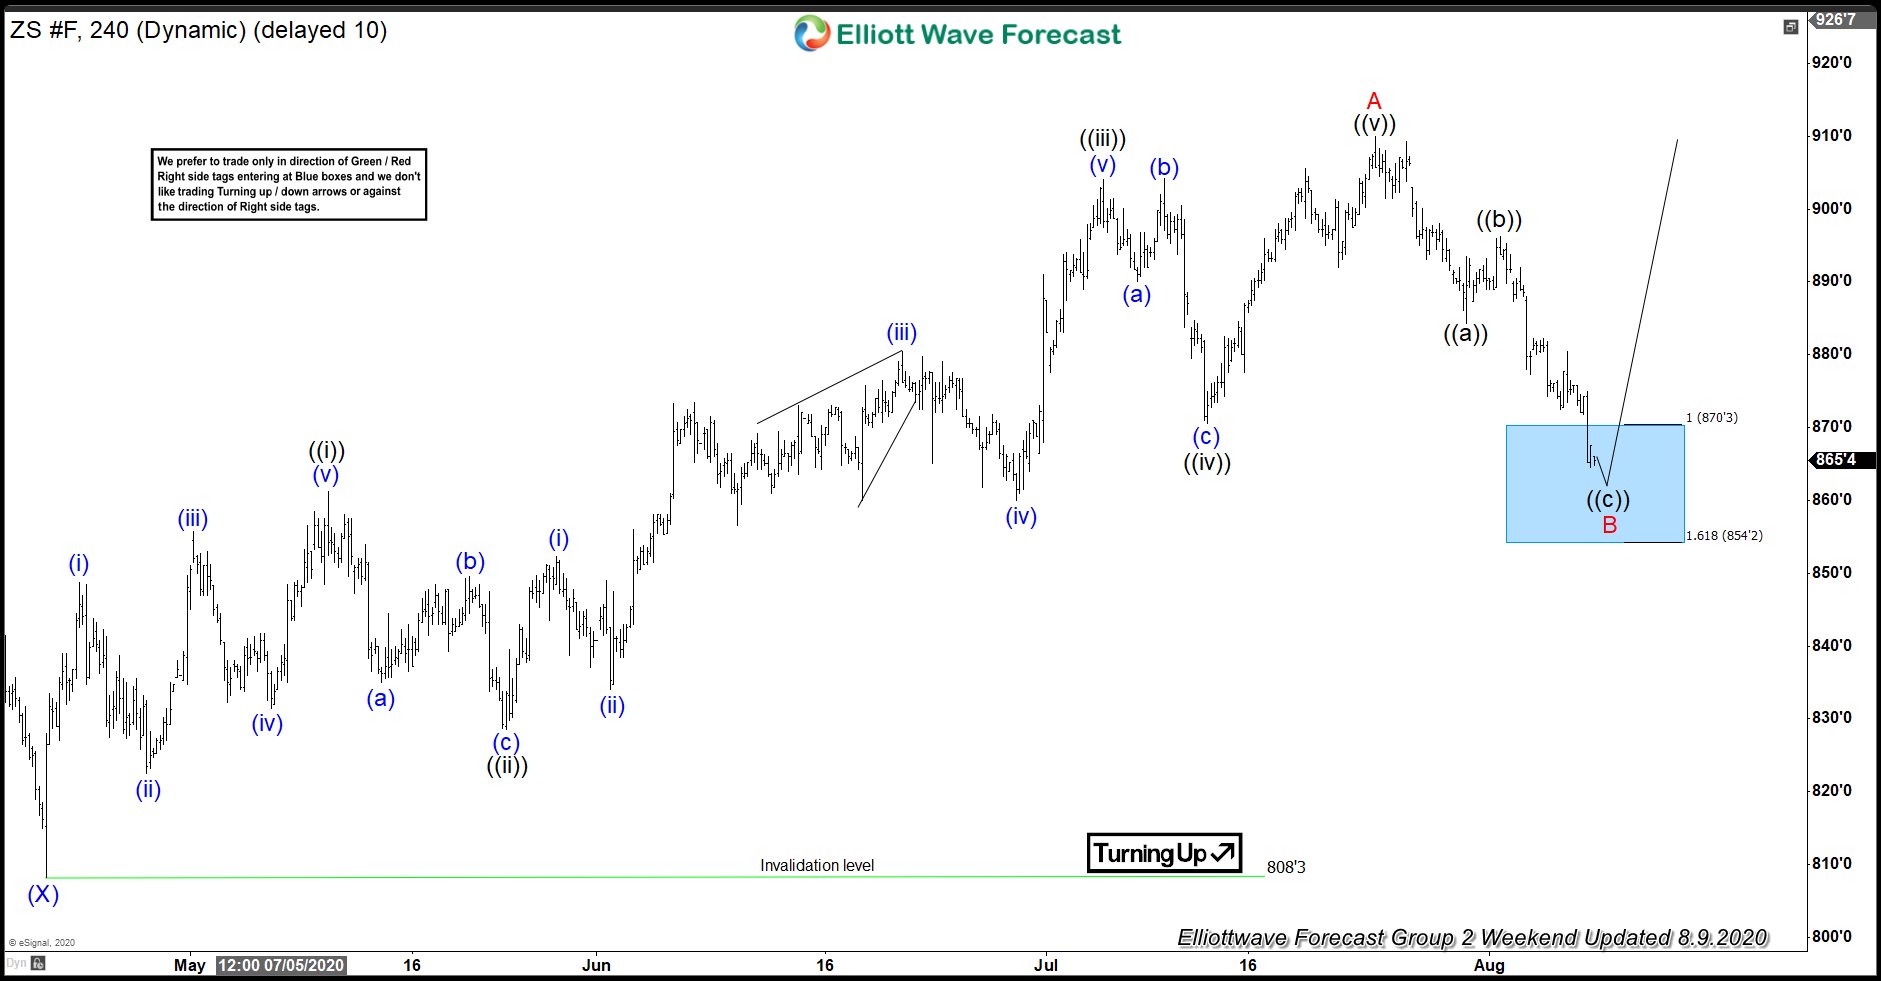
Forecasting The Bounce Higher in Soybean Futures (ZS_F)
Read MoreIn this blog, we are going to take a look at the Elliott Wave chart of ZS_F (Soybean Futures). The 4 hour chart update from August 9 shows that Soybean has ended the cycle from April 21 low as wave A at 910 high. The sub-waves of the rally unfolded as 5 waves impulsive structure. […]
-
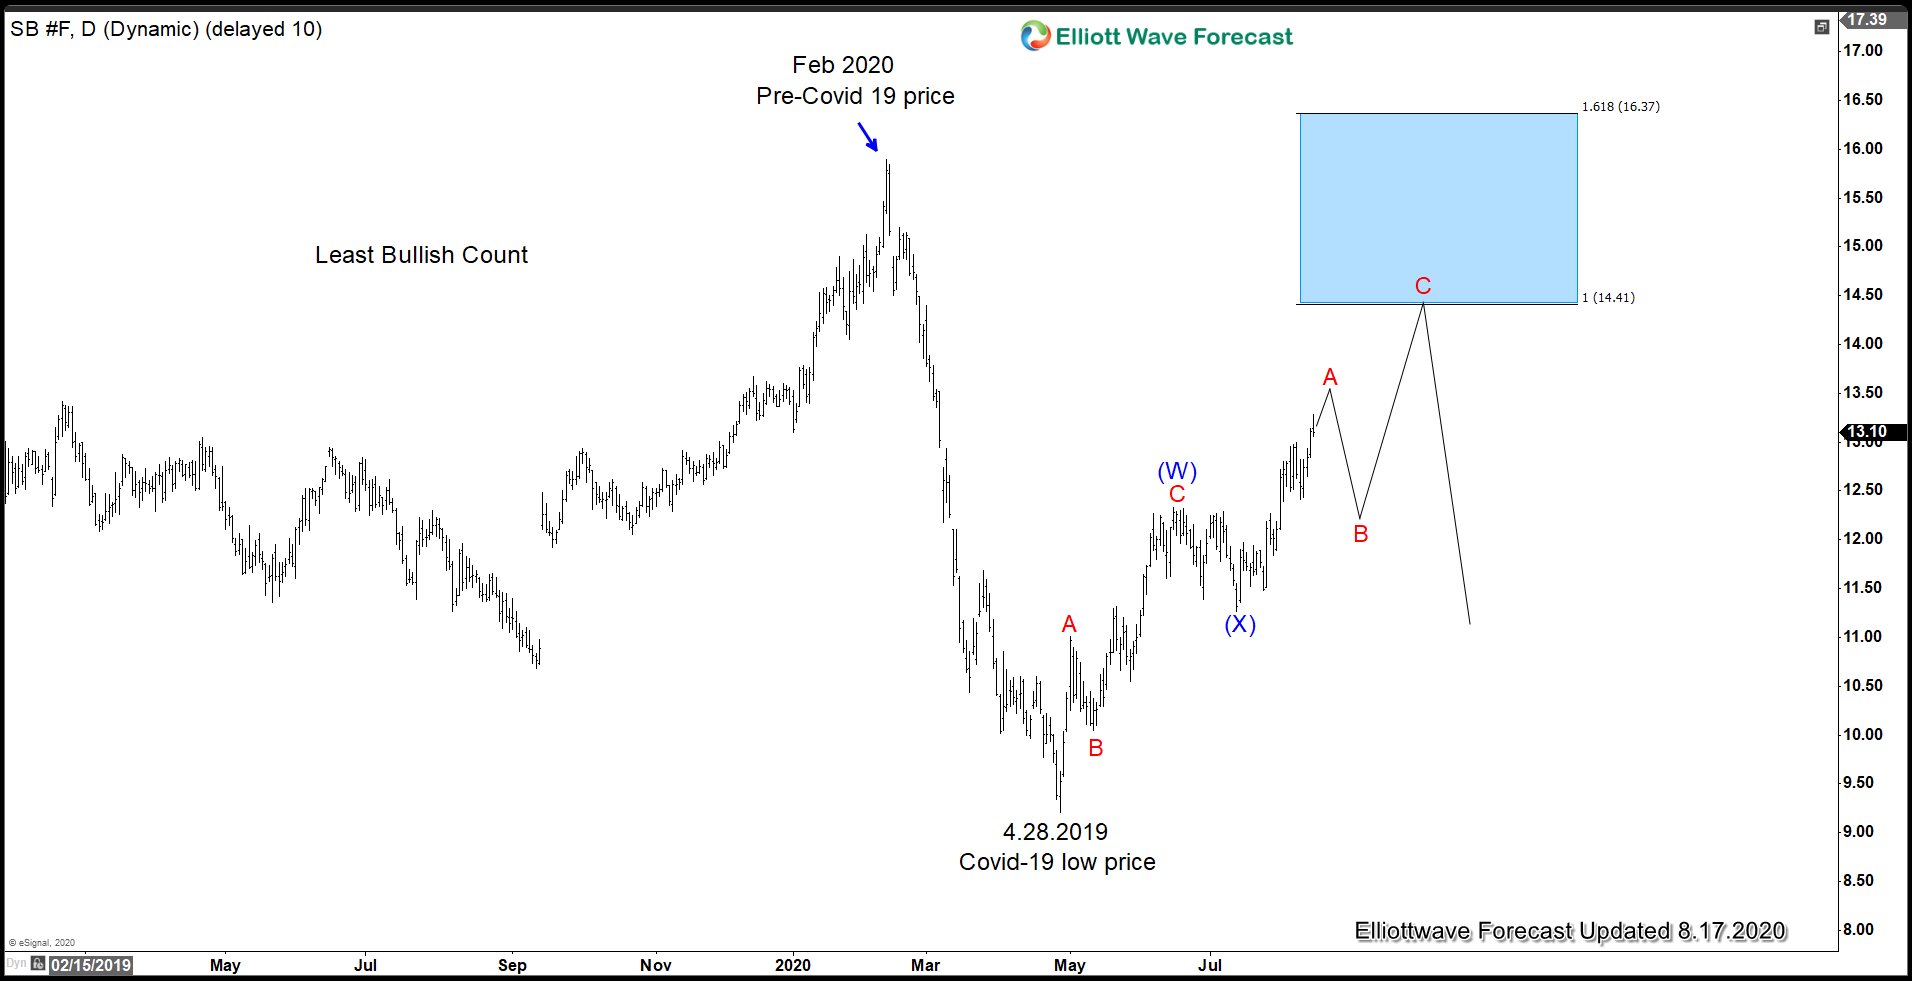
Supply Problems and Weak Dollar Buoy Sugar Prices
Read MoreSince the corona virus hit in March earlier this year, price of Sugar future (SB) has remained depressed as demands projected to plummet. Prices fell sharply lower at 42% to 9.2 cents per pound in April. Over the past few weeks however, prices have made impressive returns due to drought in Thailand and weaker U.S […]