
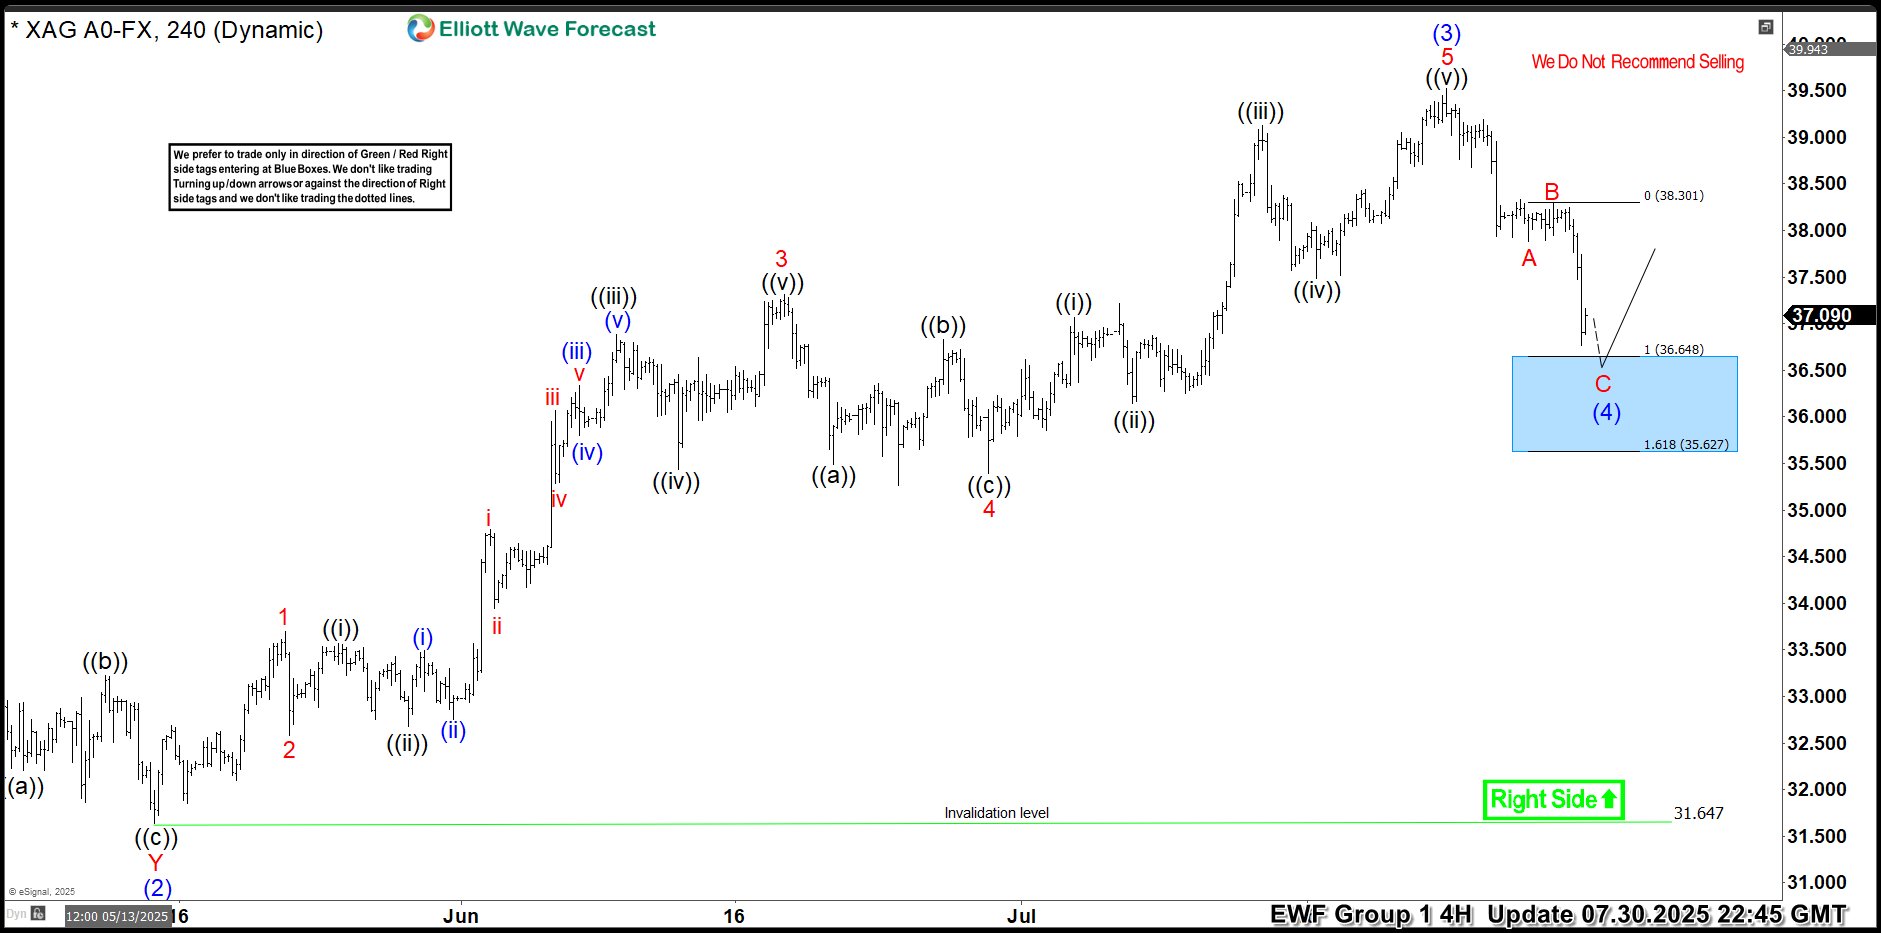
Hello traders. As our members know, we have had many profitable trading setups recently. In this technical article, we are going to talk about another Elliott Wave trading setup we got in Silver (XAGUSD). The commodity has completed its correction exactly at the Equal Legs zone, also known as the Blue Box Area. In this […]
-
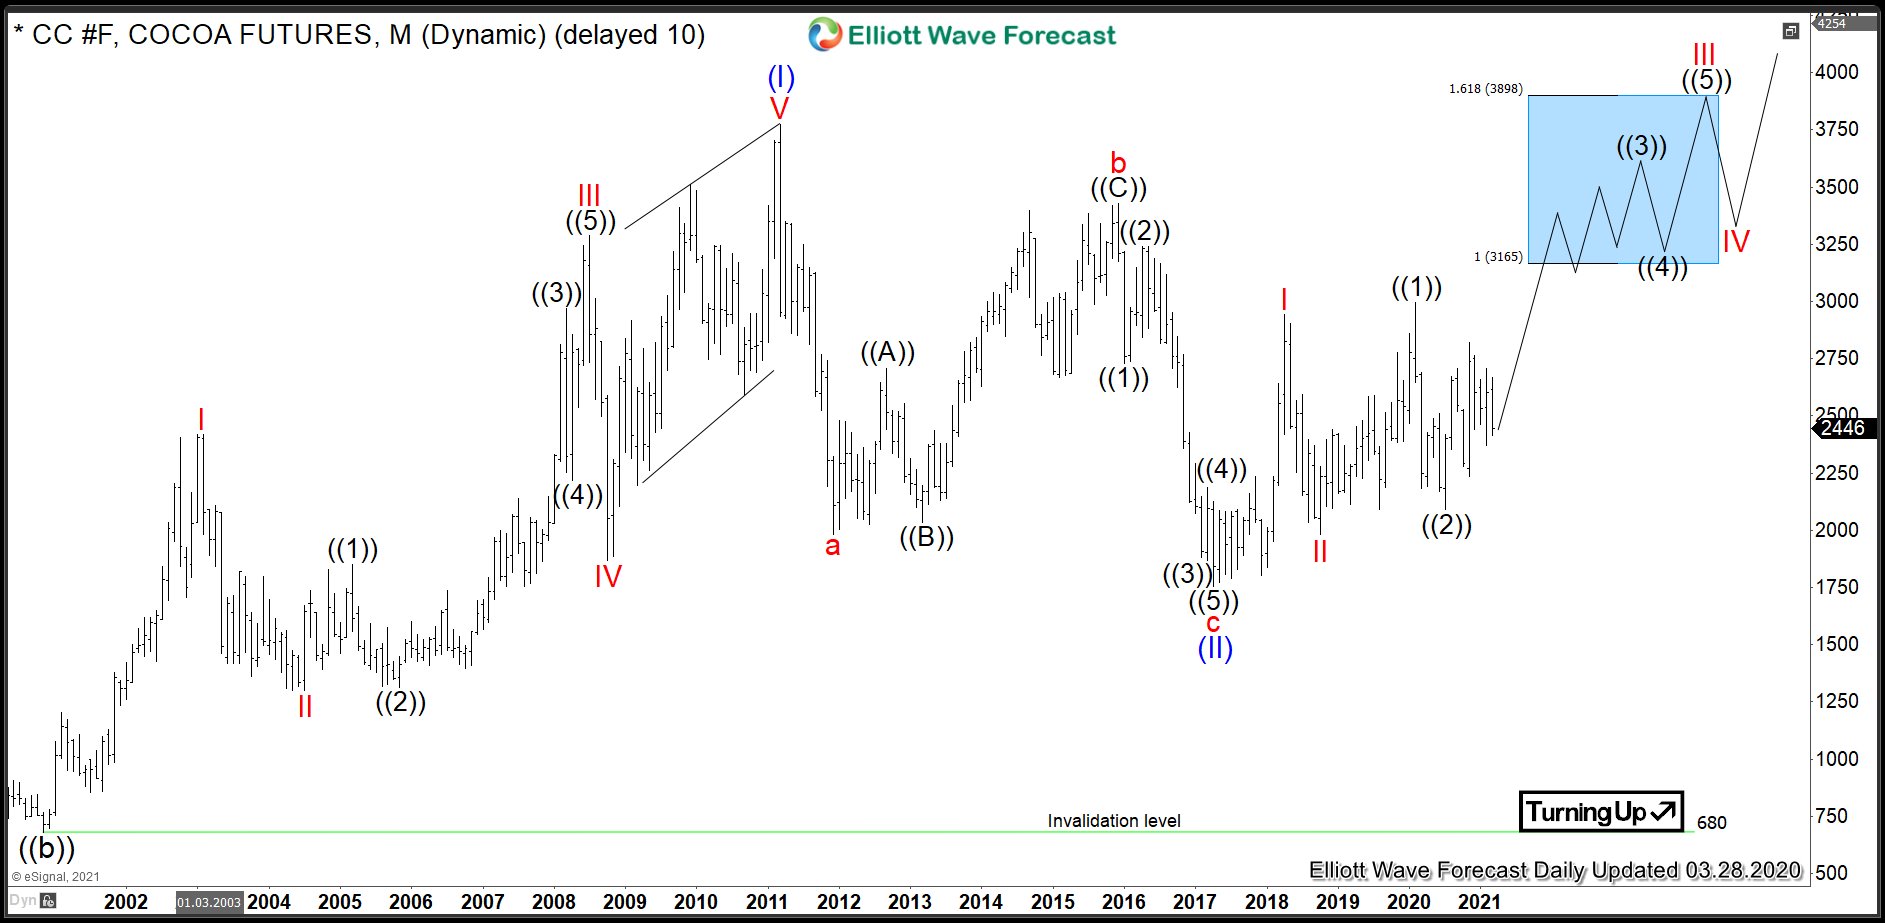
$CC #F: Bullish Sequence to Push Cocoa Prices Higher
Read MoreCocoa (or cocoa bean) is one of soft commodities, along with sugar, coffee, orange juice and cotton. The bean is the fully dried and fermented seed, wherefrom cocoa solids and cocoa butter can be extracted. Cocoa beans are the basis of the chocolate. One can trade Cocoa futures at ICE owned New York Board of […]
-
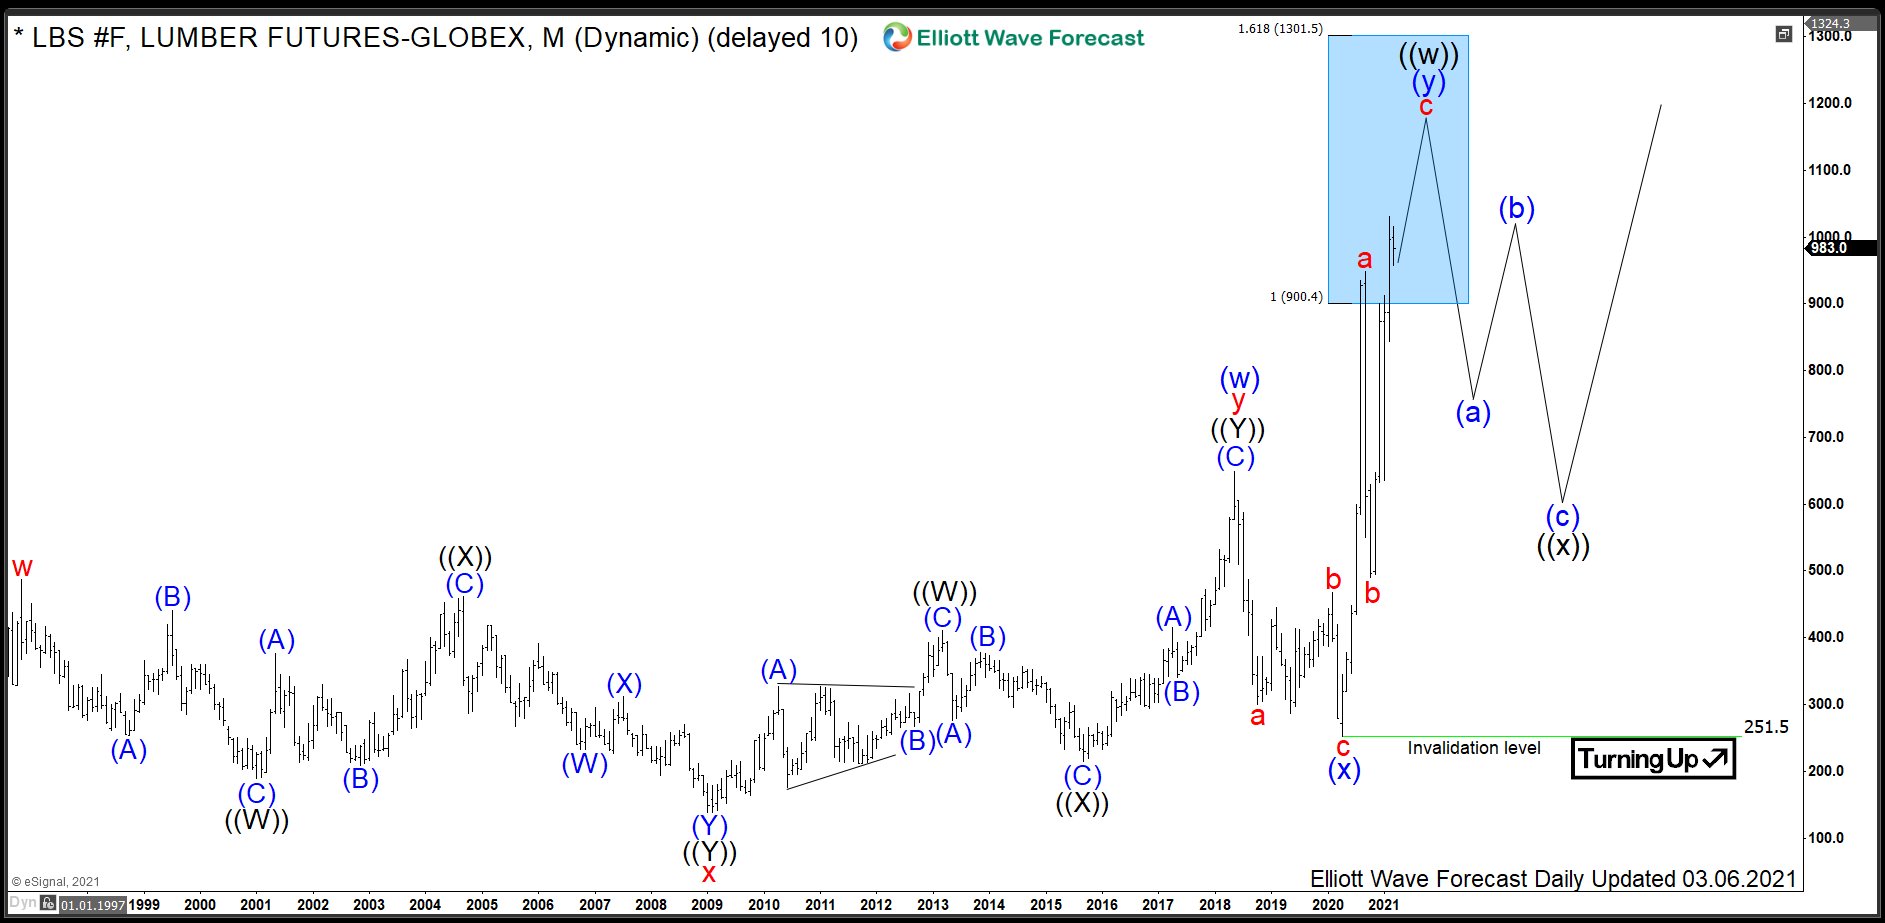
$LBS : Lumber Prices May Explode Real Estate Market
Read MoreLumber, also known as timber, is a type of wood that has been processed into beams and planks. One can trade it in form of Random Length Lumber futures and options at Chicago Mercantile Exchange within the agriculture asset class under the ticker $LBS. Currently, we see commodities in general, and metals and energy in […]
-
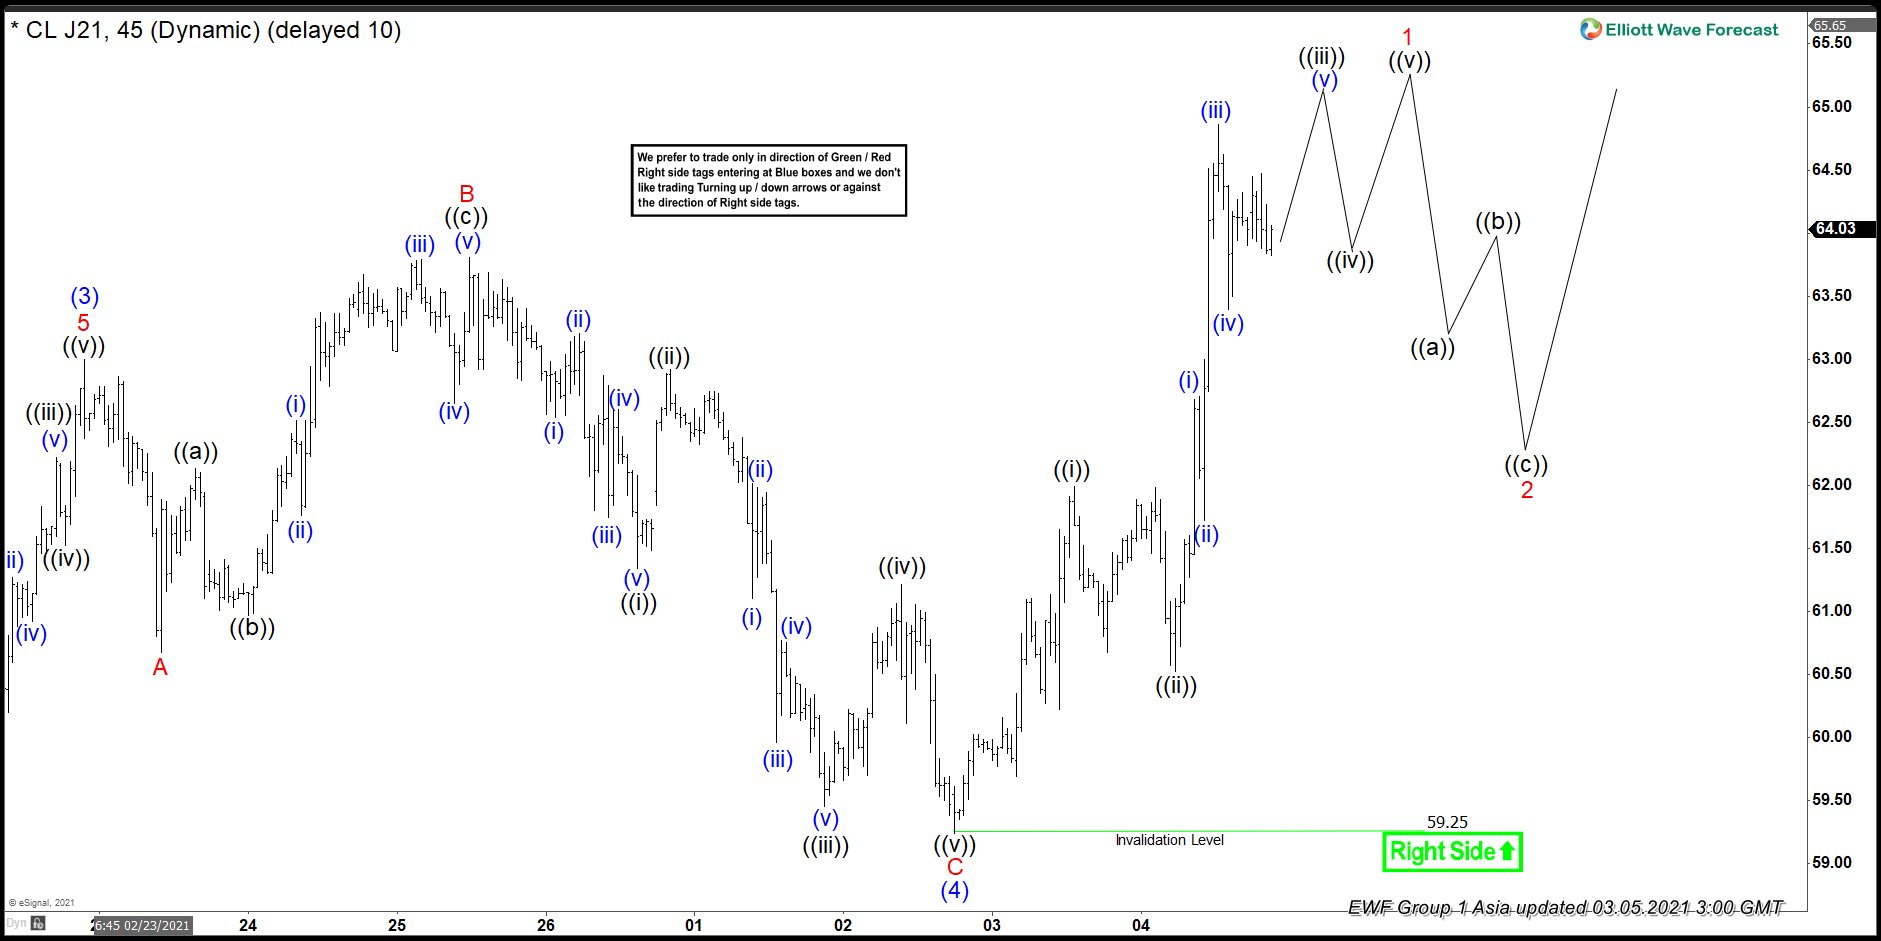
Elliott Wave View: Oil (CL) Wave (5) Rally in Progress
Read MoreOil has made a new high and continues the impulsive rally from April 2020 low. This article and video look at the Elliott Wave path.
-
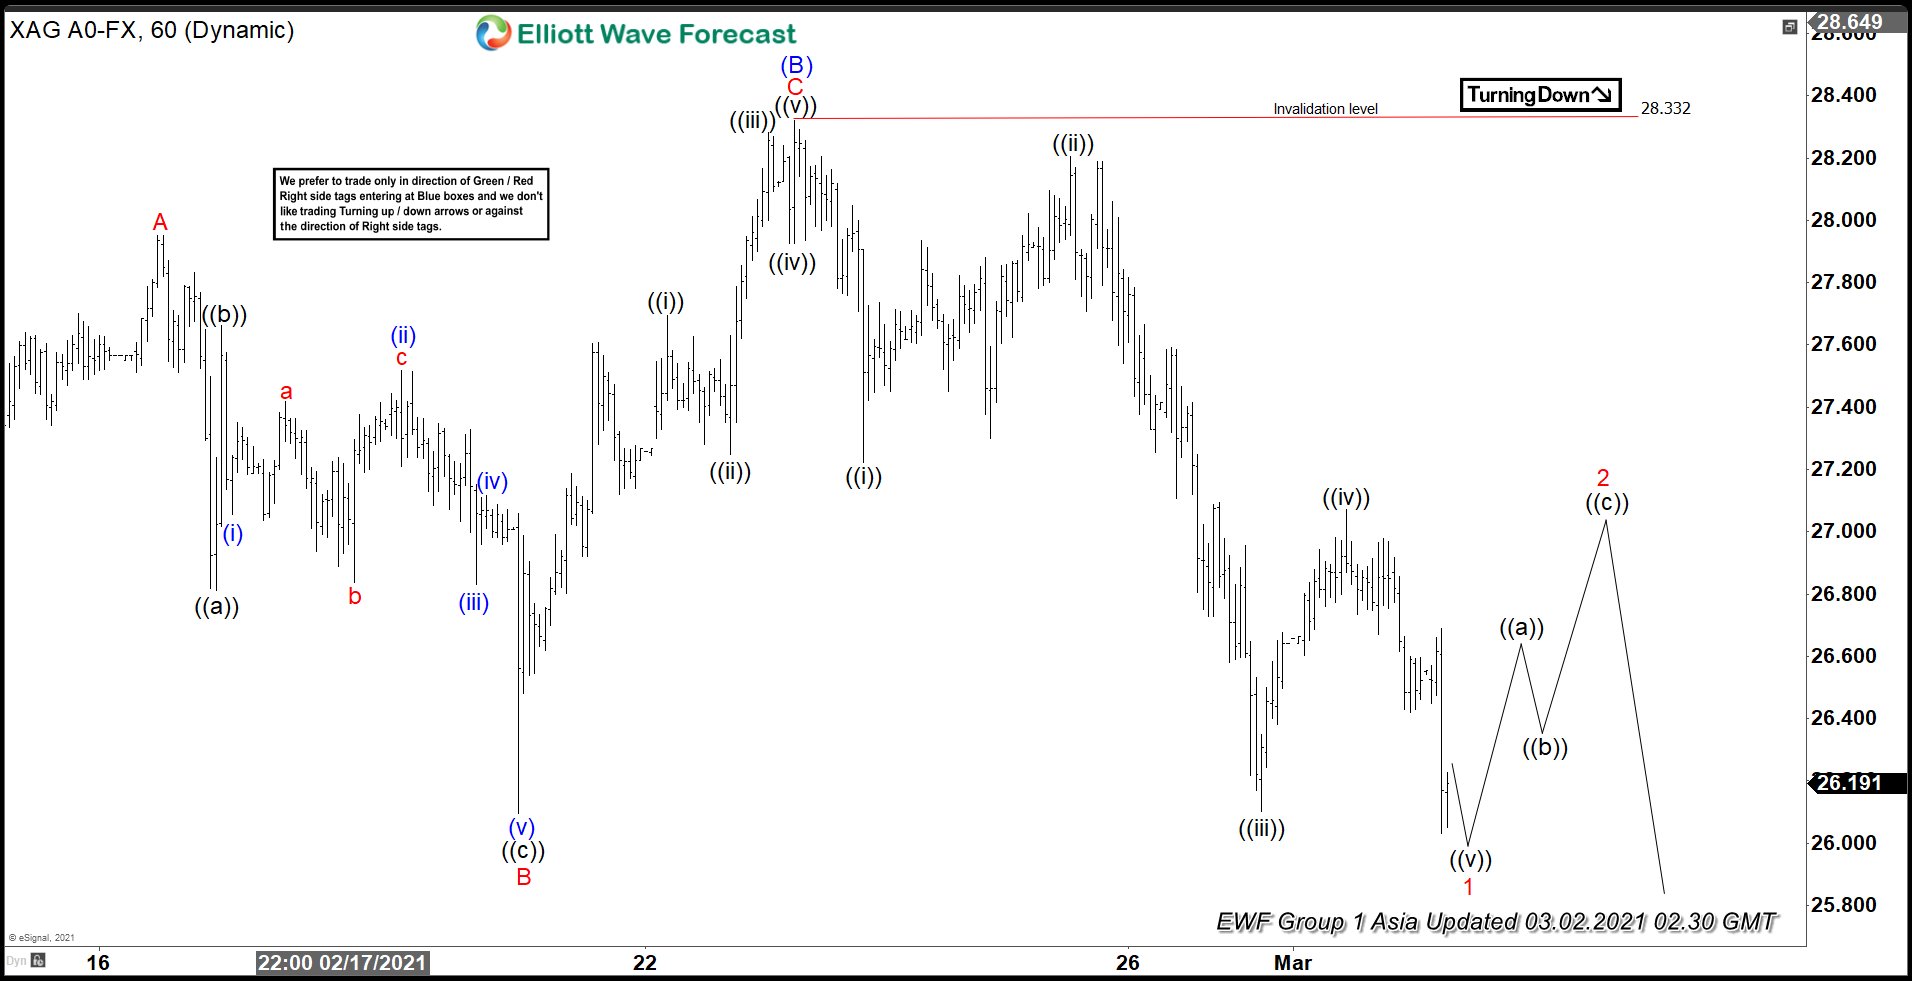
Elliott Wave View: Silver Pulling Back within Bullish Trend
Read MoreSilver is still correcting as a zigzag from February 1 peak. This article and video look at the short term Elliott Wave path.
-
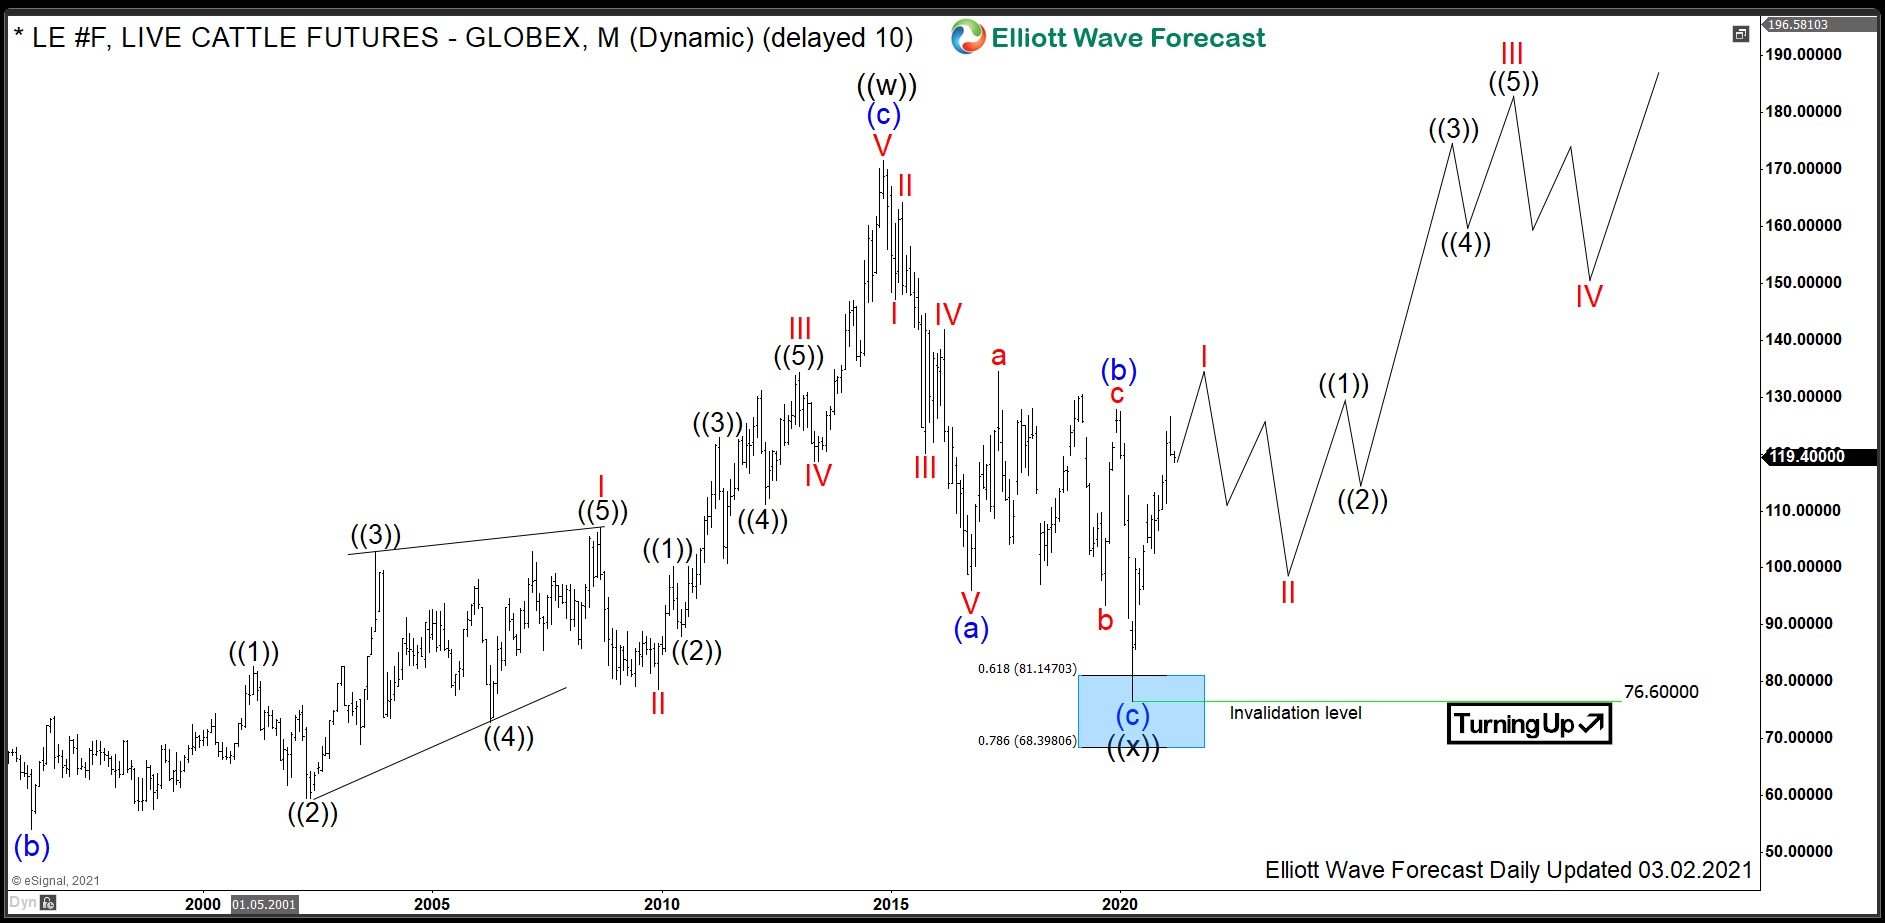
LE #F: Meat Prices to Double as Live Cattle Prices Rally
Read MoreLive Cattle is a livestock commodity within the agriculture asset class, along with lean hogs, feeder cattle and porc cutouts. Once the feeder cattle have reached the target weigh of 1050-1500 pounds, they can be referred to as fed or live cattle. One can trade Live Cattle futures at Chicago Board of Trade in contracts […]
-
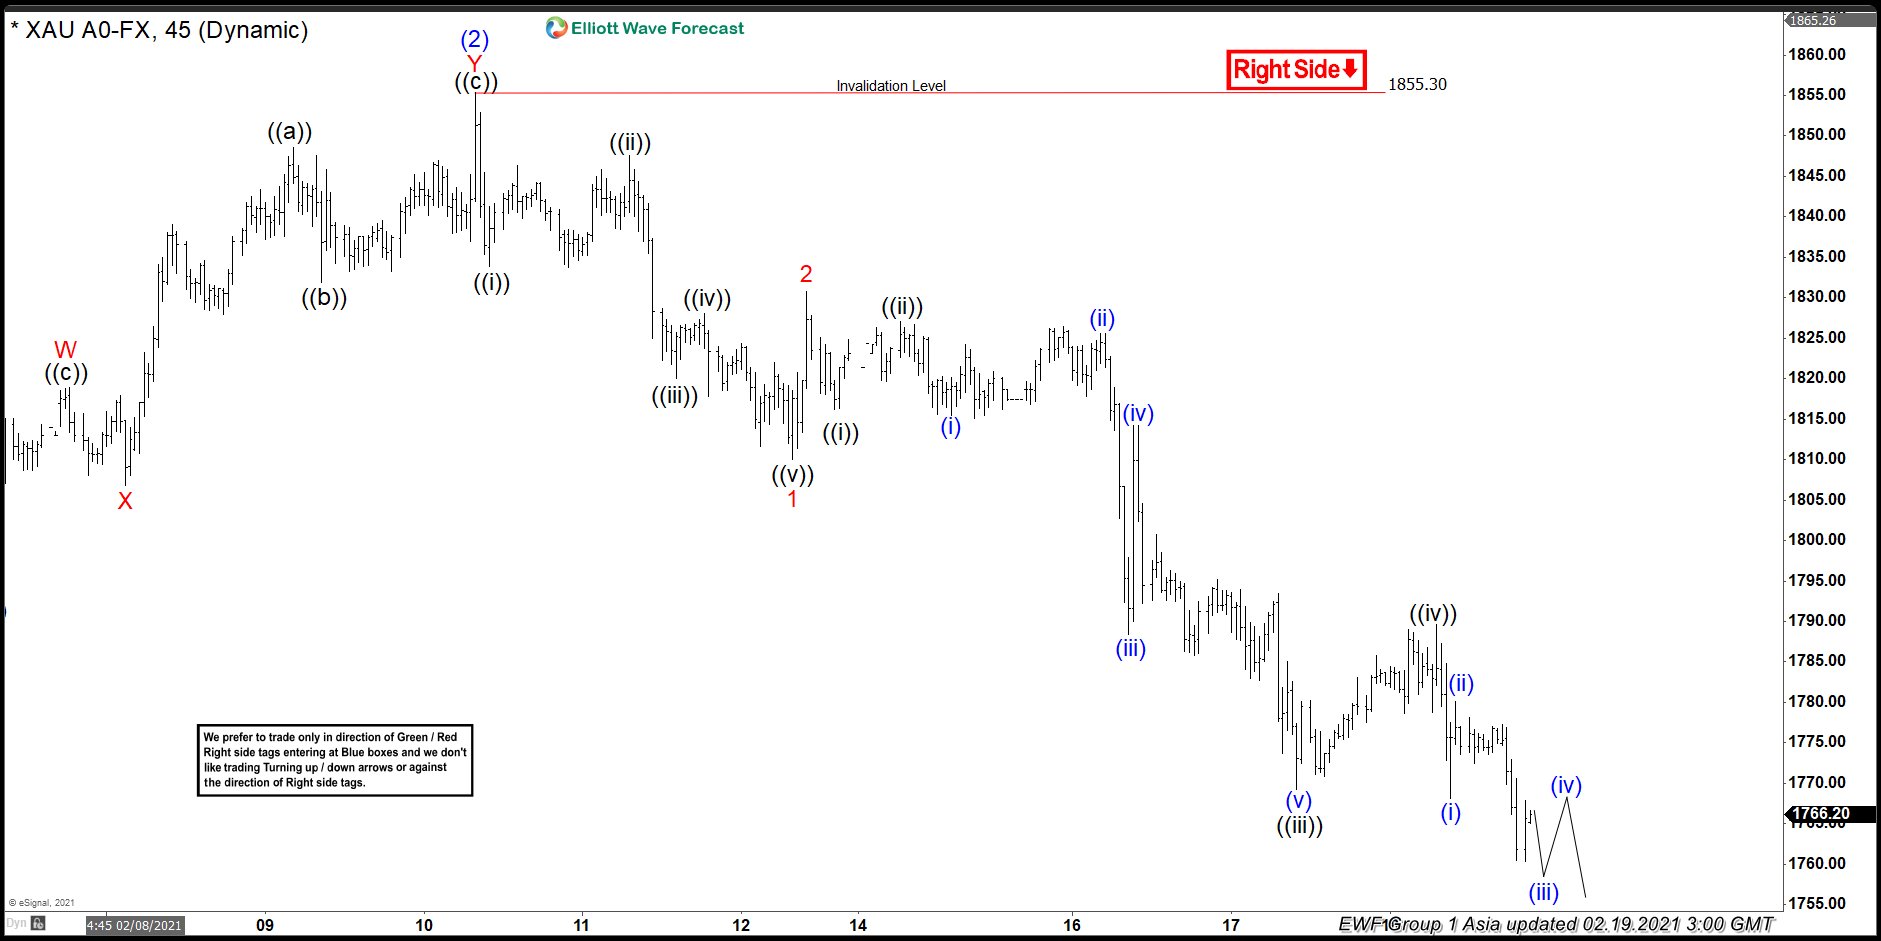
Elliott Wave View: Further Downside in Gold
Read MoreGold has broken below last year low suggesting it has further downside. This article and video look at the Elliott Wave path.