
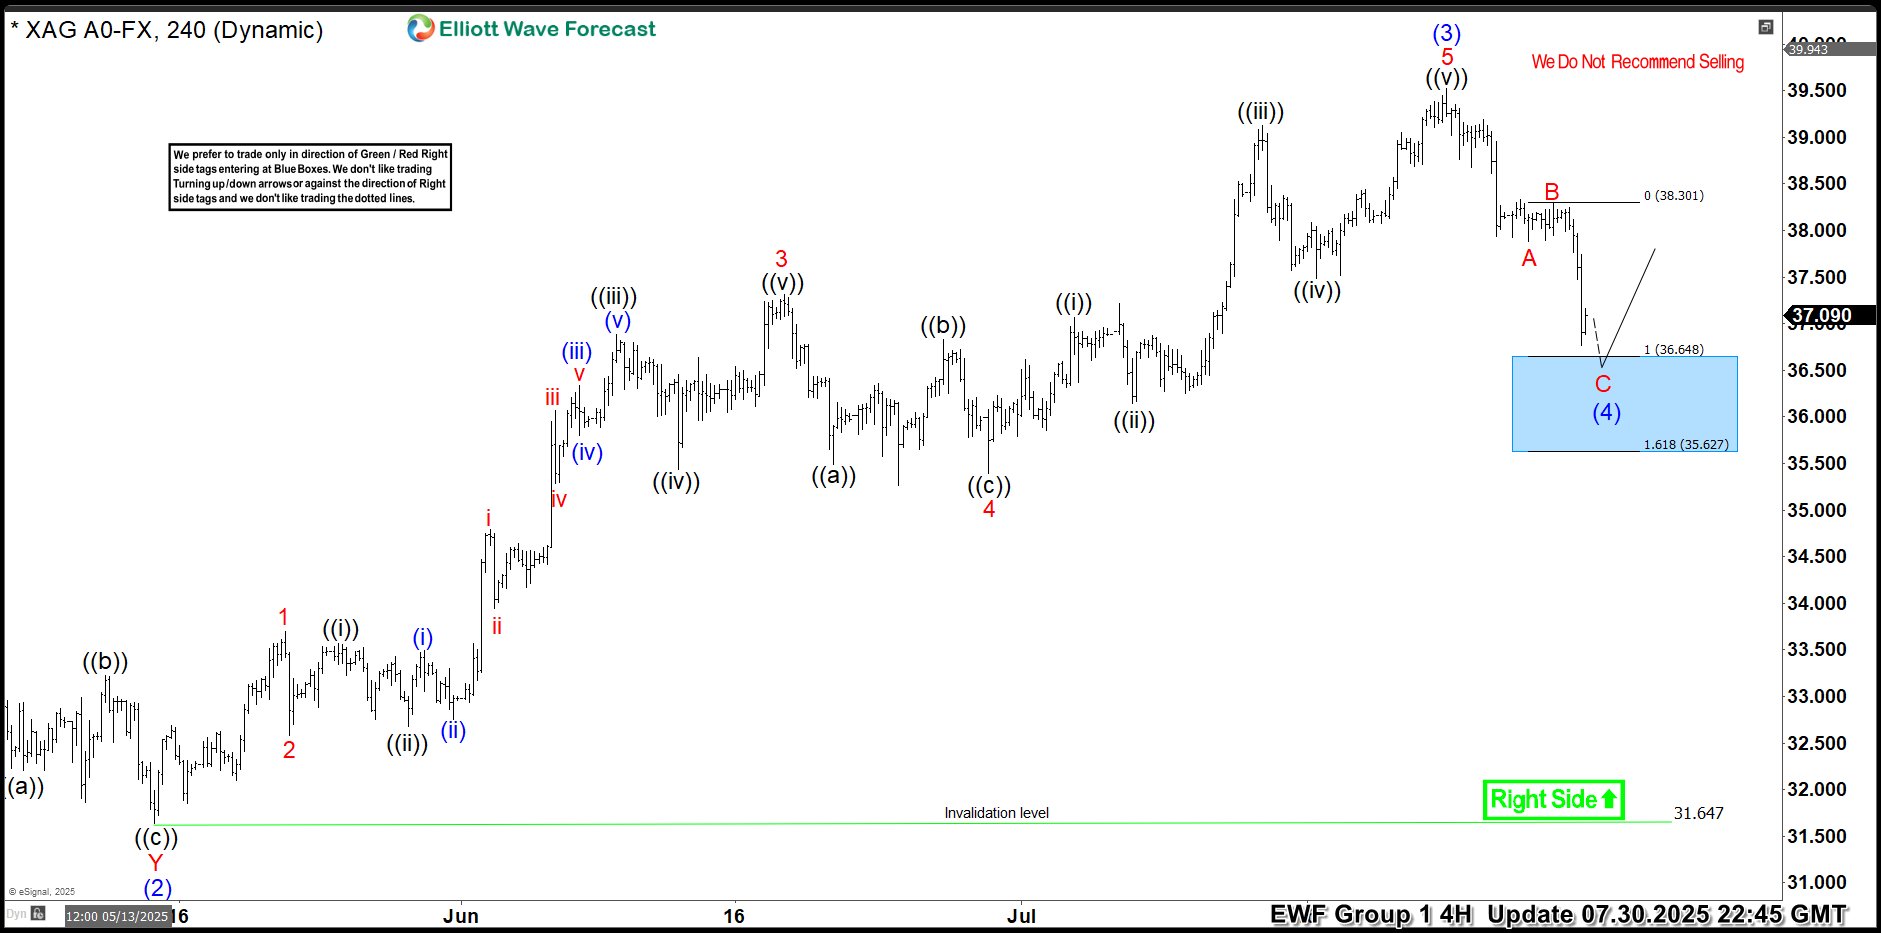
Hello traders. As our members know, we have had many profitable trading setups recently. In this technical article, we are going to talk about another Elliott Wave trading setup we got in Silver (XAGUSD). The commodity has completed its correction exactly at the Equal Legs zone, also known as the Blue Box Area. In this […]
-
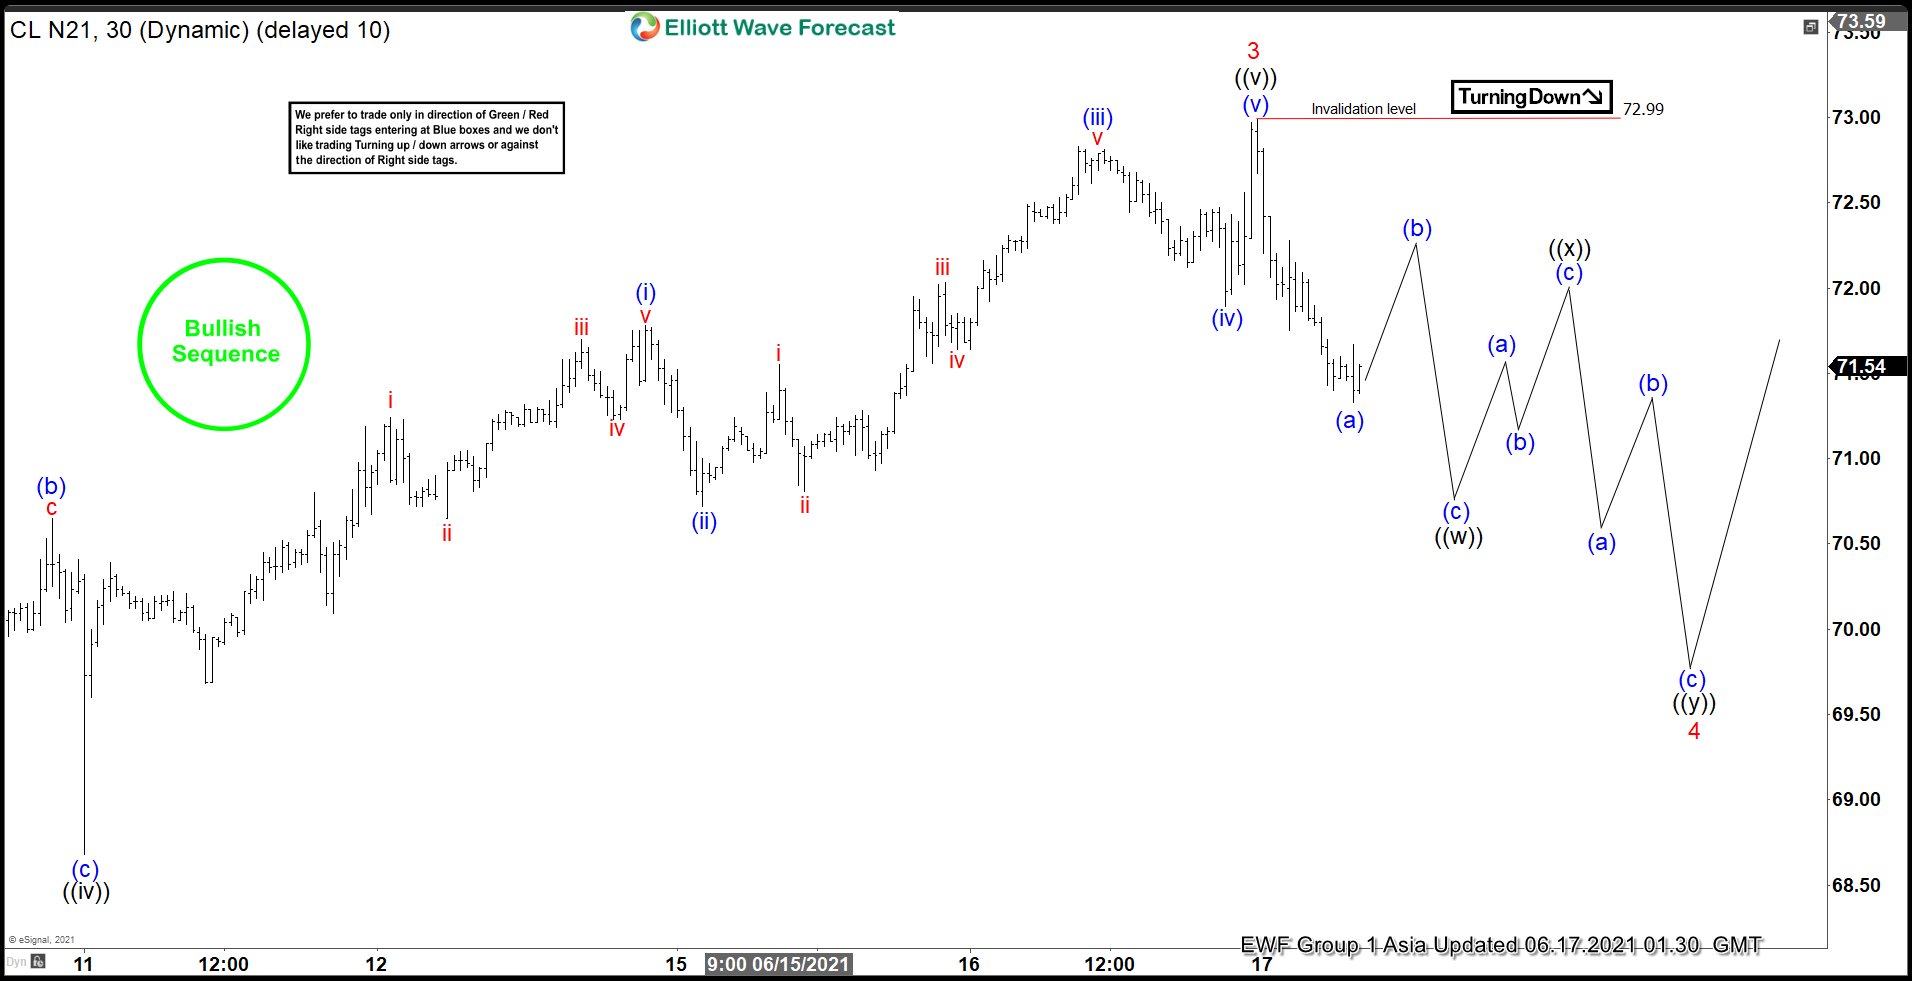
Elliott Wave View: Oil (CL) Starting to Pullback in Wave 4
Read MoreOil (CL) is pulling back in wave 4 to correct cycle from May 20 low before the rally resumes. This article and video look at the Elliott Wave path.
-
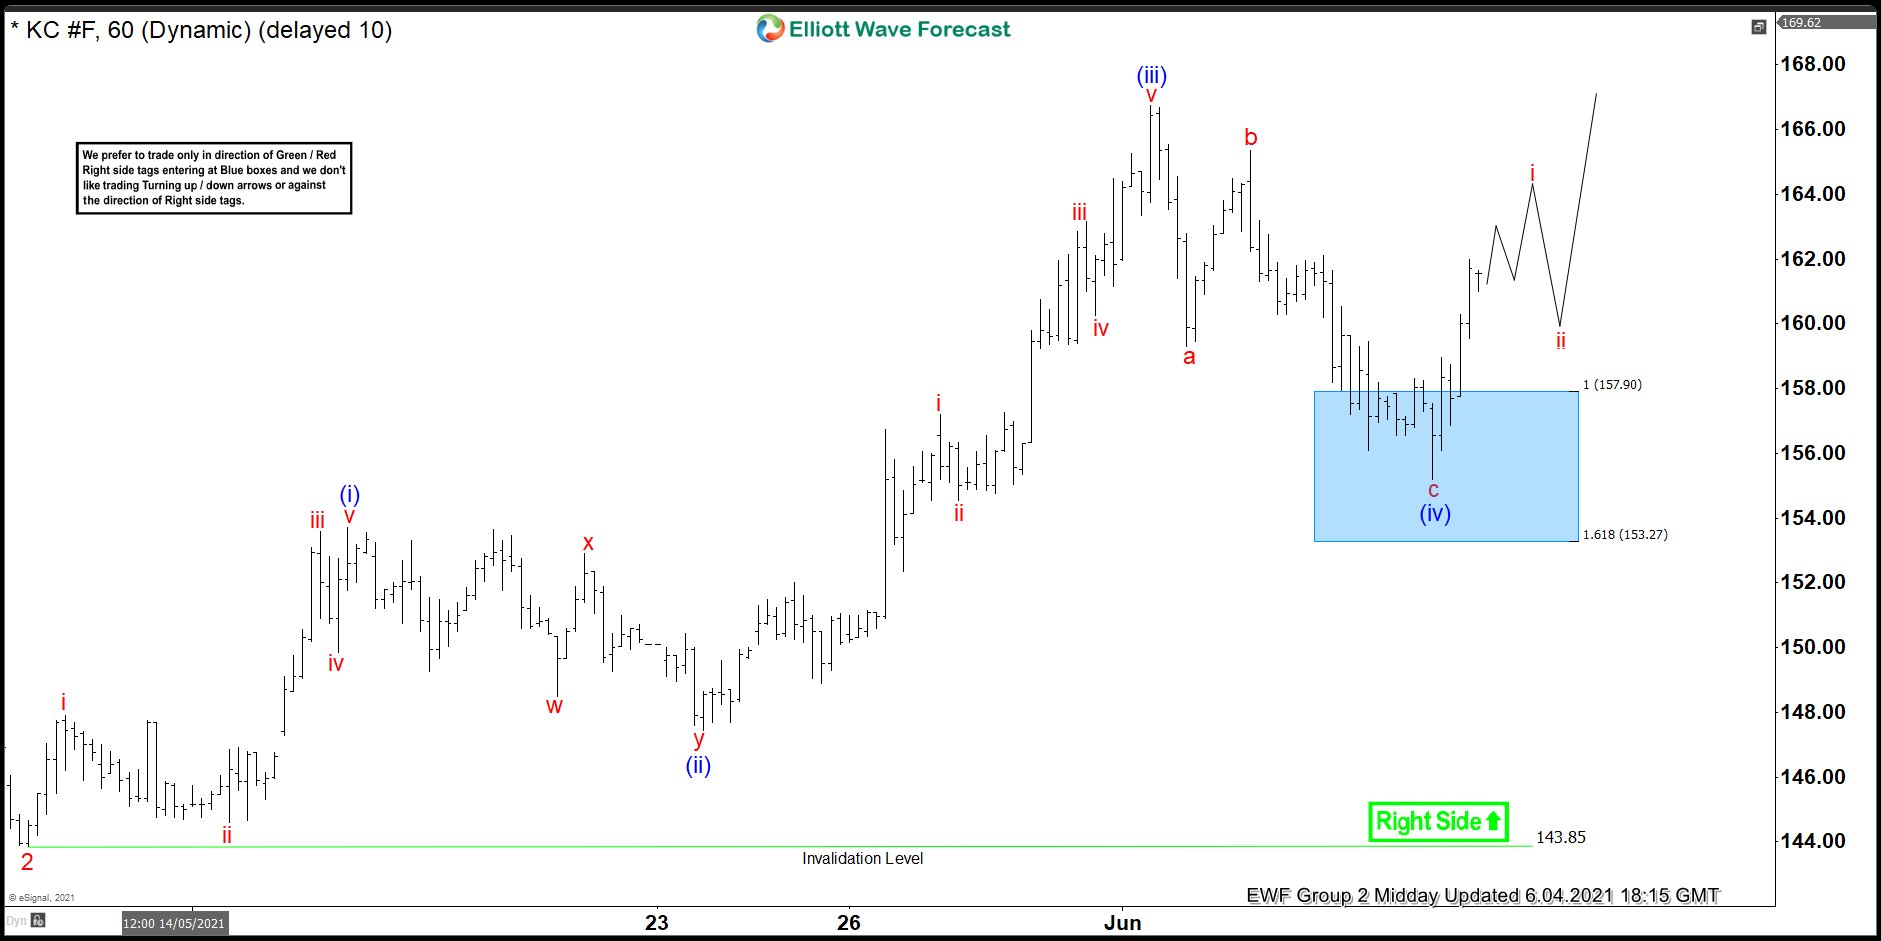
Coffee (KC_F) Presents Another Buying Opportunity At The Blue Box
Read MoreGreetings and salutations fellow traders. In this blog, we examine the recent buying opportunity presented by Coffee. Looking at the Elliott Wave 1 hour chart from 6/3/2021, we see a rally from $143.85 red wave 2 lows. We anticipated the rally to complete five wave impulse in the blue degree. As shown in the chart from 6/3/2021, […]
-
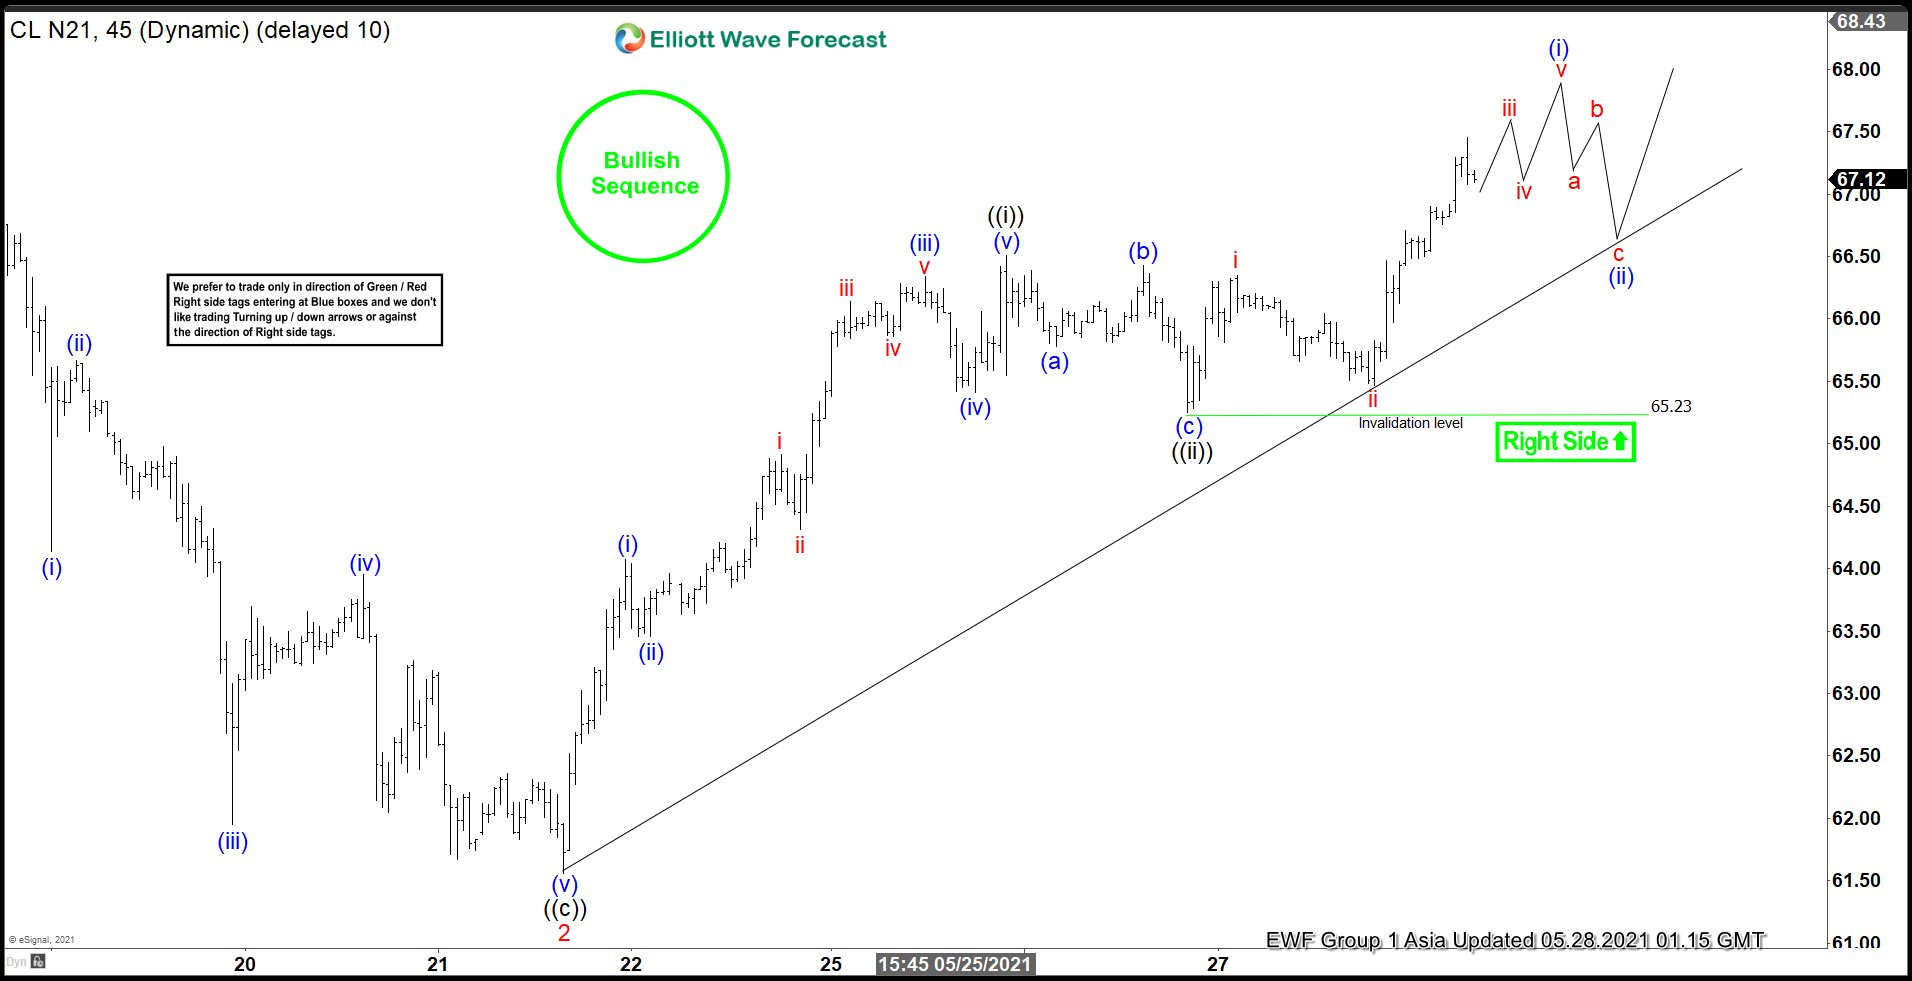
Elliott Wave View: Oil (CL) Should Continue to Extend Higher
Read MoreOil has broken higher and resumed the bullish cycle from April 2020 low. This article and video look at the Elliott Wave path.
-
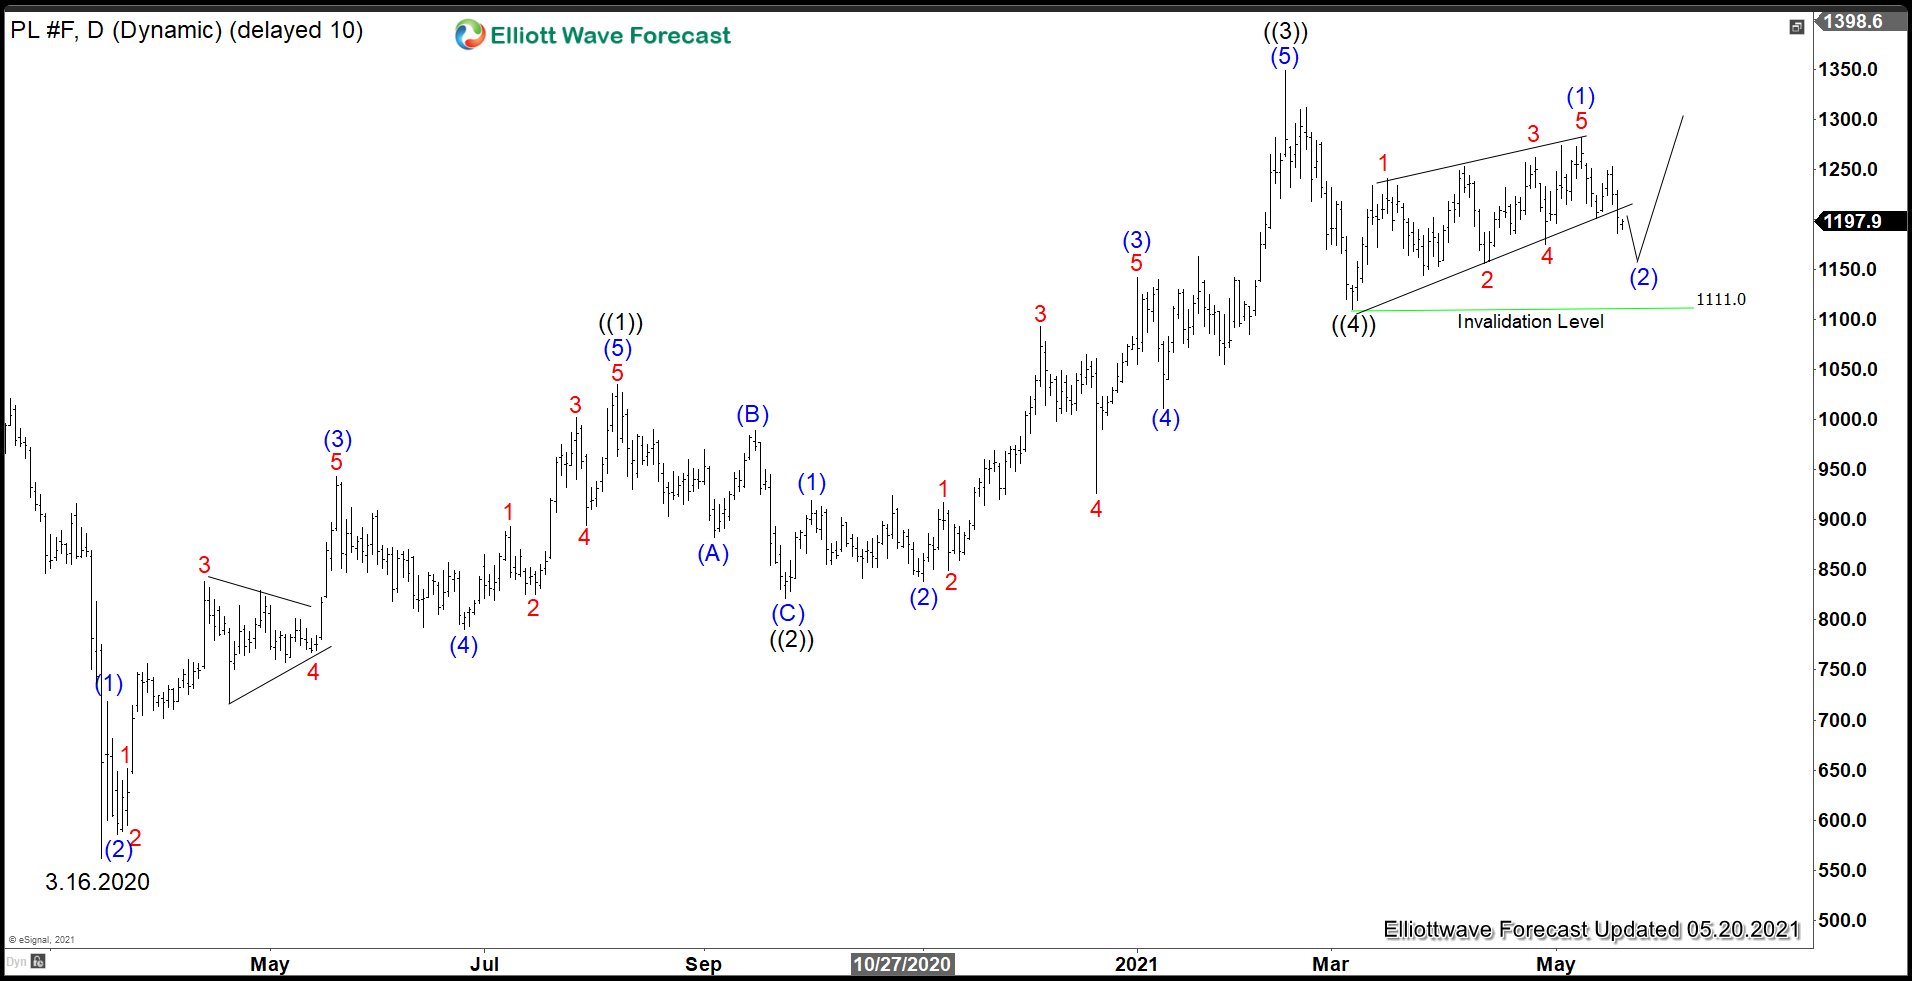
Platinum Looking for 5 Waves Rally
Read MorePost-pandemic economic rebound, government infrastructure spending, and green energy plan have driven the rally in industrial and precious metals in 2021. As governments globally are looking to curb climate change, demand for platinum may surge. The metal is used in catalysts in diesel vehicle engines to reduce carbon emissions. World Platinum Investment Council forecasts demand […]
-
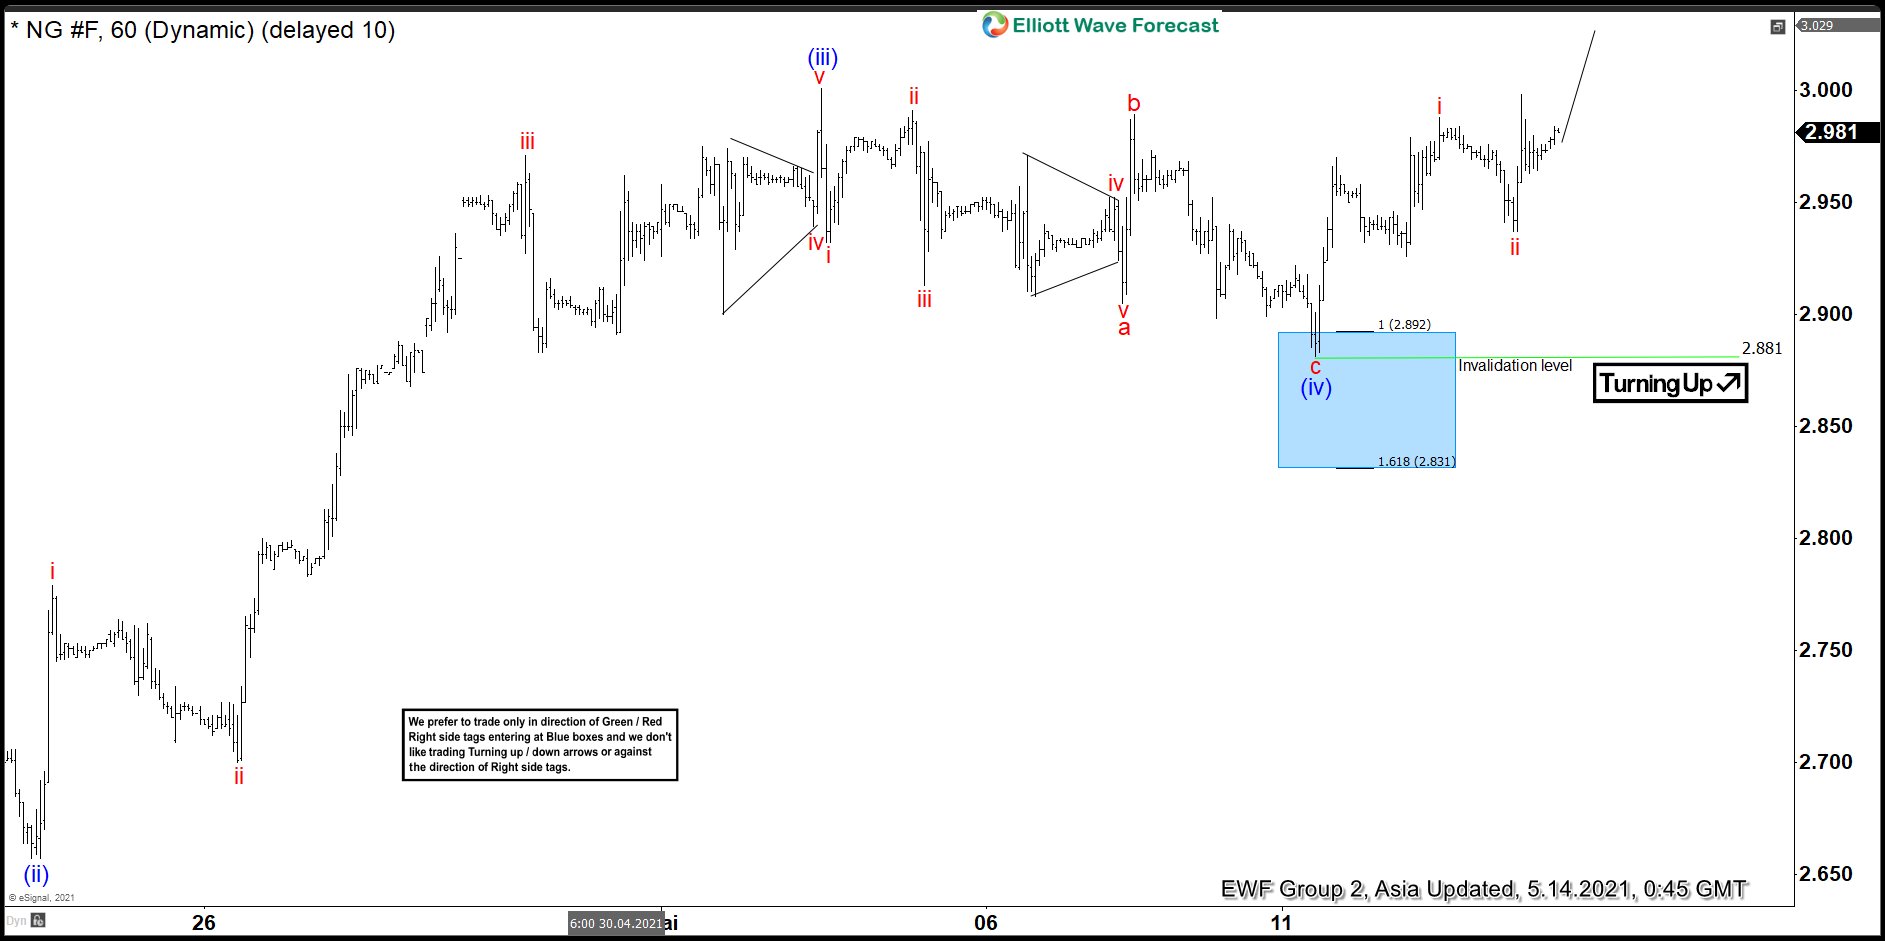
Natural Gas (NG) Reacts Higher From The Blue Box
Read MoreNatural Gas Resumed Higher After It found Buyers In The Blue Box In this blog, we take a look at the short term view on Natural Gas reaching the blue box and reacting higher after finding buyers. On the 1 hour chart from 5/11/2021, the commodity rallied in 5 impulse waves in the subminuette (red) degree. This […]
-

Elliott Wave View: Oil May See Short Term Support Soon
Read MoreOil shows a 5 waves diagonal rally from March 24 low and dips can find support soon. This article and video look at the Elliott Wave path.