
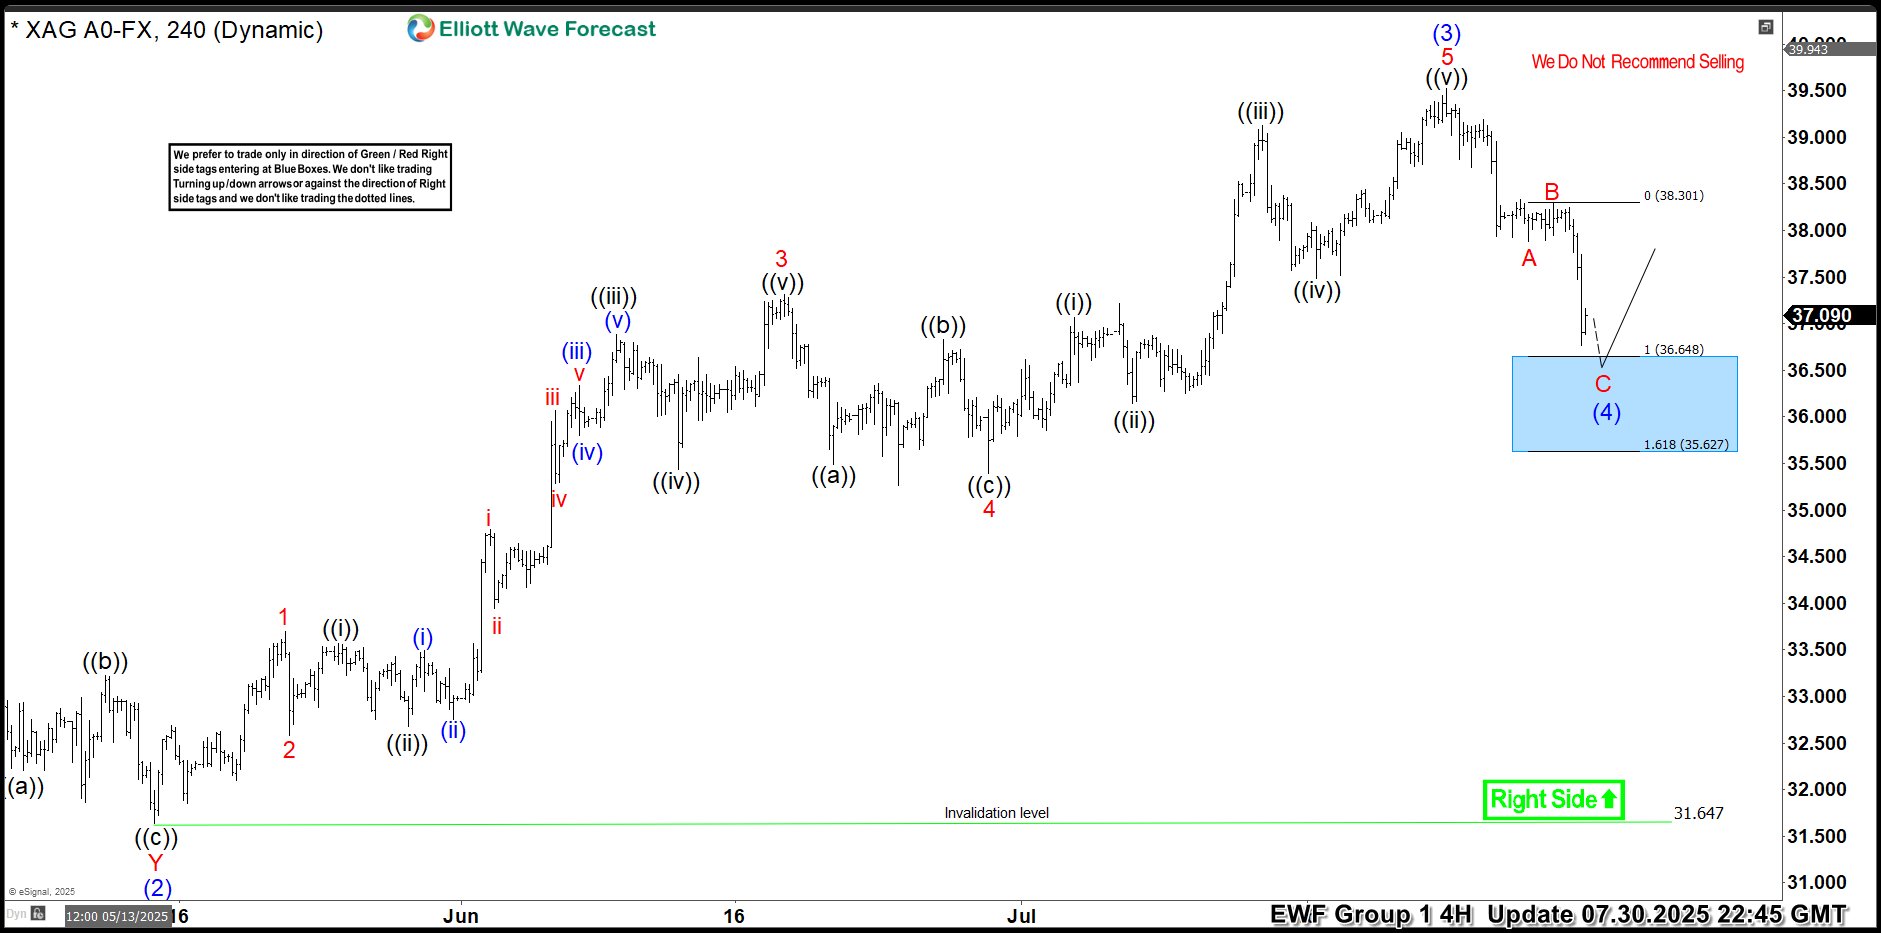
Hello traders. As our members know, we have had many profitable trading setups recently. In this technical article, we are going to talk about another Elliott Wave trading setup we got in Silver (XAGUSD). The commodity has completed its correction exactly at the Equal Legs zone, also known as the Blue Box Area. In this […]
-

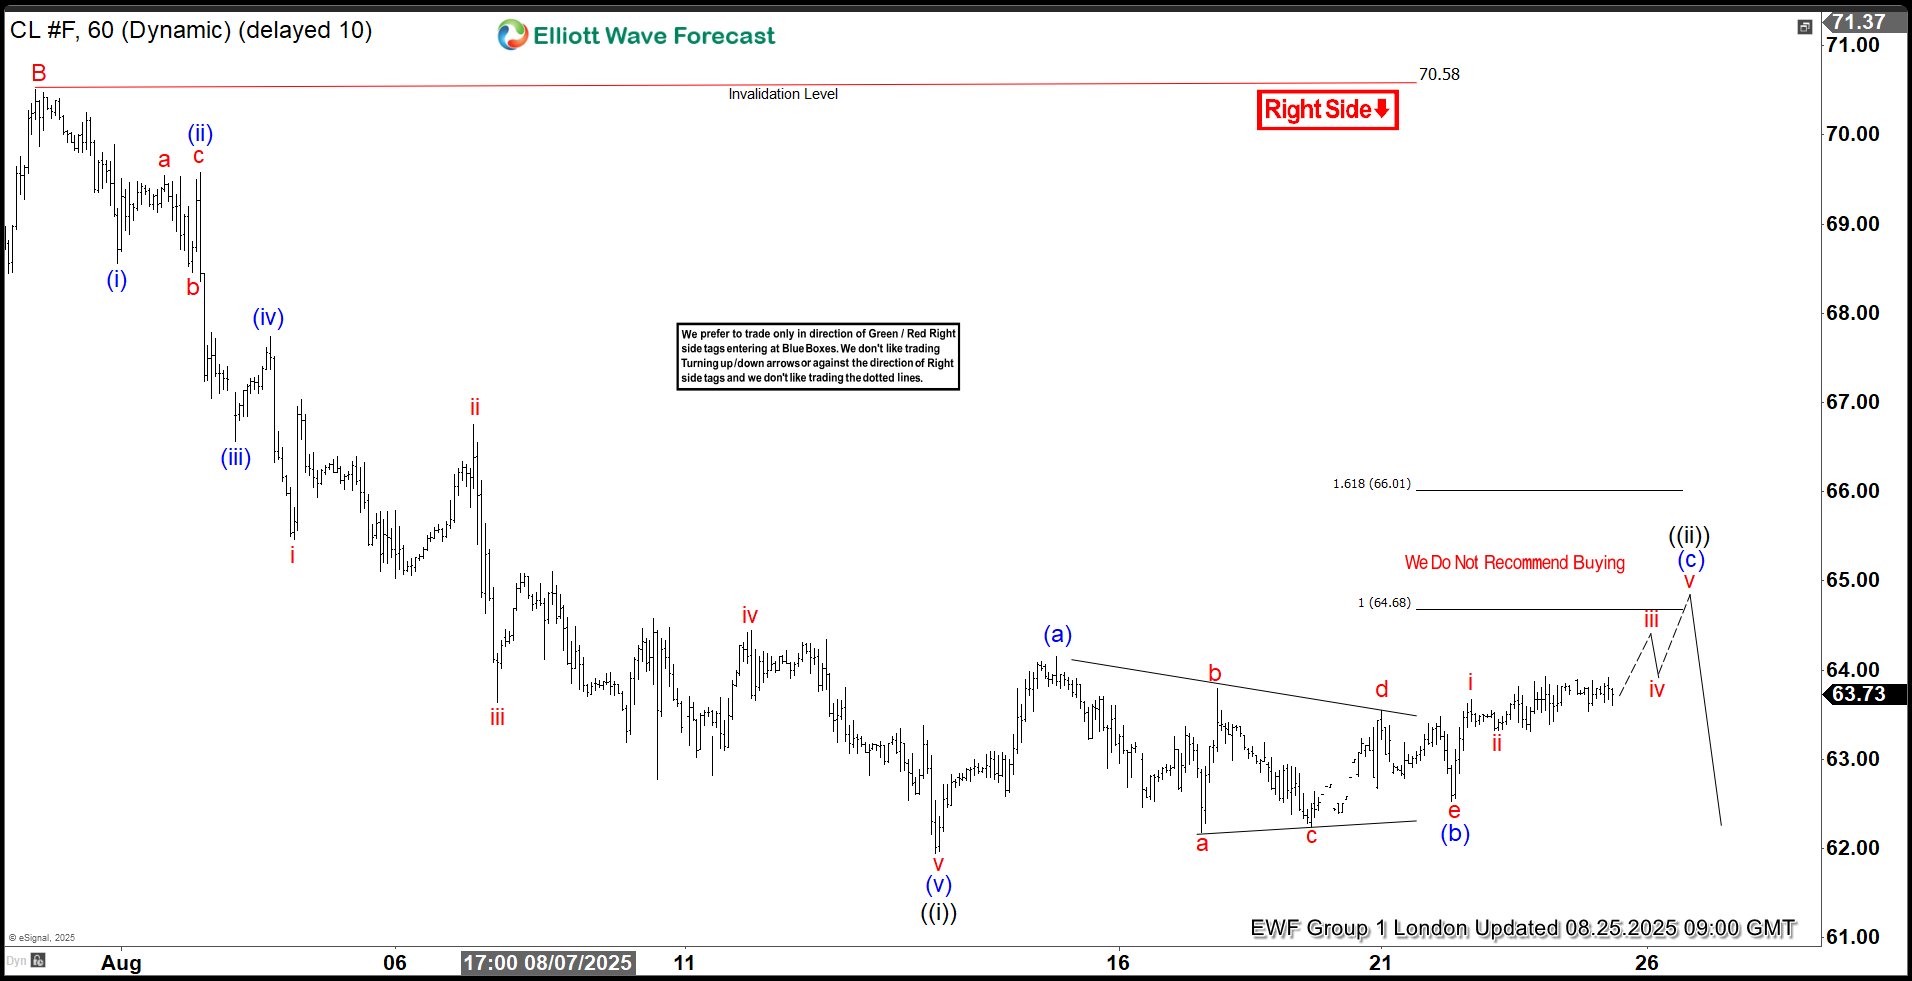
Light Crude Oil (CL) Elliott Wave Outlook Points to Lower Prices
Read MoreLight Crude Oil (CL) has turned lower in impulsive structure after ending 3 waves rally. This article and video look at the Elliott Wave path.
-
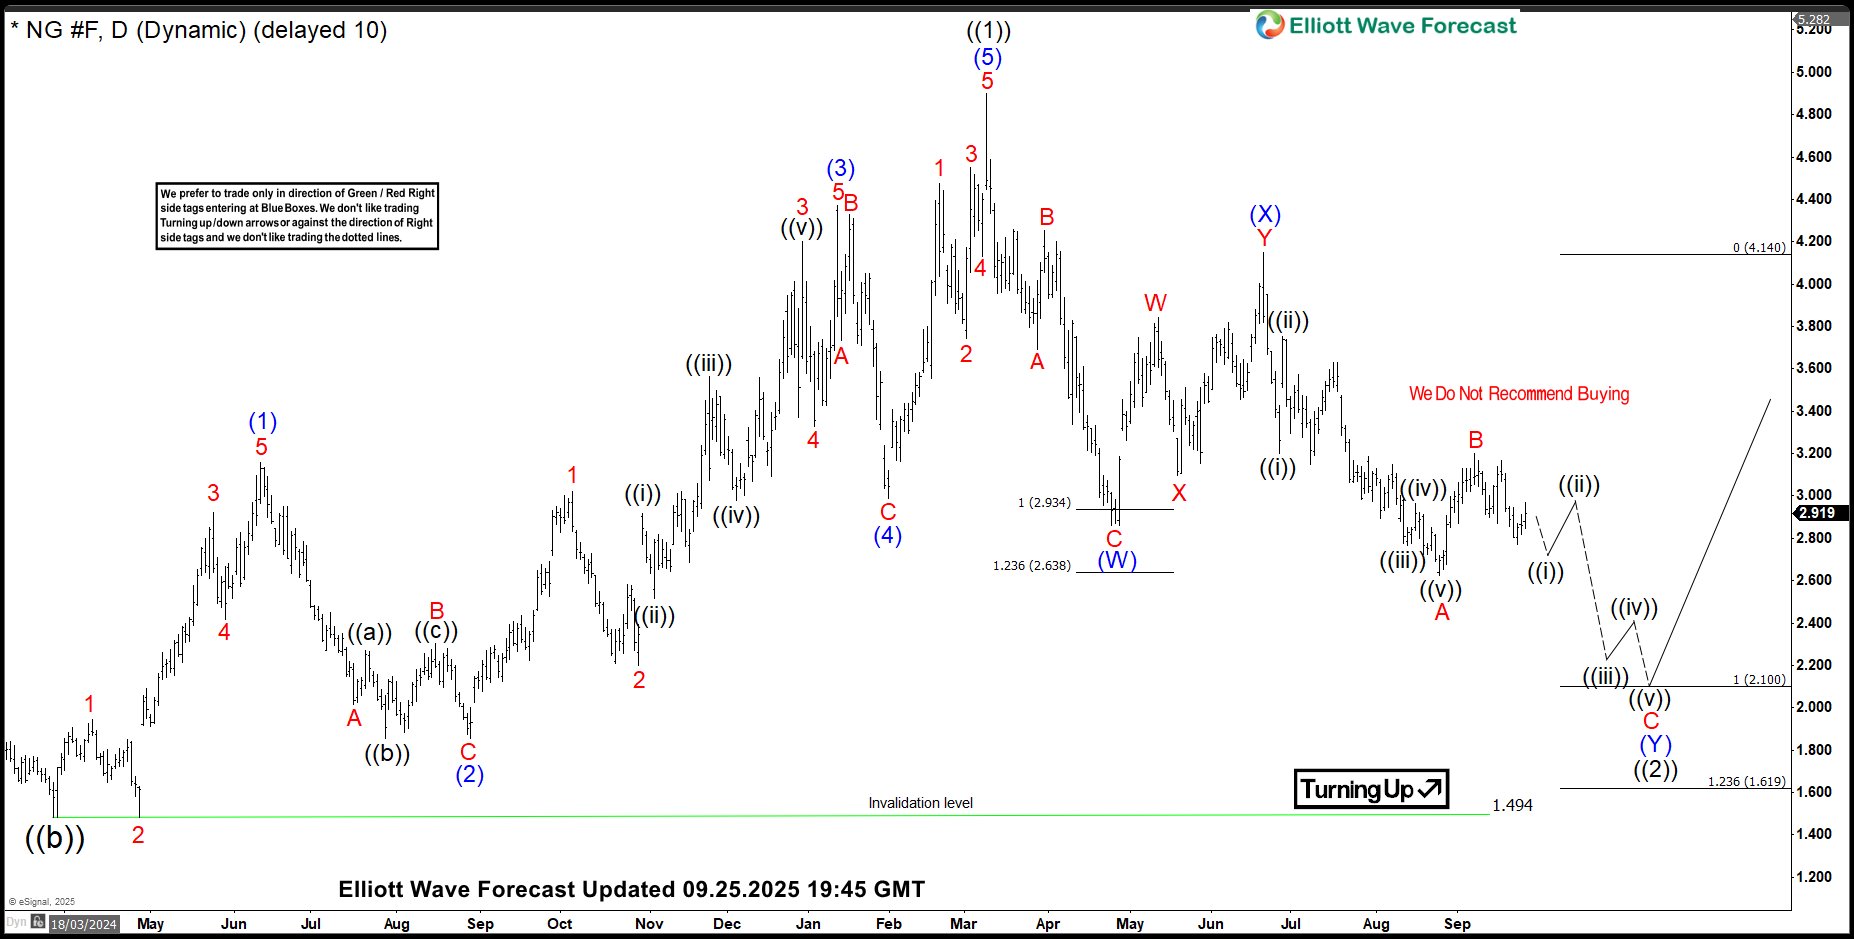
Elliott Wave: Natural Gas May Drop Further Before Buyers Step In
Read MoreNatural Gas has been showing some interesting price action lately, and for traders who use Elliott Wave analysis, the current setup is worth a closer look. The market has been moving through a double three correction characterized by a series of lower lows and lower highs. Both the daily and 4-hour charts suggest we might […]
-
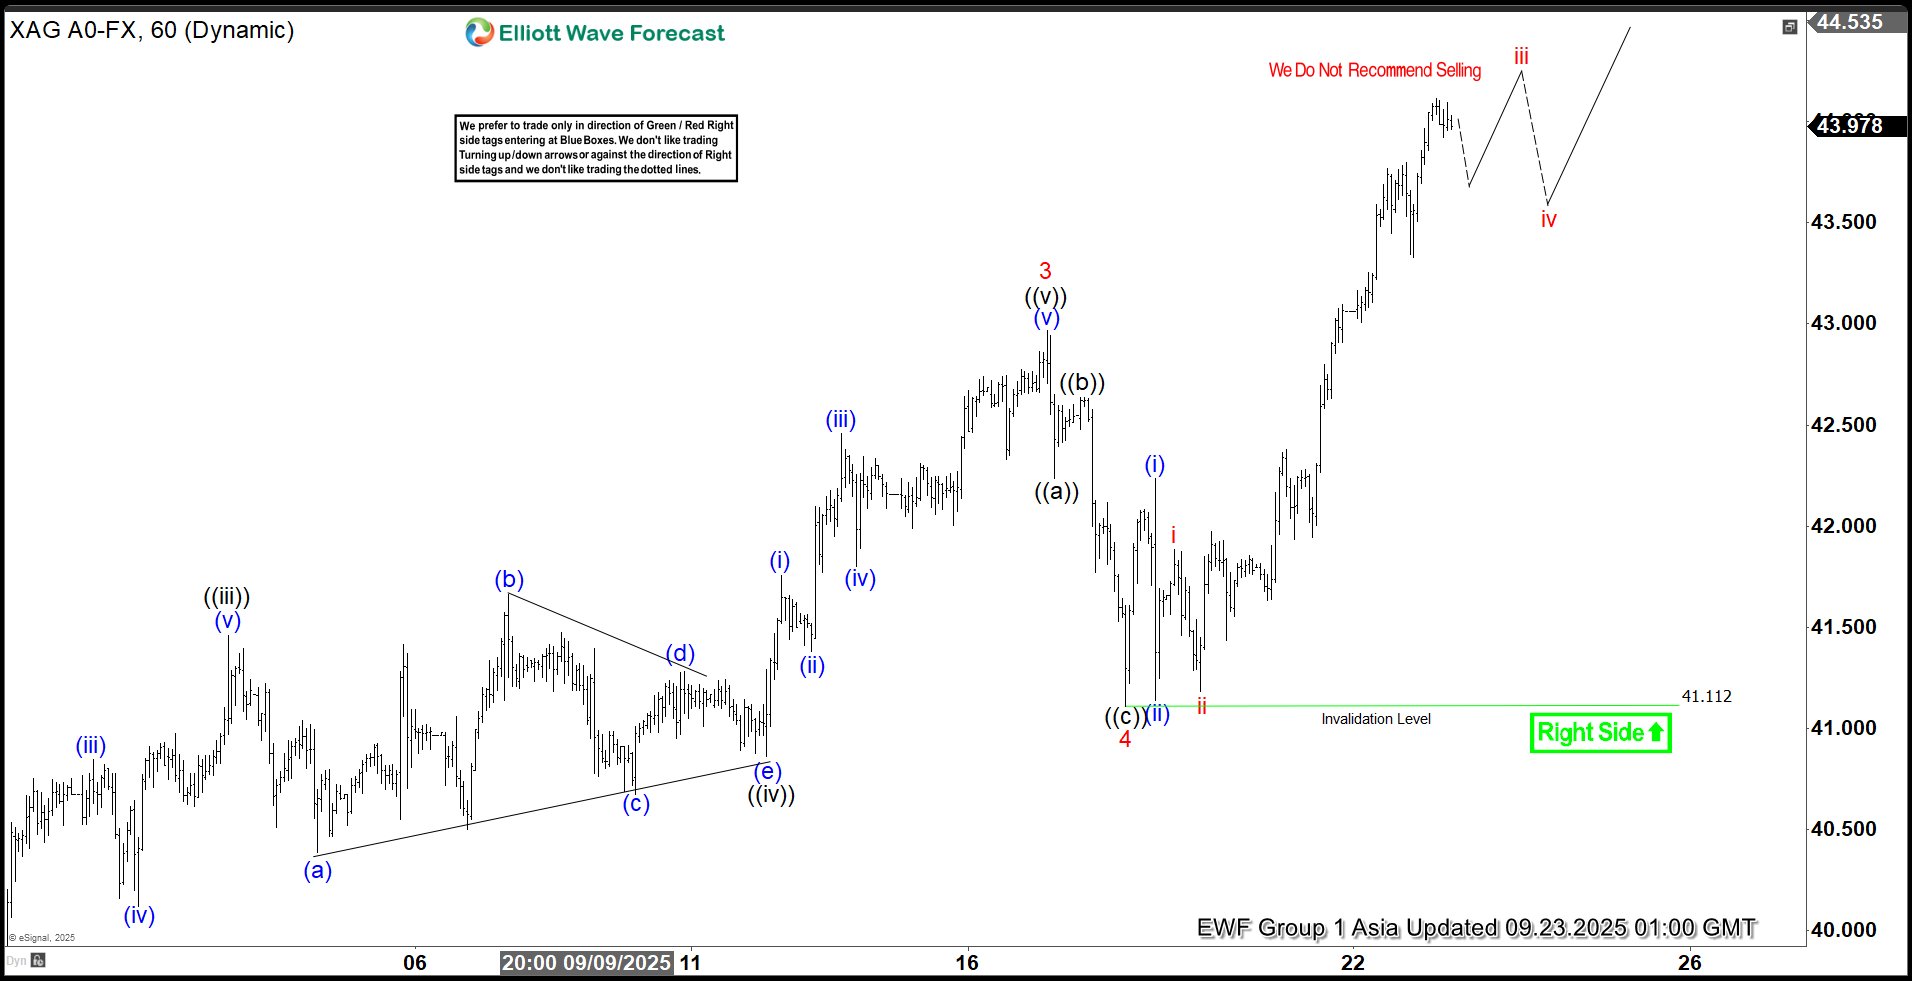
Silver (XAGUSD) Elliott Wave Outlook: Powerful Bullish Rally in Motion
Read MoreSilver (XAGUSD) is extending higher in strong impulsive structure. This article and video looks at the Elliott Wave path of the metal.
-
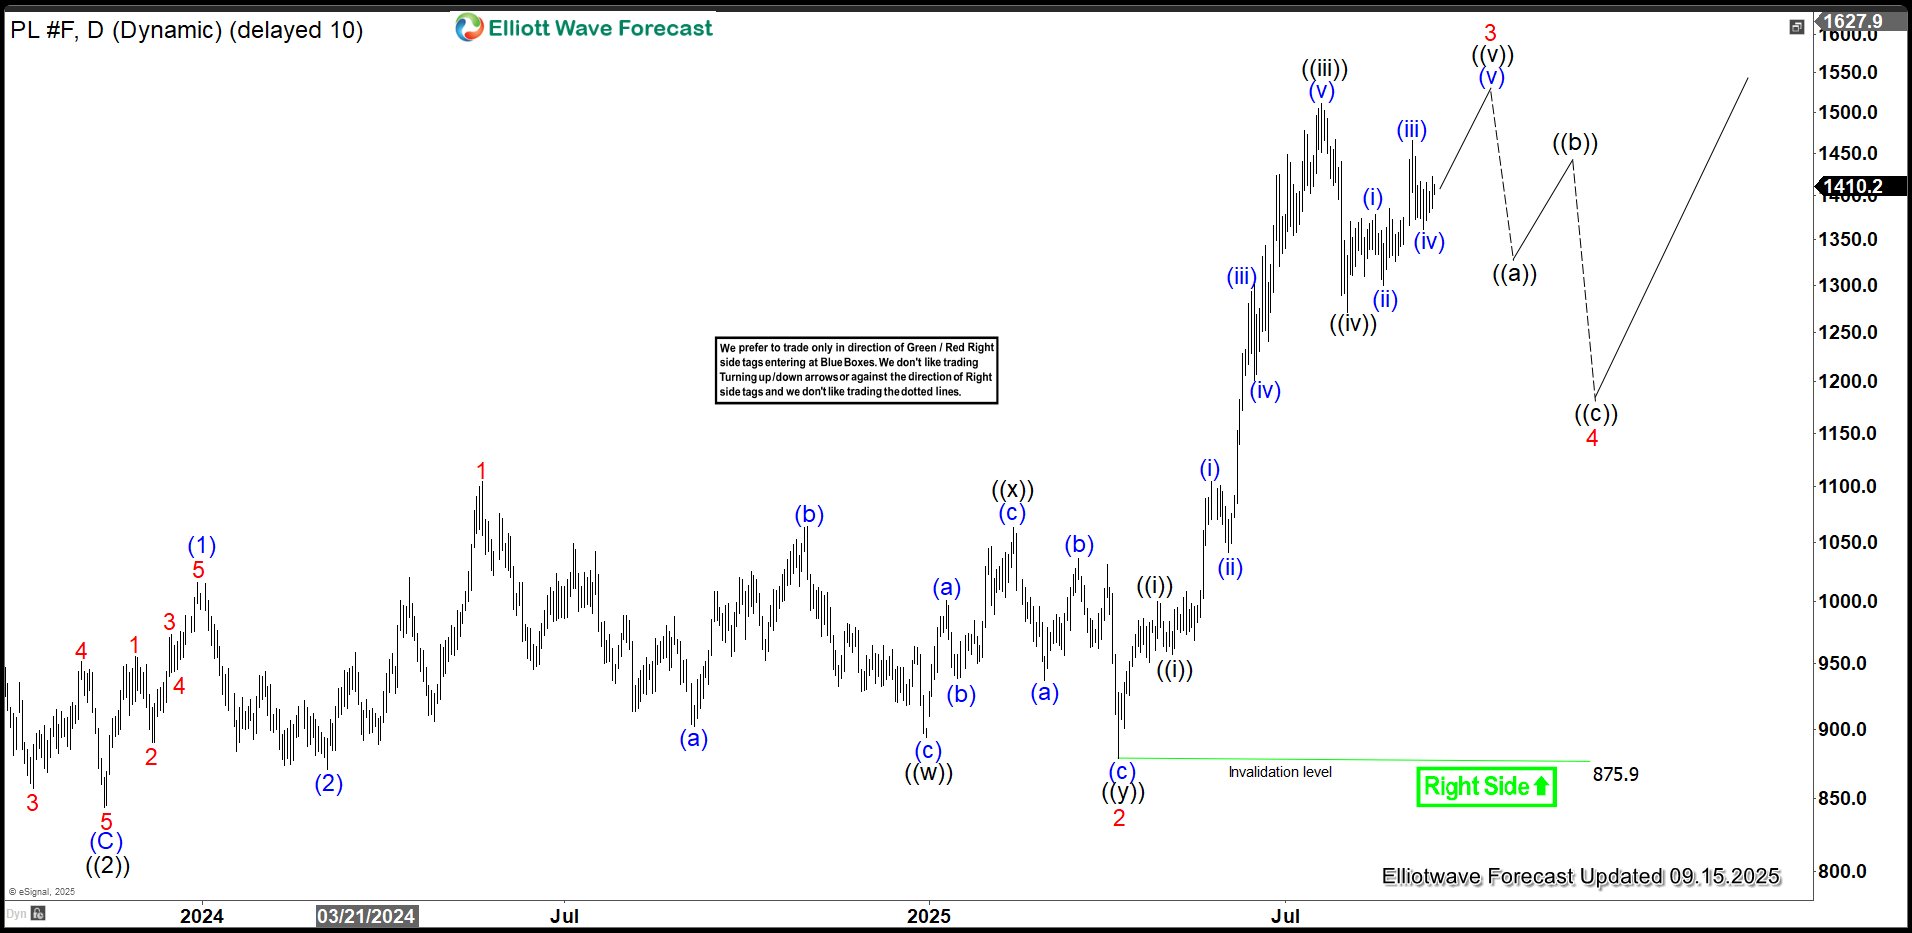
Platinum (PL) Price Soars in Strong Uptrend
Read MorePlatinum (PL) shows bullish sequence from March 2020 Low Favoring Higher. This article looks at the Elliott Wave path of the metal.
-

Elliott Wave Analysis: Gold (XAUUSD) Poised to Break Consolidation, Eyeing New Highs
Read MoreGold (XAUUSD) is looking to resume higher, eyeing new all-time high. This article and video look at the Elliott Wave path of the metal.
-
OIL (CL_F) Elliott Wave : Calling the Decline From the Equal Legs Area
Read MoreHello traders. In this technical article we’re going to look at the Elliott Wave charts of Oil commodity (CL_F) published in members area of the website. OIL has recently given us a 3 waves recovery that found sellers precisely at the equal legs area as we expected. In this discussion, we’ll break down the Elliott Wave pattern […]