
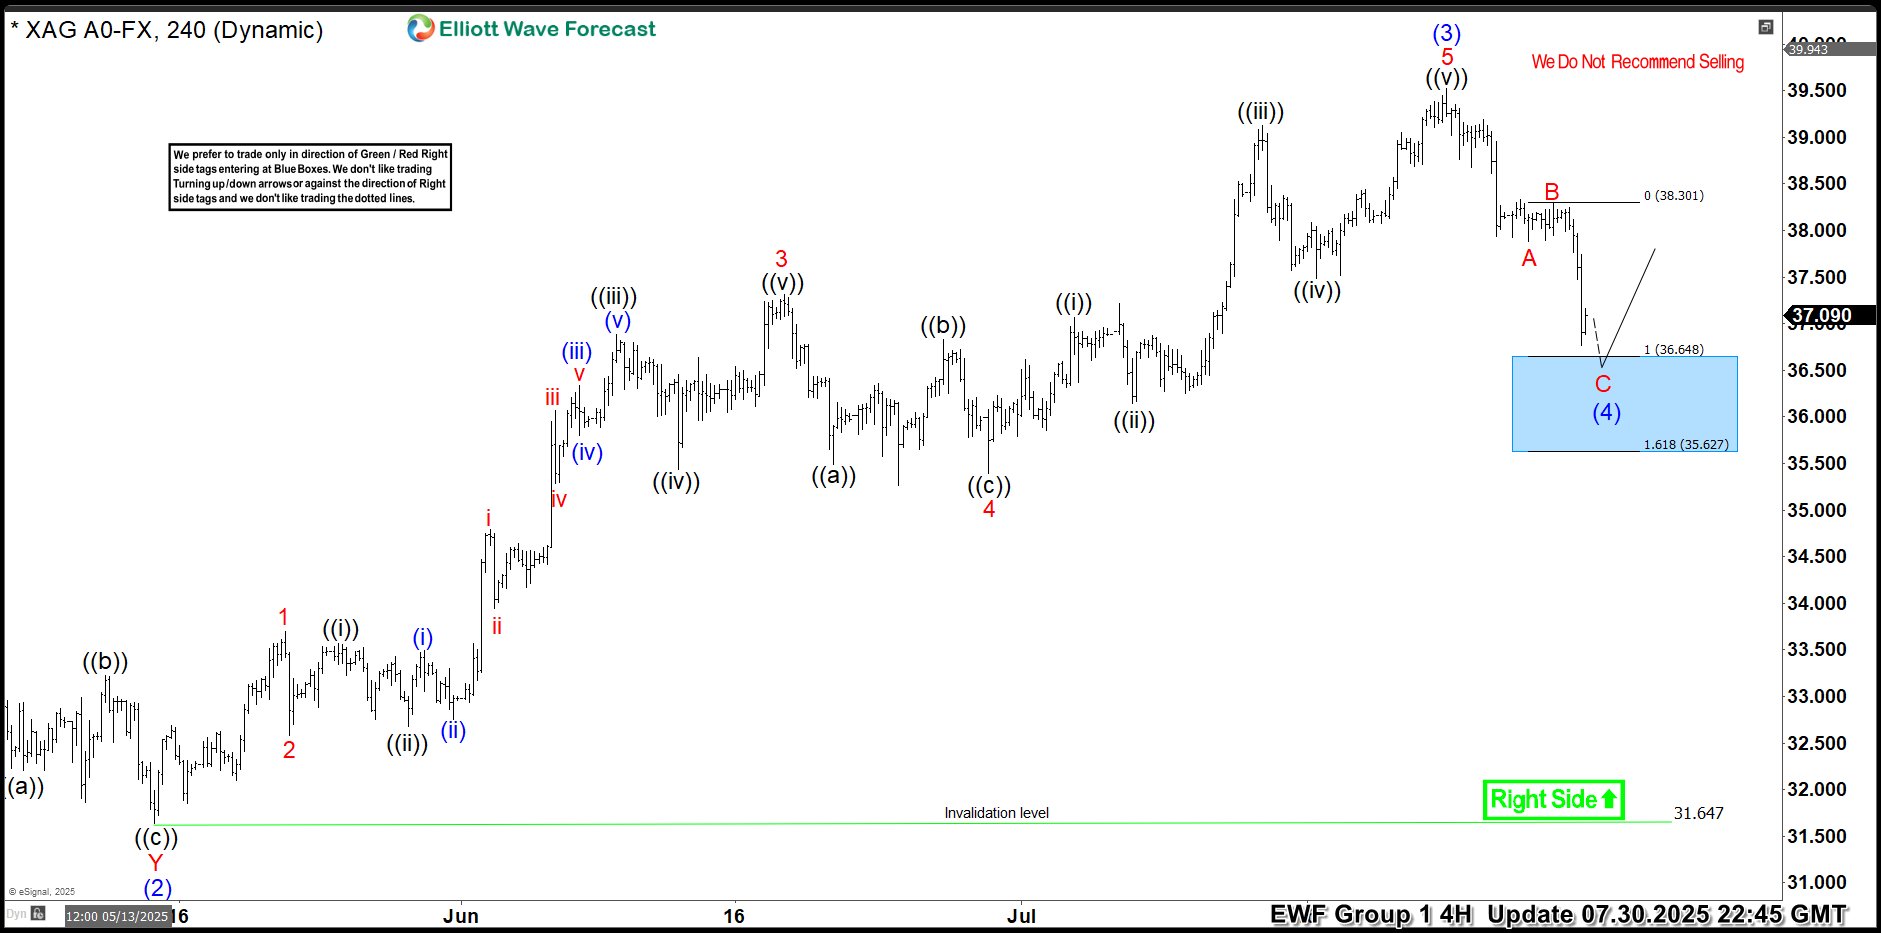
Hello traders. As our members know, we have had many profitable trading setups recently. In this technical article, we are going to talk about another Elliott Wave trading setup we got in Silver (XAGUSD). The commodity has completed its correction exactly at the Equal Legs zone, also known as the Blue Box Area. In this […]
-
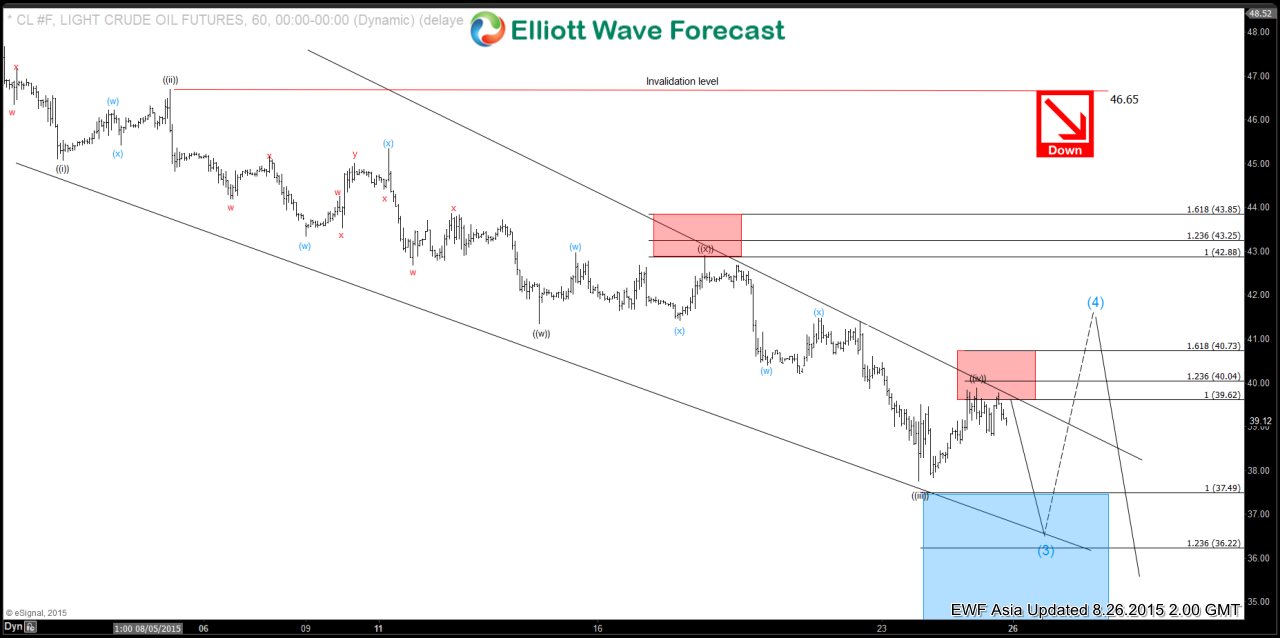
Oil (CL) Short Term Elliott Wave Analysis 8.26.2015
Read MoreRally to 49.5 ended wave 4. From this level, the internal of wave 5 of (3) lower is unfolding in 5 waves where wave ((i)) ended at 45.08, wave ((ii)) ended at 46.71, wave ((iii)) ended at 37.75, wave ((iv)) is proposed complete at 39.89 and oil has resumed lower in wave ((v)) of (3) towards 36.22 […]
-
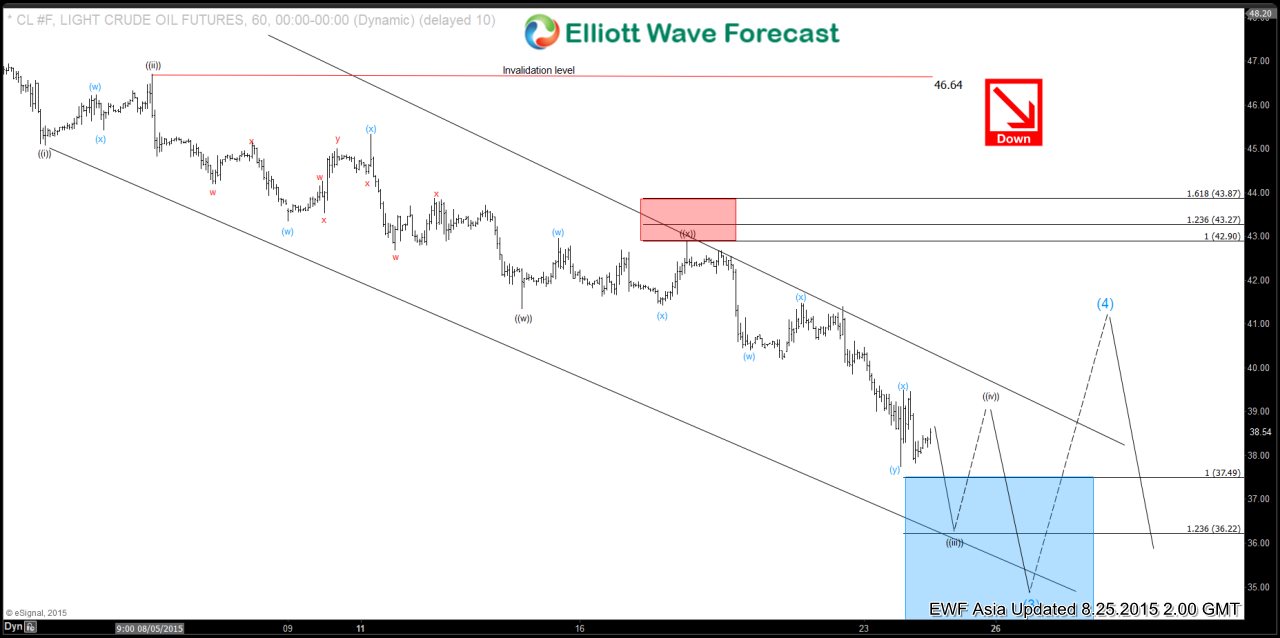
Oil (CL) Short Term Elliott Wave Analysis 8.24.2015
Read MoreRally to 49.5 ended wave 4. From this level, the internal of wave 5 of (3) lower is unfolding in 5 waves where wave ((i)) ended at 45.08, wave ((ii)) ended at 46.71, wave ((iii)) is in progress as a triple three towards 36.22 – 37.49, then it should bounce in wave ((iv)) before another leg lower […]
-

Oil (CL) Short Term Elliott Wave Analysis 8.21.2015
Read MoreRally to 49.5 ended wave 4. From this level, the internal of wave 5 of (3) lower is unfolding in 5 waves where wave ((i)) ended at 45.08, wave ((ii)) ended at 46.71, wave ((iii)) ended at 41.35, wave ((iv)) ended at 42.9, and wave ((v)) is in progress to complete wave (3) before a larger bounce […]
-
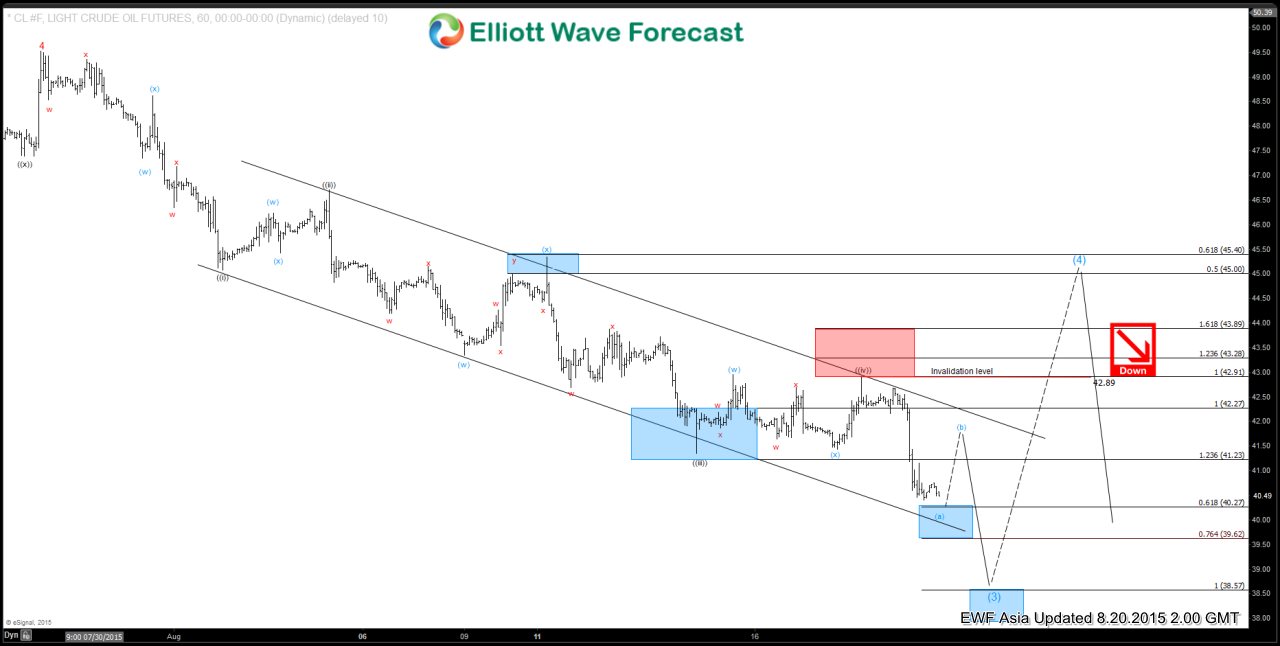
Oil (CL) Short Term Elliott Wave Analysis 8.20.2015
Read MoreRally to 49.5 ended wave 4. From this level, the internal of wave 5 of (3) lower is unfolding in 5 waves where wave ((i)) ended at 45.08, wave ((ii)) ended at 46.71, wave ((iii)) ended at 41.35, wave ((iv)) ended at 42.9, and wave ((v)) is in progress to complete wave (3) before a larger bounce […]
-
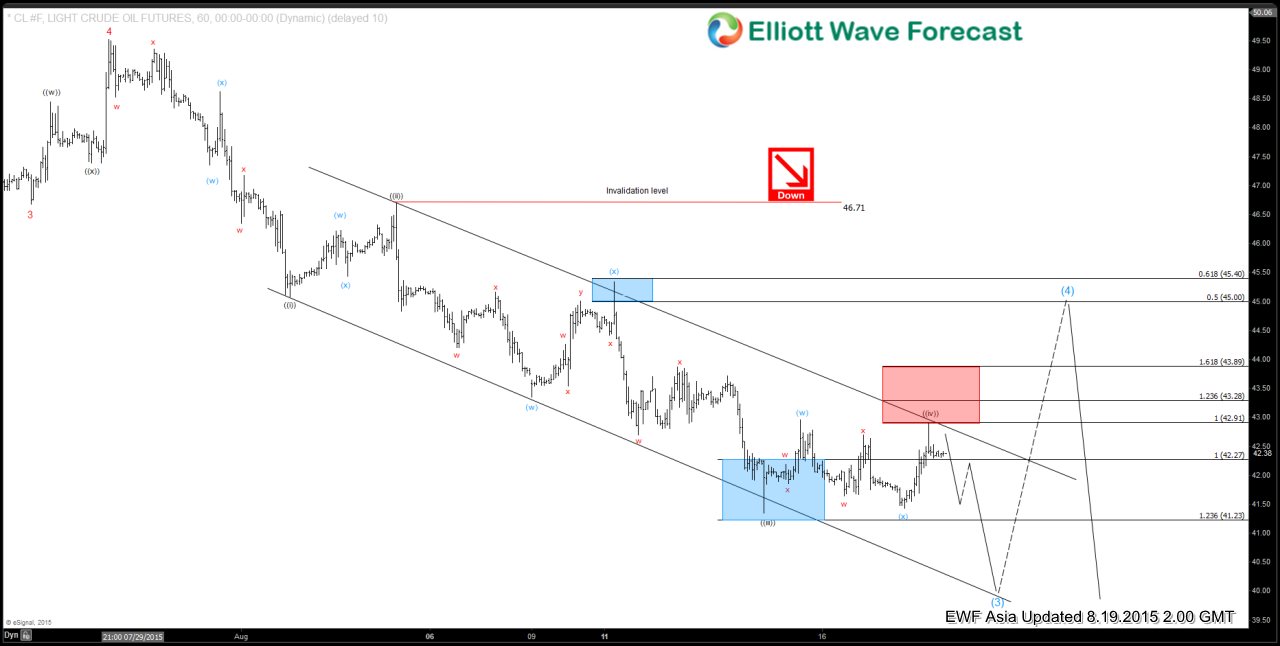
Oil (CL) Short Term Elliott Wave Analysis 8.19.2015
Read MoreRally to 49.5 ended wave 4. From this level, wave 5 of (3) decline is unfolding in 5 waves where wave ((i)) ended at 45.08, wave ((ii)) ended at 46.71, wave ((iii)) ended at 41.35, wave ((iv)) is proposed complete at 42.9, and wave ((v)) is in progress lower to complete wave (3) before a larger […]
-
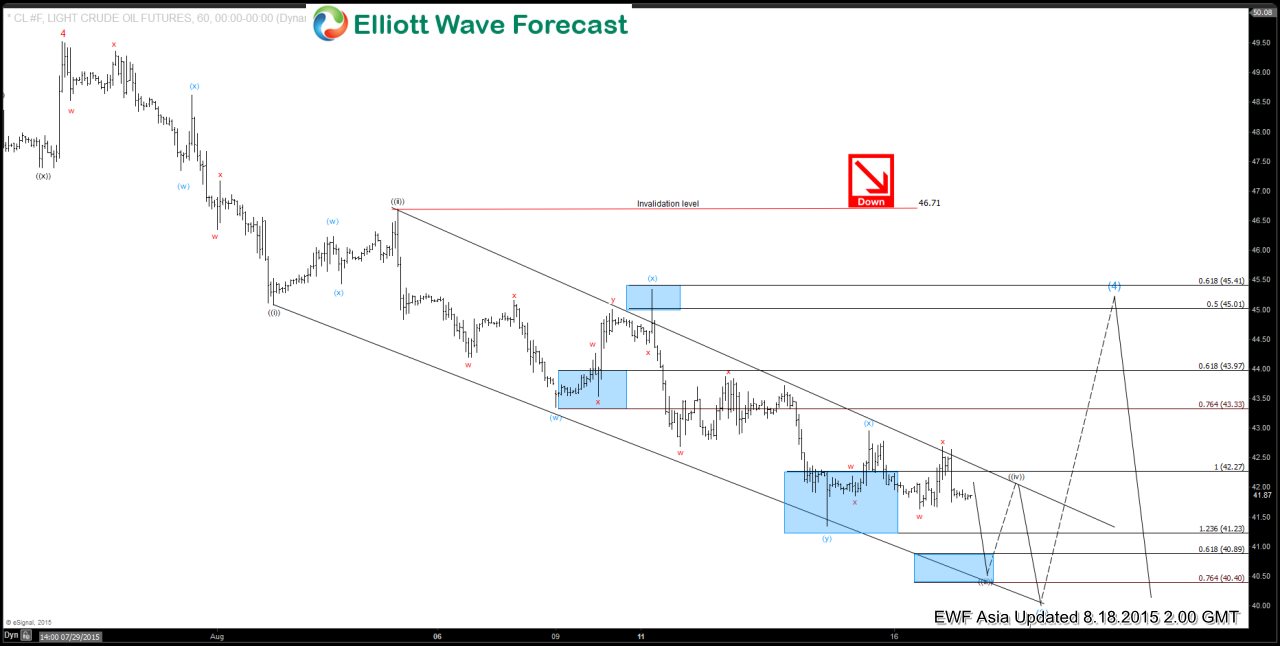
Oil (CL) Short Term Elliott Wave Analysis 8.18.2015
Read MoreRally to 49.5 ended wave 4. From this level, wave 5 of (3) decline is unfolding in 5 waves where wave ((i)) ended at 45.08 and wave ((ii)) ended at 46.71. Wave ((iii)) is in progress towards 40.4 – 40.89, then it should bounce in wave ((iv)) before another leg lower to complete wave 5 of […]