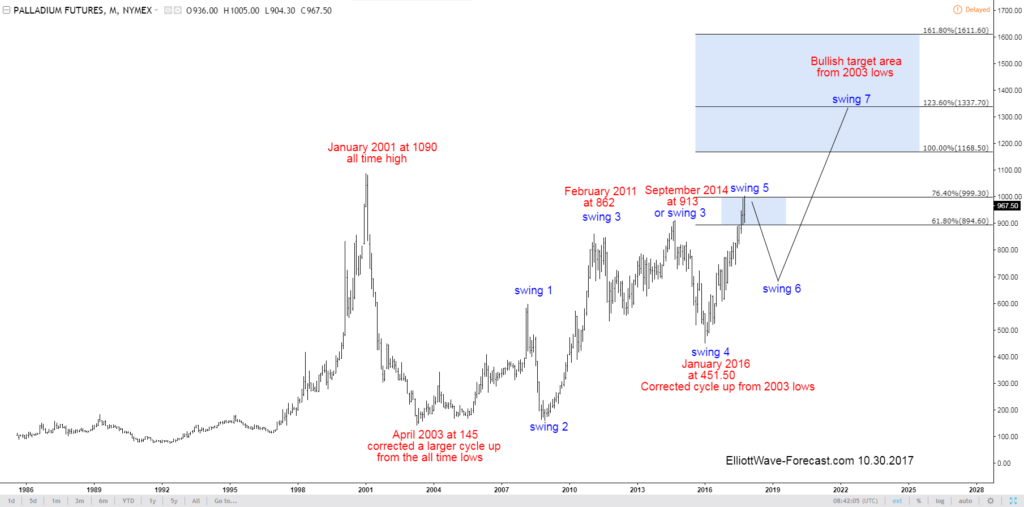
The $PA_F Palladium Weekly Bullish Swing Sequence
Palladium is a bullish commodity. Firstly I’ll mention the attached Palladium chart below is only a swing sequence labeled chart. This is from the monthly time frame. The data goes back to the 1980’s. It should not be relevant of as what the structure of the wave and cycle up into the January 2001 highs at 1090 should be. I will give it the benefit of any doubt as it is most likely a larger degree impulse. From the January 2001 highs the decline was certainly strong and deep. Certainly enough to suggest the cycle up from the all time lows had ended and was being corrected until the low of 145 in April 2003.
The best reading of the chart suggests the weekly cycle from the 1/22/2001 high is over on 4/14/2003 low at 145 and now it is showing a bullish sequence from that low in the weekly cycle. In the rally from the April 2003 lows, either a cycle ended at 862 in February 2011 or September 2014. This will not matter either way as well. More clear is the decline into 451.50 in January 2016 corrected the cycle up from the April 2003 lows. Up from the January 2016 lows the rally thus far now has broken above both of the previously mentioned February 2011 highs as well as the September 2014 highs.
Lastly these new highs creates a five swing bullish sequence up from the April 2003 lows. Even in either scenario of whether a cycle up from the 2003 lows ended at the February 2011 or September 2014 highs the cycle up from the April 2003 was corrected with the January 2016 lows. While it is above there it leaves the commodity price in either of two scenarios which are both bullish. The least bullish being it is a double three up from the 2003 lows. It would show an equal legs – 1.236 extension of the first two legs up at the 1169- 1338 area.
That is above the January 2001 highs at 1090 and would further create an even larger degree bullish sequence from the all time lows. From the 1169- 1338 area it would likely correct the whole cycle up from the 2003 lows. The more bullish version of the larger cycle up from the 2003 lows suggests it is in a larger degree wave three while it is above the January 2016 low. It would more likely see our preferred wave three extension of 1.618 at 1612+ area at a minimum. That before correcting the cycle up from the January 2016 lows.
Thanks for looking. Feel free to come visit our website . Take a trial subscription and see if we can be of help. Kind regards & good luck trading.
Lewis Jones of the ElliottWave-Forecast.com Team
Back

