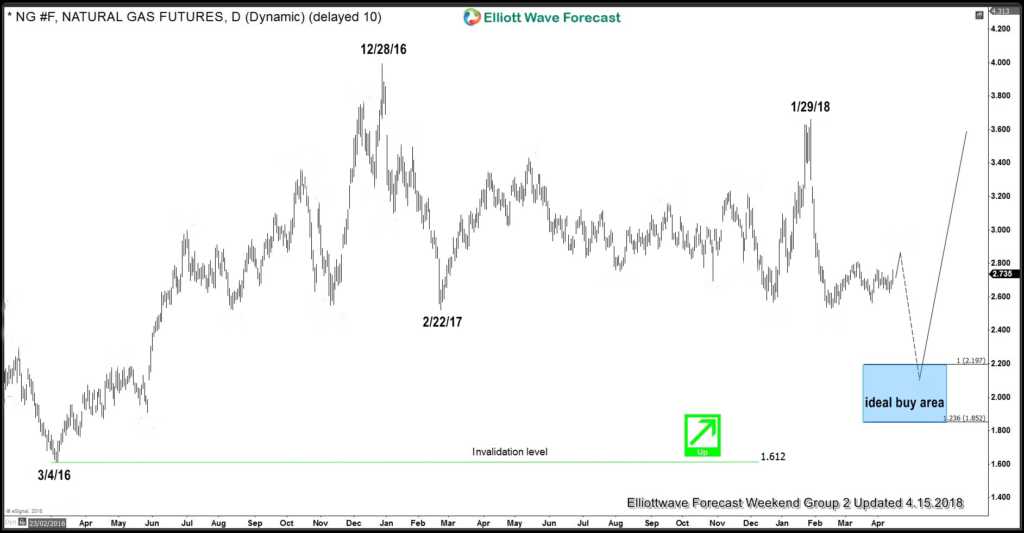
As seen in the daily graphic below you may notice it is absent of an Elliott Wave count. However the important dates with the swing highs and swing lows are highlighted that suggest the target area for buying that can be seen later. Currently Natural Gas is only showing a three swing move lower from 12/28/16 down to the 2/22/17 lows. From there it did another three swings higher into the 1/29/18 highs earlier this year. The sharp dip lower from there failed to give a clean break of the 2/22/17 lows. We have reason to think the commodity will follow through lower and complete seven corrective swings from 12/28/16. This reasoning is due to other correlated instruments in the markets. The longer term analysis is continued below the chart.
$NG_F Natural Gas Daily Chart
As mentioned earlier the commodity has not broken below the 2/22/17 lows as of of now. That break needs to be seen while the current bounce continues to show it will remain below the 1/29/18 highs. This bounce began from the 2/15/18 lows and shows a Fibonacci extension area at 2.838-3.011. As of now that is what should be seen in the near term before the expected break and swing lower.
Regarding some of the further back technical history of Natural Gas. The commodity made an all time high back in December 2005. This of course is not on the daily chart shown above. What is shown on the chart are the 3/14/16 lows that are of importance. Those lows are favored ended the larger cycle lower from the 2005 highs.
In conclusion, the cycle from the all time lows up to the 2005 highs is by most anyone’s standards seen as a bullish cycle. As mentioned earlier the dip to the 3/4/16 lows corrected that cycle. That became apparent it ended when Natural Gas bounced to the 12/28/16 highs. From there the correction lower shows an extension area on the daily chart at the 2.197-1.852 area. That has two conditions to happen while the commodity remains in a no trade area. The Fibonacci extension area remains the same while showing it will remain below the 1/29/18 highs. Lastly of course it has to break the aforementioned 2/22/17 lows.
Thanks for looking and feel free to come visit our website and check out our services Free for 14 days and see if we can be of help.
Kind regards & good luck trading.
Lewis Jones of the ElliottWave-Forecast.com Team
Back

