In this article, we will attempt to do short term and medium term Gold forecast through the chart of Gold-to-Silver ratio. The aftermath of Donald Trump’s election initially saw Gold rallying 5% on Nov 9, only to be completely reversed. Since then, we saw U.S. Dollar’s rally accelerated against other major currencies. USD Index made a new 13-year high and Gold has dropped 15.6% from 1375 peak in July 2016 to 1161 low in Dec 2016. Understandably, the question in people’s mind is whether the 4-year-old bear cycle in precious metals from 2011 peak has resumed again.
Before we start the analysis, let’s define what Gold-to-Silver ratio is. Gold-to-Silver Ratio mathematically is simply Gold’s price divided by Silver’s price. It is defined as the amount of silver it takes to purchase one ounce of gold. For example, a gold-to-silver ratio of 71 (at the moment this is written) means it will take 71 ounces of silver to buy 1 ounce of gold. Prior to the year of 1900, the Gold-to-Silver ratio ranged around 16, likely because many countries still use Gold and Silver backed currencies at that time. According to geologists, the natural rate is around 18 as there’s naturally 18 times more silver in the earth’s crust than gold. Only in the twentieth century that gold-to-silver ratio has averaged much higher between 47-50 and fluctuated wildly sometimes. When Gold-to-Silver ratio is high, this means that silver is underpriced and has more potential for price acceleration and vice versa.
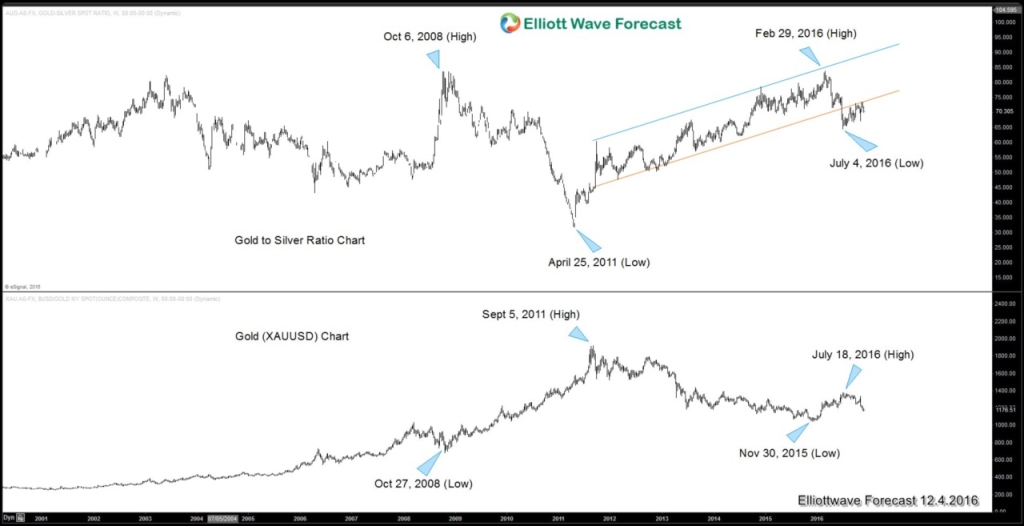
Chart of Gold-to-Silver Ratio (top) overlaid with chart of Gold (bottom)
Some observations from the weekly chart above:
1. In general, we can see inverse correlation between Gold-to-Silver ratio and the Gold chart. When the Gold-to-Silver ratio chart formed a peak, Gold’s chart formed a low and vice versa, despite the fact that they don’t do it at the exact time. Based on the general inverse correlation between the two, Gold forecast is expected higher when Gold-to-Silver ratio resumes lower. Silver (XAGUSD) should also rally when Gold-to-Silver ratio (XAUXAG) drops.
2. Since 2003, the Gold-to-Silver ratio formed a triple top around 80.
3. Gold-to-Silver ratio broke a 4 year old channel in early 2016, and further downside looks likely. So when the ratio finally turns lower, Gold forecast is expected to resume higher as well.
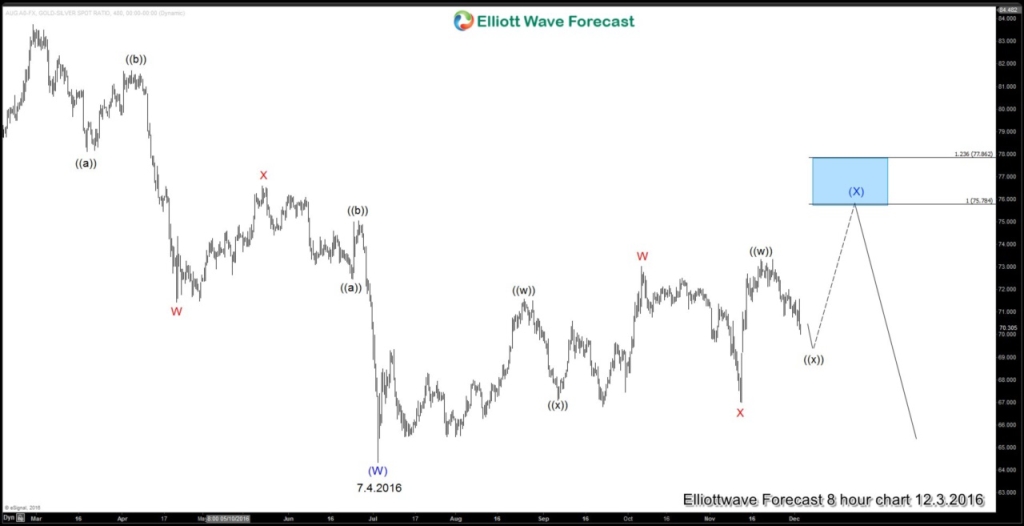
8 hour Elliott wave chart of Gold-to-Silver ratio
Elliott wave cycle up from 7.4.2016 low shows a 5 swing sequence, which suggests another leg higher is possible. Short term, while the ratio stays above red wave X at 67, the natural path provides scope for another leg higher before it resumes lower. If it breaks below 67 without making another leg higher, it is also the sign that Gold and Silver are ready to resume higher.
Video
Conclusion
Short term, while Gold-to-Silver ratio stays above 67, it has scope to extend another leg higher before the decline finally resumes. This implies that short term, both Gold and Silver have scope to extend to the downside one more leg. However, the medium and long term view of Gold and Silver are bullish as the Gold-to-Silver ratio broke a 4 year old channel and extension lower is likely.
Take our free 14 Day Trial to access our services. We provide 24 hour coverage of forex, indices, and commodities. Our services include professional Elliott wave forecast in 4 different time frames, 24 hour chat room, live sessions, live trading room, education, and more!
Back


