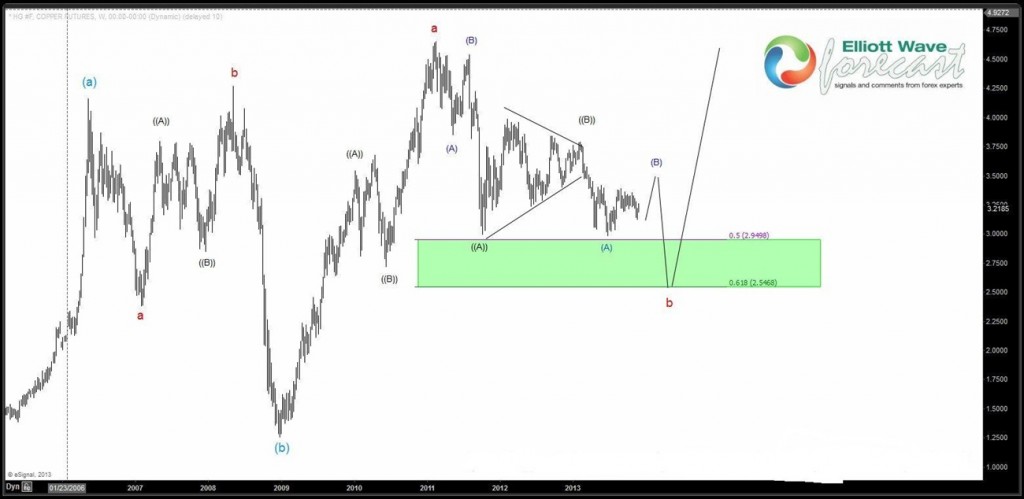
Metal is correcting the weekly cycle from 2008 lows. It did get very close to 50 fib retracement (2.949) but didn’t fully test it. Also, metal is showing 5 swings lower from the high of red wave “a” and is currently in blue wave ( B ) pull back. Once completed, metal should turn lower for 61.8 fib retracement (2.546) to complete red wave “b” and resume the rally.
Why does this chart look different to previous Chart Of The Day posts ?
Within the next few days, this is how all charts would look like
- Labels with 2 parentheses (( )) would be labelled in BLACK
- Labels with 1 parentheses ( ) would be labelled in BLUE
- Labels without parentheses would be labelled in RED
You also see a green box highlighting the area between 50 – 61.8 fib retracement zone (2.546 – 2.949) which indicates the buy zone on this chart (weekly time frame). This is another effort by us to help keep our members on right side of the market and to keep them away from bad trades.
Green box indicates the trend is up so traders should only be looking for buying opportunities at the completion of red wave “b” and not be selling into red wave “b”.
- When the box is green, that highlights the buying area
- When the box is red, that highlights the selling area
- When there is no box, that means there is no trade on that particular time frame.
This is how all charts would be done and we hope this will greatly improve the understanding of our charts in members and help them trade in direction of the trend (right side)
Back

