Gold has been used as the currency of choice throughout history, despite what the central banks of the world say. Ben Bernanke, then the Fed Chairman, famously said that Gold is not money in 2011 during congressional hearing with Senator Ron Paul.
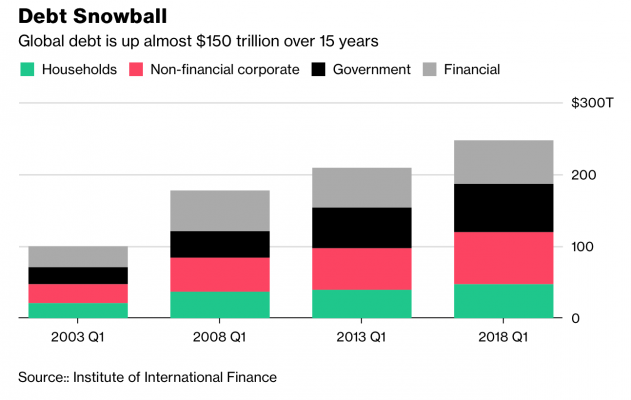
Since President Nixon removed Gold’s peg from the US Dollar in 1971, the world has officially came off the yellow metal’s standard. This new fiat system is backed only by faith in the government who issue it. Once the gold standard was dropped, countries began printing more of their own currency. Today, the world has a cumulative total debt of $250 trillion as of the first quarter of 2018.
The world’s debt has continued to accelerate in the last decade due to central banks manipulating interest rate and making it so cheap. As central banks start to tighten last year, it is no longer cheap to accumulate debt. As a natural consequence of the ever expanding debt, the world’s fiat currency will continue to devalue. A weaker currency makes it easier to pay off debts. For example, if the U.S. dollar’s value falls in half, Americans will owe only 50% of the debt’s value.
Indeed the yellow metal has continued to ascend against various world’s fiat currency. Or more accurately, it is the currency against which Gold is measured that loses their value. Many people only look at Gold in terms of U.S. Dollar and conclude that Gold has been in the bear market in the past 7 years. However, when we look at other markets, we can see the yellow metal has been performing very strongly. For example, Gold has made a new all-time high against emerging market currencies. These include currencies like Turkish Lira, Russian Ruble, Indonesian Rupiah, South African Rand, Brazilian Real, and the Mexican Peso. Investors in these countries do not switch to more stable currencies like the Euro or the U.S. Dollar. Instead, they are moving to hard currency like Gold.
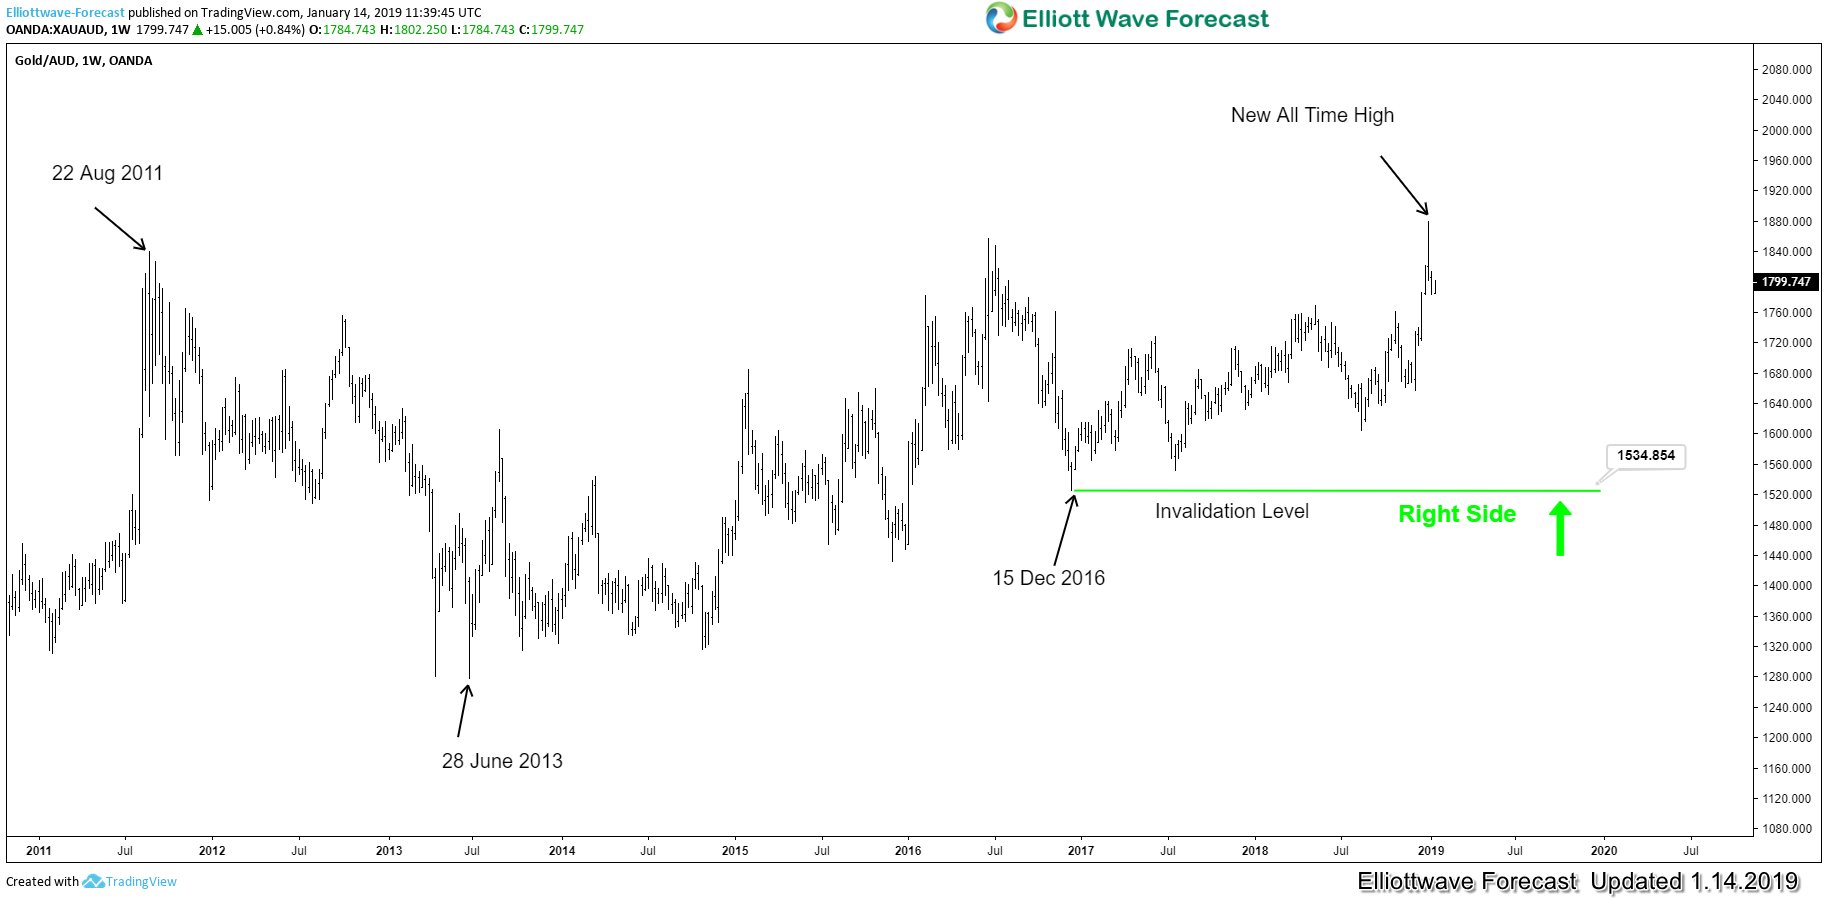
And it’s not just against the emerging market currencies. This year, Gold has broken to new all time high against Australian Dollar as below’s chart shows:
XAUAUD Gold In Australian Dollar Weekly Chart
The yellow metal in Australian Dollar terms has broken to new all time high above 22 Aug 2011 high, which now makes it bullish against 15 Dec 2016 low (1534.8) in the first degree. Rally from there is also showing a 5 swing up, favoring further upside while dips stay above 1534.8.
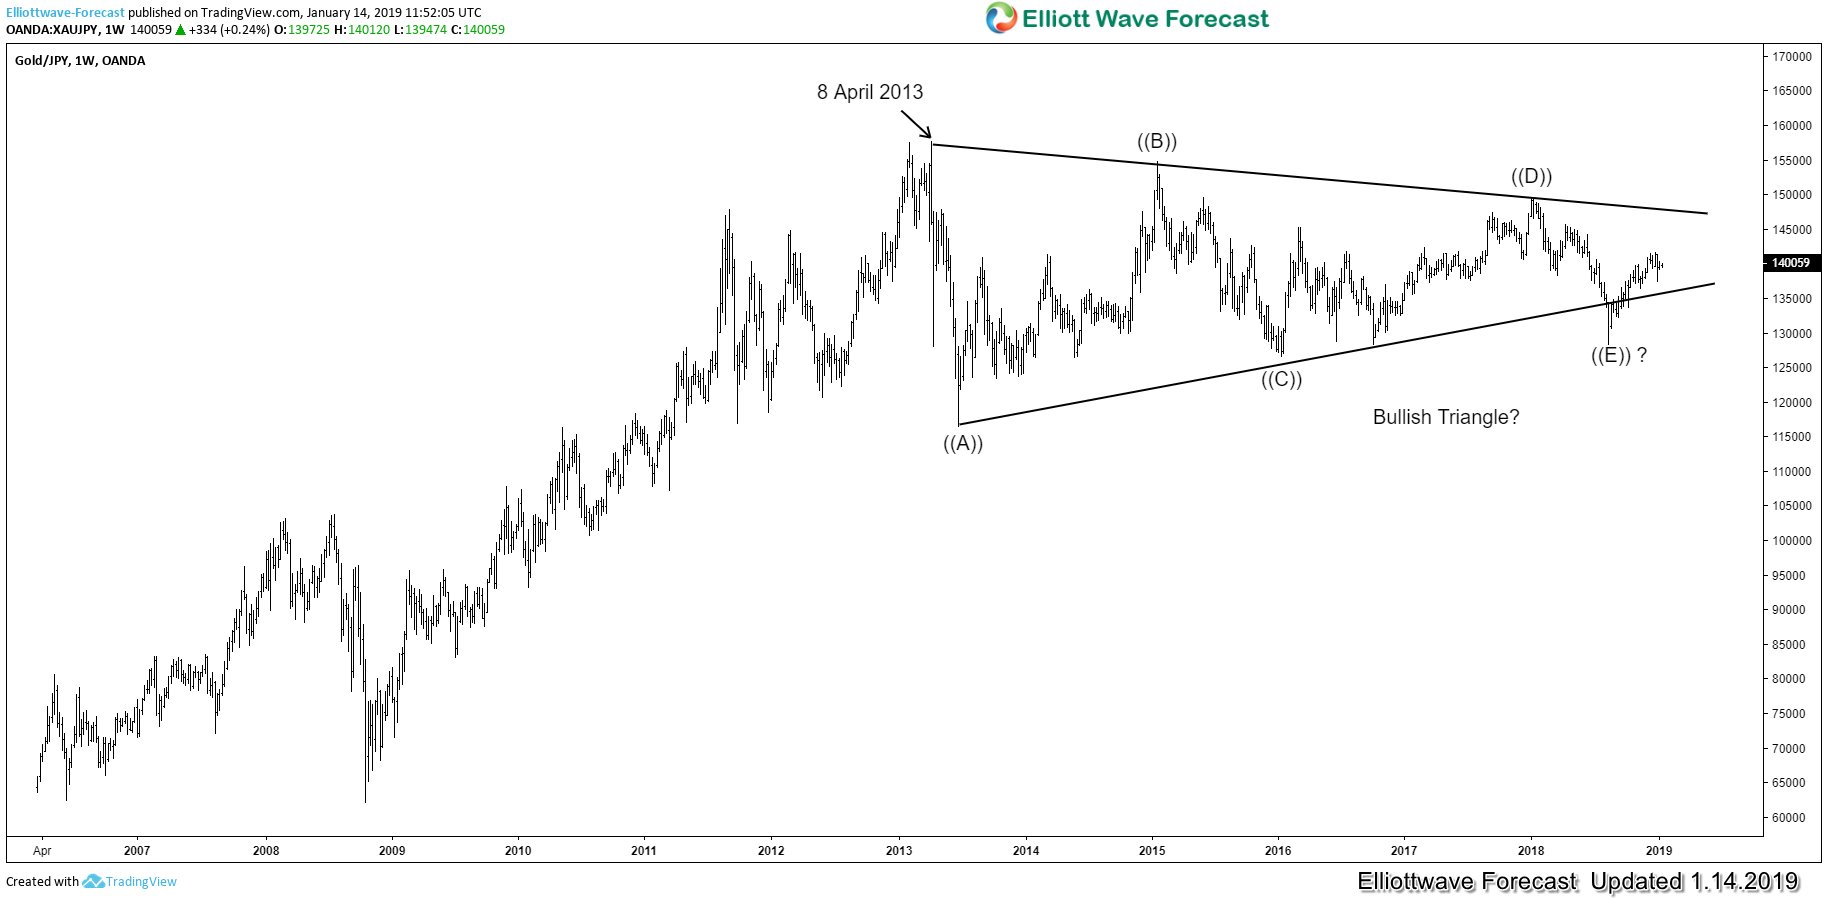
The yellow metal also almost makes all-time high against Canadian Dollar. It is only CAD$47 away from the all-time high in Canadian dollar’s term. Thus, major developed economies currencies have started to fall in value against the yellow metal in 2019. Gold against the Japanese Yen also looks like a multi-year Elliott Wave symmetrical triangle which likely break out to the upside like chart below shows:
XAUJPY Gold in Japanese Yen Weekly Chart
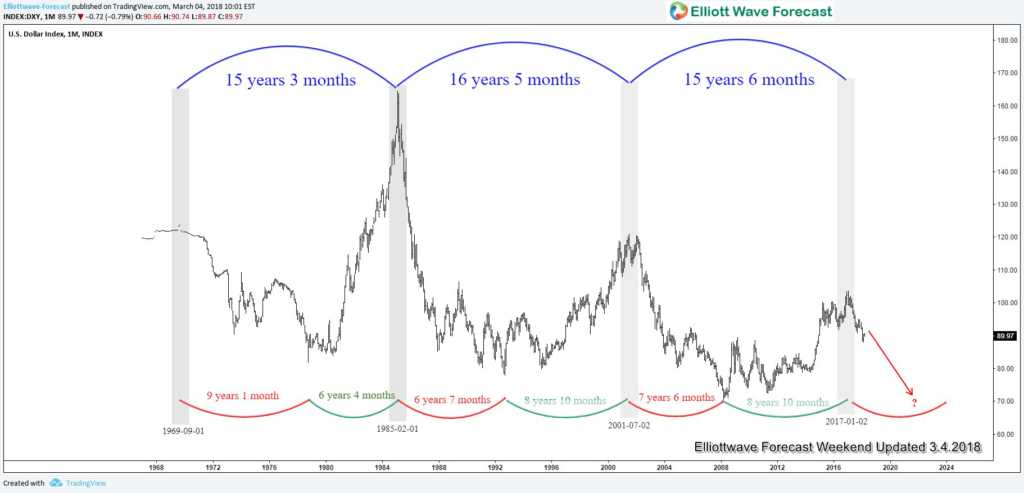
A separate cycle analysis on USD cycle we did last year remains valid. The analysis seems to suggest that USD has made important high in year 2017 and can be due for multi-year decline like the chart below shows:
US Dollar Time Cycle Analysis
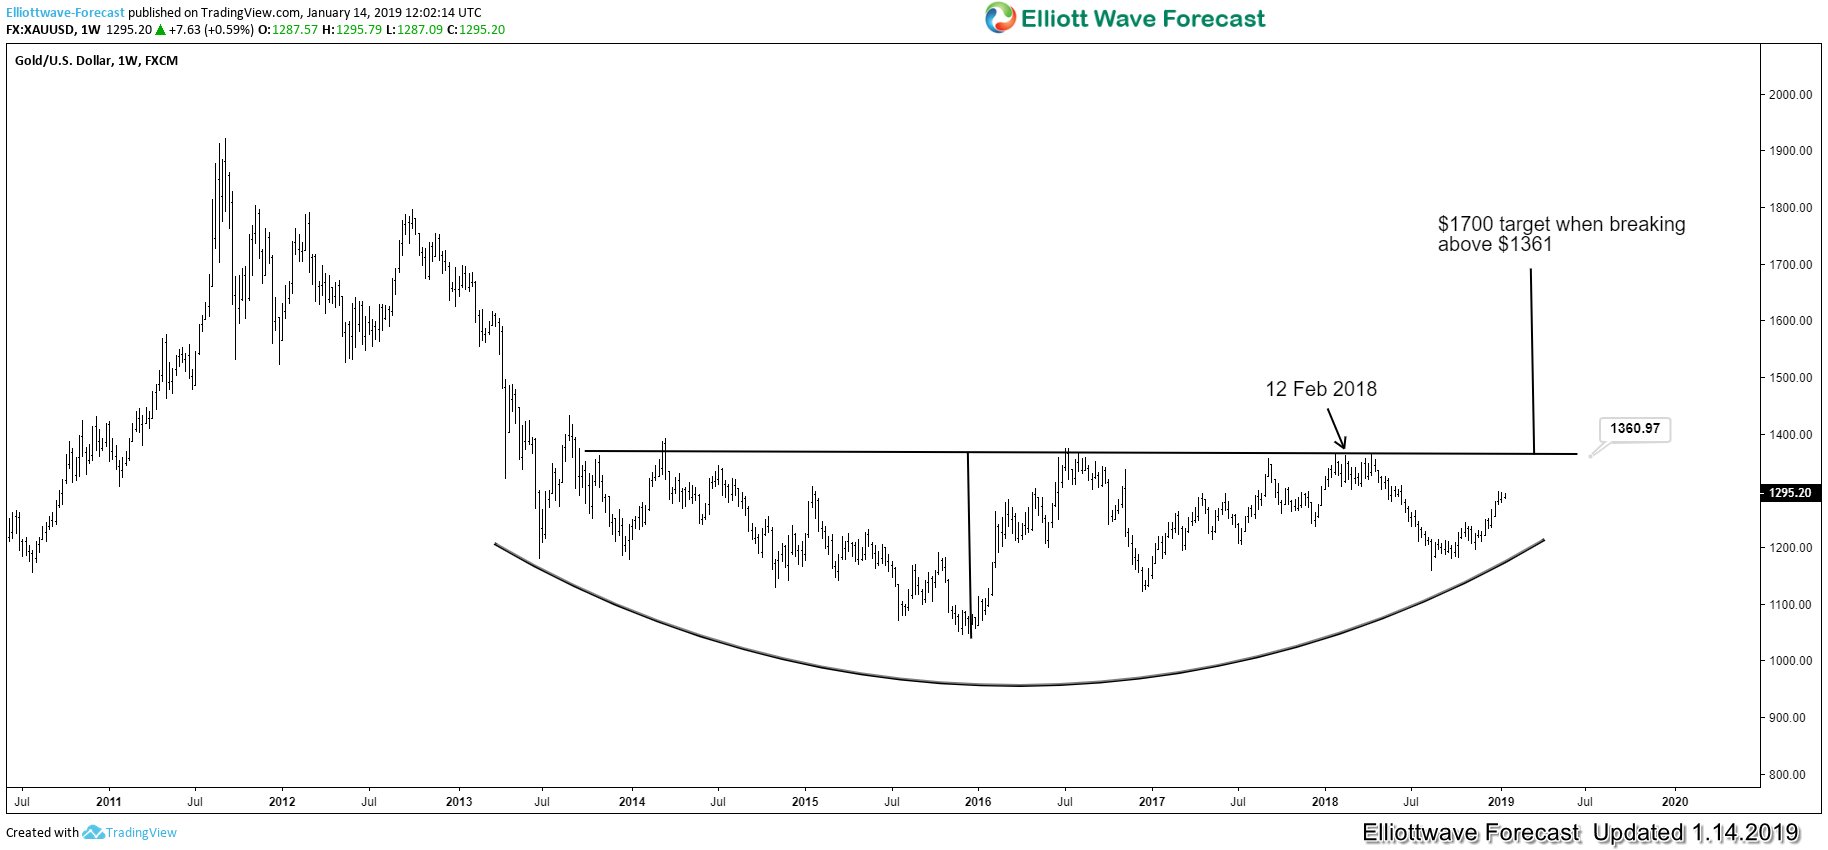
With the Fed close to ending the current rate hike cycle while other central banks like the ECB catches up, USD may finally start to weaken this year. When this happens, Gold (XAUUSD) can finally catch up higher. The key level for the yellow metal remains to be 12 Feb 2018 high at $1361 as chart below shows. A break above there can take us to $1700 as the next swing target
XAUUSD Gold in U.S. Dollar Weekly Chart
The structure of weekly Gold above is a multi year rounded bottom (inverse head and shoulder) with a neckline at $1361. A break above the neckline at $1361 suggests a move higher to $1700, which is the same distance from the head to the neckline.
Keep in mind that market is dynamic and price action may have changed since the writing time of the article. To get regular Elliott Wave Forecast updates on Gold or other instrument in 4 time frames, you can take our 14 days trial here –> 14 days FREE Trial.
Back
